ON THIS PAGE
Dashboard Overview
What is J-Web Dashboard
The J-Web dashboard provides a unified overview of the system and network status retrieved from SRX Series Firewalls.
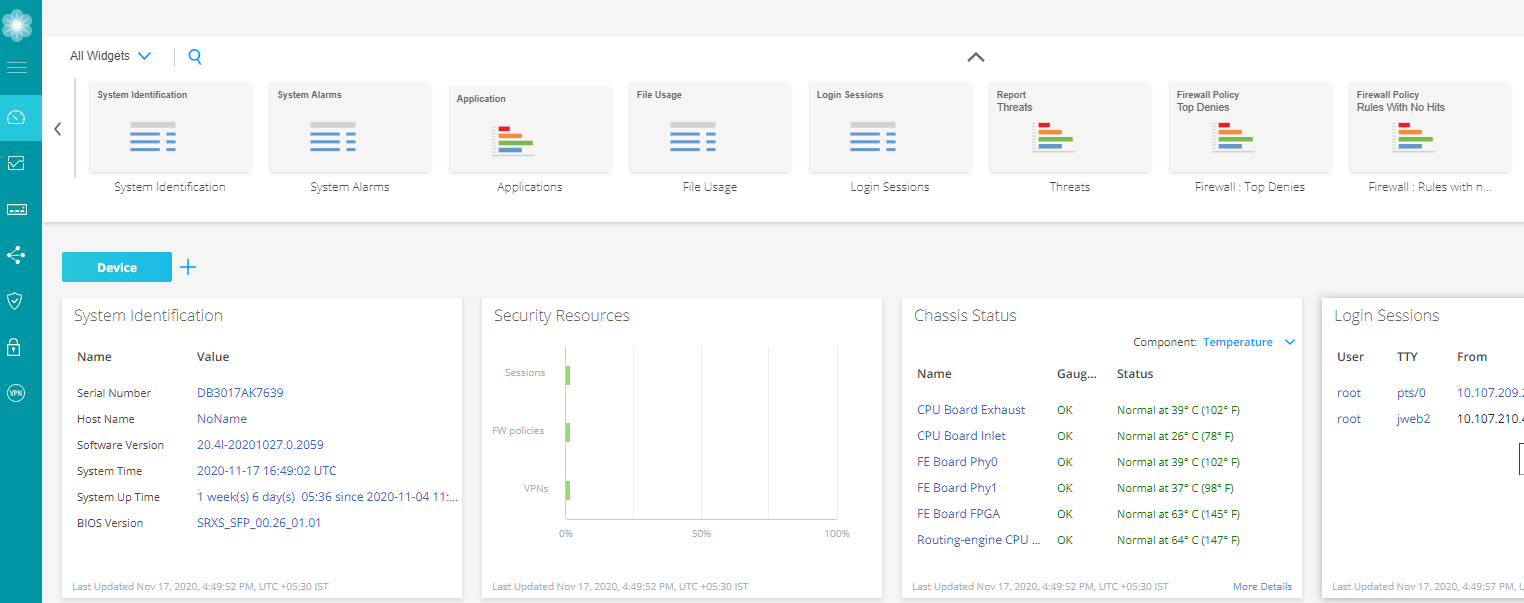
To use the dashboard at the top-level menu, select Dashboard. By default, the Dashboard page displays all the widget thumbnails.
Figure 1 shows an example of the Dashboard page of SRX345 Firewall.
Work with Widgets
Each widget pane acts as a separate frame. You can click + icon to add separate dashboard and name it as per your ease. You can refresh the display of the Dashboard page by clicking the refresh icon at the upper-right corner above the widget pane.
You can choose any one of the categories to view widgets on your device:
-
All Widgets—Displays all the supported widgets
-
Applications—Displays only the supported application related widgets
-
Devices—Displays only the supported device related widgets
-
Security—Displays only the supported security related widgets
-
Starting in Junos OS Release 21.4R1, on-box reports related widgets are removed to speed up the J-Web UI loading process.
-
The Threat Activity pane is not available on SRX5400, SRX5600, and SRX5800 devices.
-
For SRX Series Firewalls configured for logical systems, the Logical System Identification and Logical System Profile panes are displayed when you log in as a user logical system administrator. These are the only logical system panes available in Dashboard Preferences.
-
If the rescue configuration is not set, the set rescue configuration link directs you to the Device Administration > Configuration Management > Rescue page to set the rescue configuration.
To use a widget on the Dashboard:
-
Drag the widgets from the palette or thumbnail container to your dashboard.
When you add more widgets on the J-Web Dashboard, you can observe high CPU usage on the Routing Engine for a short span of time on every refresh. We recommend that you use four widgets for lower CPU consumption.
-
Mouse over the top of each widget to minimize, refresh, and close by using the respective icons.
Note:The dashlet data is refreshed every minute by default. You cannot manually configure the refresh interval of the dashlet. If the data is not aged in the cache, data loads from the cache during the dashlet refresh. If the data is aged, it is retrieved from the device during the next refresh interval cycle.
Table 1 provides the dashboard widgets options based on the selected device.
|
Field |
Description |
|---|---|
|
System Alarms |
Provides the received time, severity, description of the alarms and the action to be taken. |
|
System Identification |
Provides system details such as serial number of the software, hostname, software version, BIOS version, system uptime, and system time. |
|
Login Sessions |
Provides the user credentials, login time, idle time, and host. |
|
File Usage |
Provides current space requirements for log, temporary, crash, and database files. Click Maintain to download or delete some or all of these files. Note:
File Usage widget supports RE3 line cards for SRX5000 line of devices. |
|
Resource Utilization |
Provides a graphical representation of the CPU, memory, and storage used for both the data and the control planes. The CPU control also shows the load average value for 1 minute when you mouse over CPU Control. Note:
Resource Utilization widget supports RE3 line cards for SRX5000 line of devices. |
|
Signal Strength |
Displays the signal strength of the device. |
|
Interface: Most Dropped Packets |
Displays top 5 interfaces based on the CLI response; top-count will increase to 10. |
|
Security Resources |
Provides the maximum, configured, and activated number of sessions, firewall/VPN policies, and IPsec VPNs. |
|
Storage Usage |
Displays used and available storage and usage information about other system components. |
|
Logical System Identification |
Provides the logical system name, the security profile assigned to the logical system, the software version, and the system time. |
|
Logical System Profile |
Displays the types of resources that are allocated to the user logical system, the number of resources used and reserved, and the maximum number of resources allowed. |
|
NAT - Top Source Translation Hits |
Displays the top 10 source translation hits. Click More Details to view source NAT logs at Monitor > Logs > All Events. |
|
NAT - Top Destination Translation Hits |
Displays the top 10 destination translation hits. Click More Details to view destination NAT logs at Monitor > Logs > All Events. |
|
IPsec VPNs (IKE Peers) |
Displays status count of IPsec VPN topologies, such as ADVPN Hub and Spoke, Remote Access, and Site-to-Site/Hub & Spoke. Click More Details to redirect to the Monitor > Network > IPsec VPN page. |
|
VPN Monitoring |
Displays the total number of IPsec VPNs (Total VPNs for All VPNs and total remote users for Remote Access). All VPNs option includes Site to Site, Hub & Spoke, ADVPN Hub, and ADVPN spoke. Remote Access includes Juniper Secure Connect and NCP Exclusive Entry Client. Widget pane also displays the VPNs status with a color code:
Click More Details available on the widget pane to redirect to the Monitor > Network > IPsec VPN page. On the widget pane, for the All VPNs option, each configured IPsec VPN is represented as an individual tunnel icon or box. On the widget pane, for the Remote Access option, each IKE SAs corresponding to the configured IPsec VPN is represented as an individual tunnel icon or box. If there are no IKE SAs for the VPN, then a single box is shown as down. When you hover over the box, widget displays VPN tunnel details such as Remote gateway, VPN name, IKE status, IPsec status, local IP, and remote IP. Click More Details to redirect to the Monitor > Network > IPsec VPN page with the VPN name filtered. |