Appendix: Device, Application and WAN Monitoring
This section covers most of the Day 2 aspects of your SD-WAN installation.
Device Information Page
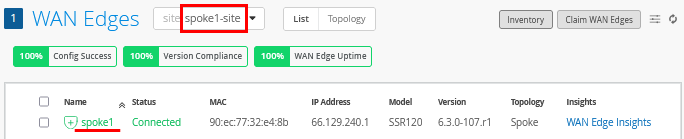
To get to the basic device monitoring page, click WAN Edges, select a site, and then click on the device as shown below:
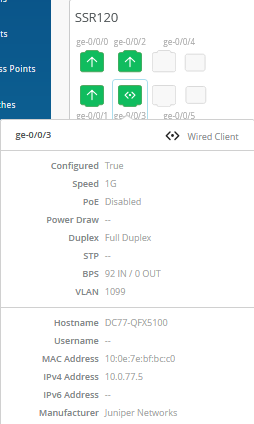
At the top of the device information page, you see a graphical front view of the device, its ports, and some baseline status information.
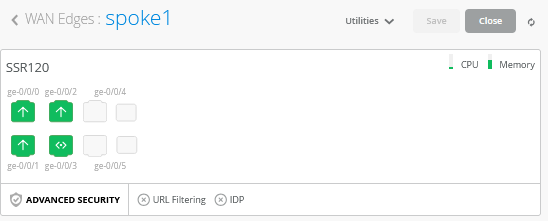
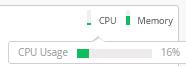
Hover the mouse over each status icon for CPU and memory to see how the device is behaving.
Next, hover the mouse over some of the device ports to review what is configured and detected. In this example, you see at the bottom that the lab switch is detected as a client attached to the port:
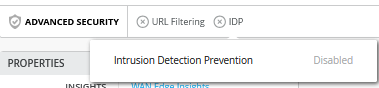
Below the front ports, hover the mouse over each security service and review the displayed information.
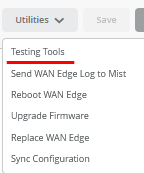
Check out the Utilities menu. Then, click Testing Tools for more options.
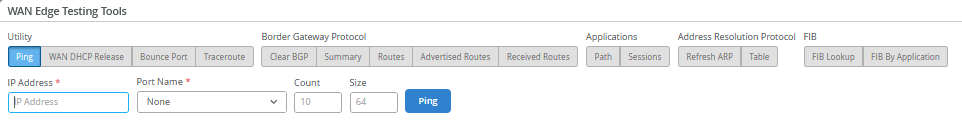
The Testing Tools enable:
- Simple commands such as ping and traceroute.
- Review the BGP protocol that distributes the routes of the VPN overlay.
- Review Application Path and Session information.
- Review the ARP status.
- Review the FIB for your application traffic.
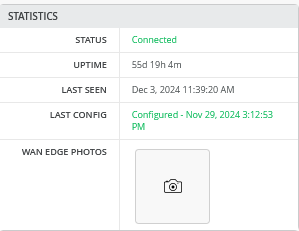
Back to the Device information page, review the Statistics pane for information.
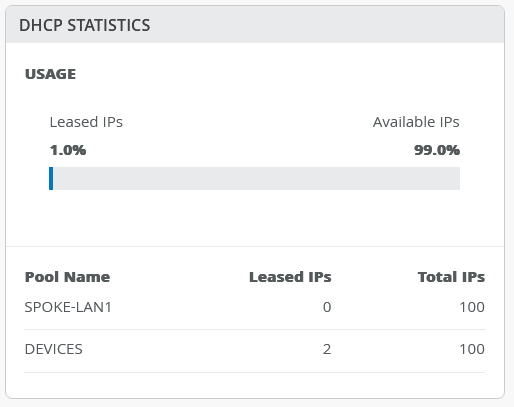
In case you have configured DHCP servers on the WAN router, the DHCP Statistics pane displays the very useful information about the leases handed out.
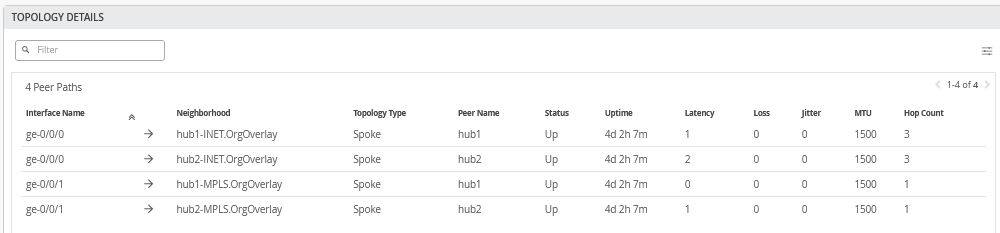
The status of the Secure Vector Routing VPN Overlay Tunnels can be seen in the Topology Details pane:
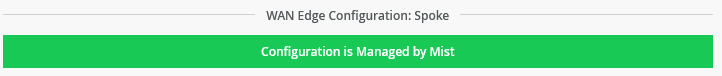
Then, review the device configuration. Usually, it should be inherited by the templates or profiles you have used. You can make individual changes to the configuration to be pushed to the device.
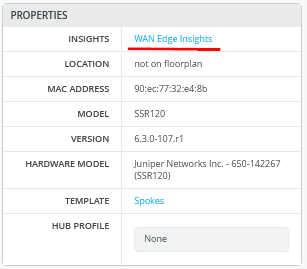
Finally, review the Properties pane for information and then click WAN Edge Insights for the next level of information about the device.
WAN Edge Insights Page
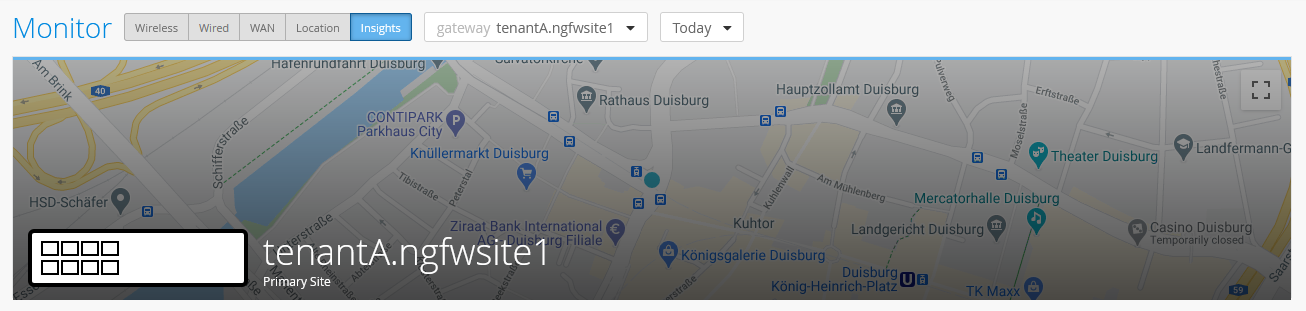
At the top of the WAN Edge Insights page, you see the site’s location-based information showing where this gateway is on a map.
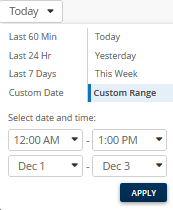
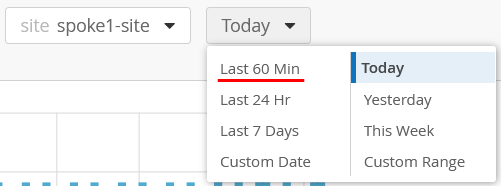
At the top of the page, you can also select the time period for the data you want to view. By default, the time period is set to Today.
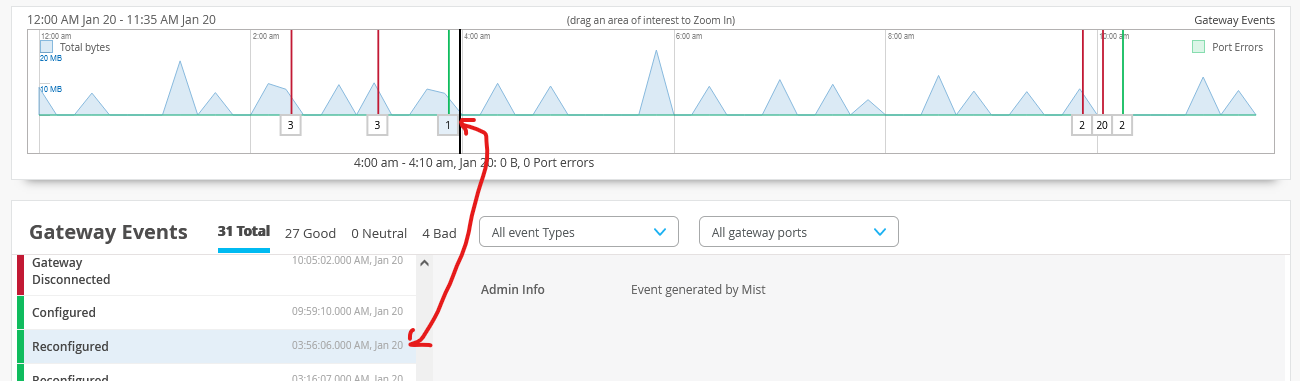
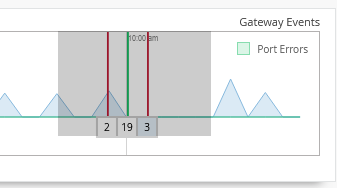
Below the street map, you see the timeline for gateway events (and information about the traffic passing through the device at that time). With your mouse, you can select an event to check, which is selected in the events reports as shown below:
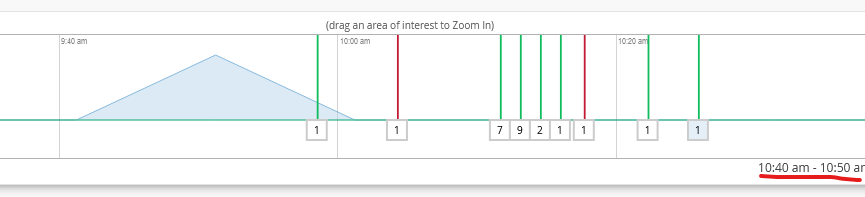
You can also zoom in by selecting an area in the timeline with your mouse cursor. Ensure the selected time period is not too short.
Then, get a more detailed view for the previous time period:
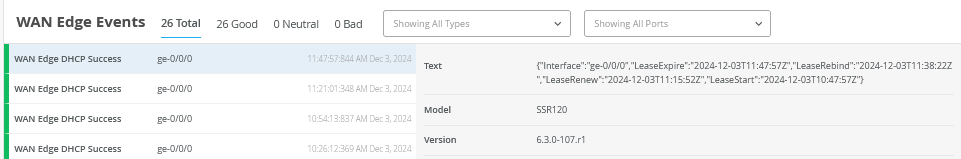
Then, review the Gateway Events pane:
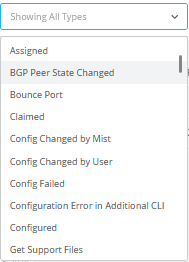
You can filter the events displayed as shown below:
You can filter the events displayed for specific ports as shown below:
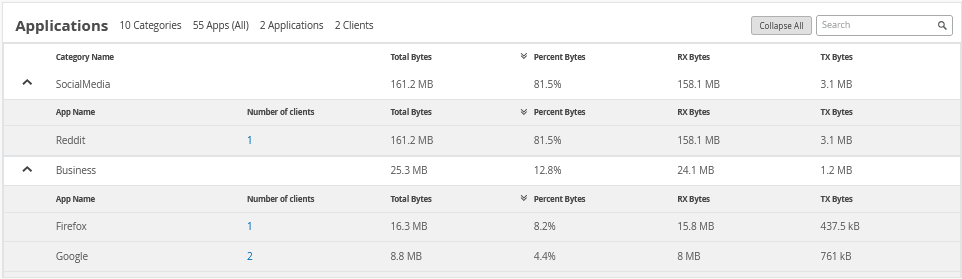
If your device is properly configured and has been sending telemetry data to the Juniper Mist cloud for at least an hour after initial adoption, you should begin to see reports in the Applications pane.
Through the Clients tab, you can see bandwidth usage by client.
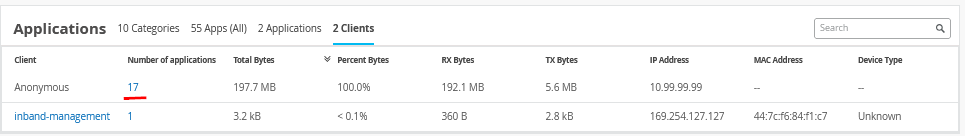
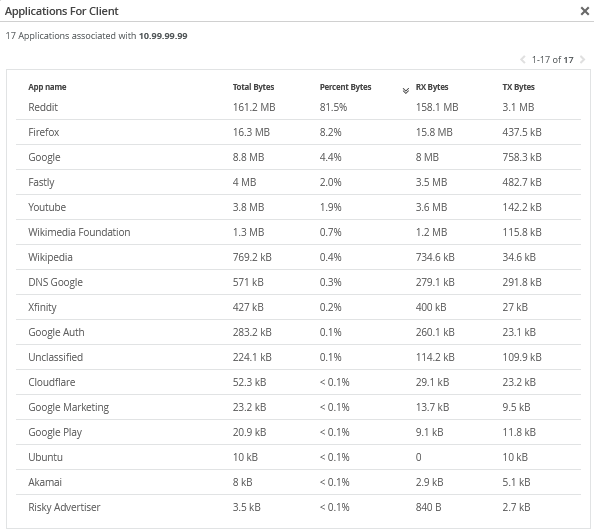
Click on the client to further drill down to see which applications are used.
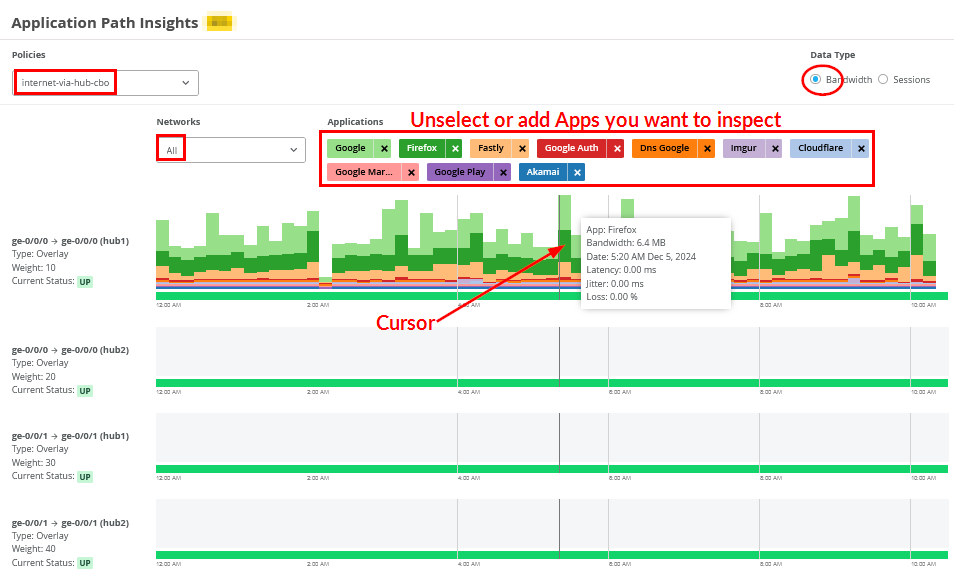
Next, the new Application Policies pane presents bandwidth usage details for each application across the individual paths within your SD-WAN infrastructure:
- Policy enables you to set a filter on the configured application policies.
- Network enables to review all LAN networks or only one.
- Applications enables you to deselect or add applications you are interested.
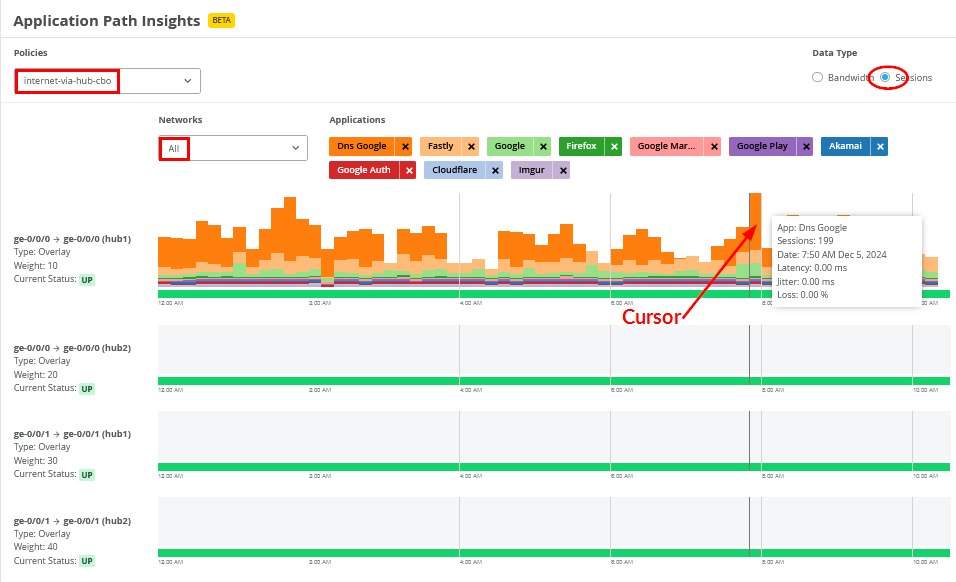
- Data Type enables you to review the application bandwidth, or the amount of session opened.
- Bubble enables you to view more details. You must move the cursor over the application in a path to get a bubble.
Below is the same view again. But we’ve chosen to view the session counts:
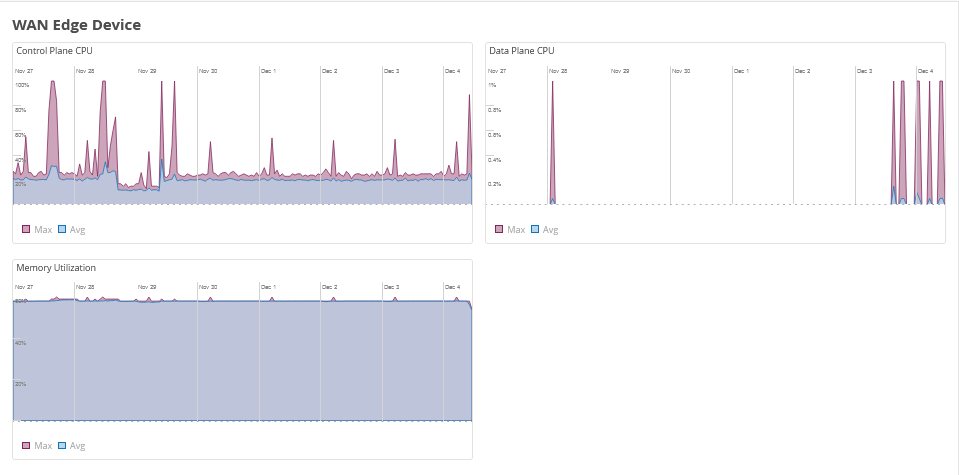
Next is the WAN Edge Device pane with the following charts:
- Control Plane CPU
- Data Plane CPU
- Memory Utilization
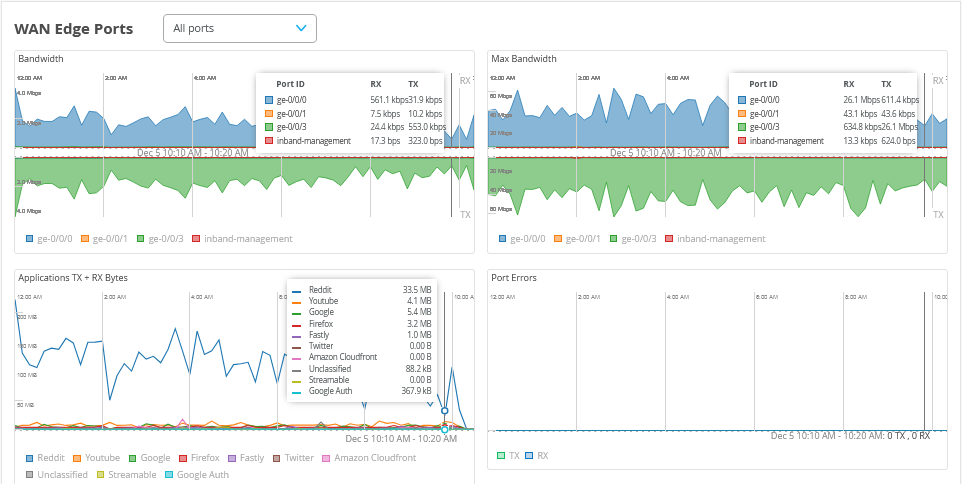
Next is the WAN Edge Ports pane with the following charts:
- Bandwidth
- Max Bandwidth
- Applications
- Port Errors
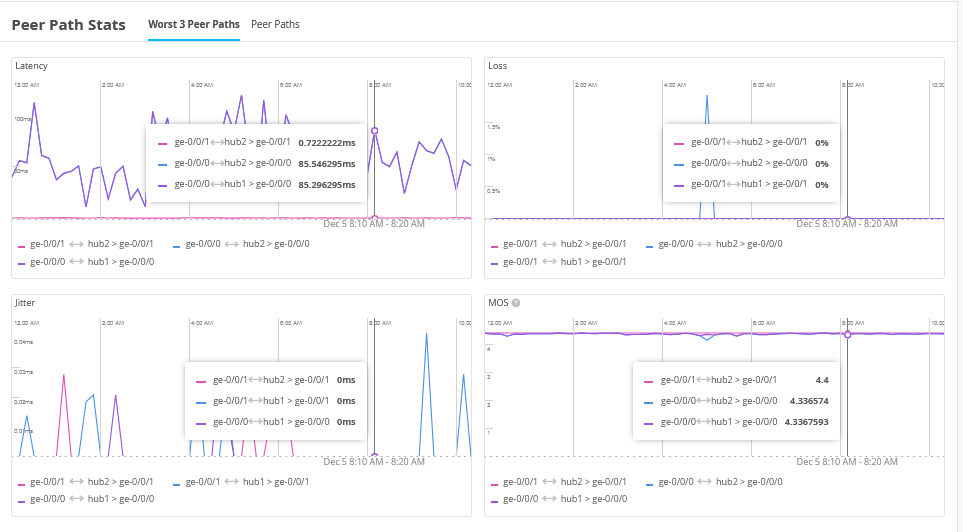
Next is the Peer Path Stats pane with the following charts:
- Latency
- Loss
- Jitter
- MOS (Mean Opinion Score)
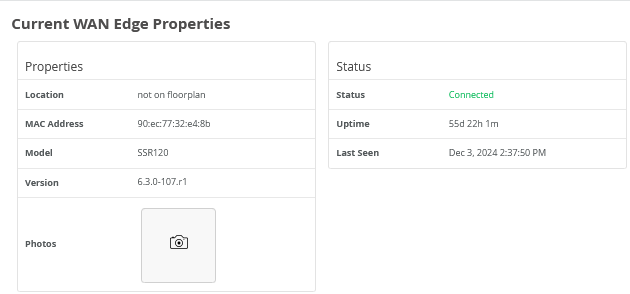
Then, the last pane on this page is Current WAN Edge Properties.
WAN SLE Monitor Page
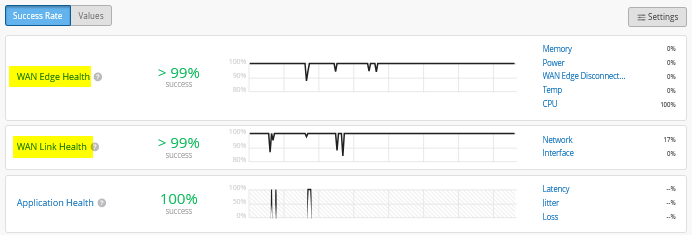
The next level of information is regarding WAN SLE monitoring. To review the information, click Monitor > Service Levels. Then, select a site for inspection and select WAN.
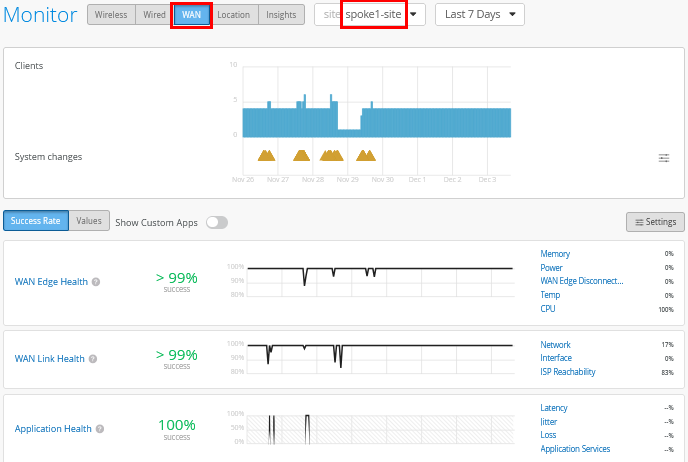
Keep in mind that all WAN SLE metrics are designed for long-term monitoring. They may show limited data immediately after onboarding a device. In a production environment, it's typical to need a week's worth of metrics. You can try adjusting the time range—for example, selecting Last 60 Min—but it may still display minimal information at this early stage.
The first pane shows the relationship between the number of connected clients at a given time and any system events that occurred during that period. An amber triangle indicates when a change has taken place. Additionally, take note of the information displayed in the lower-right corner of the pane, which provides further context on reported activity.
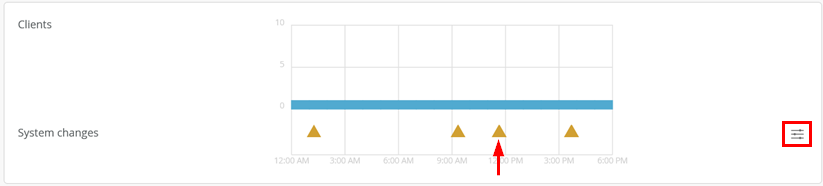
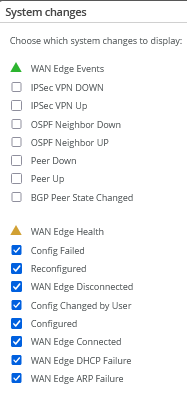
You can select which system changes should be displayed:
Back on the WAN SLE page, make yourself familiar with the Settings in the upper-right corner.
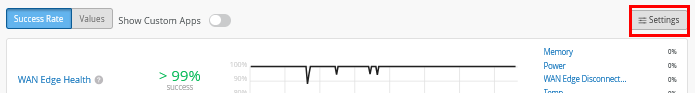
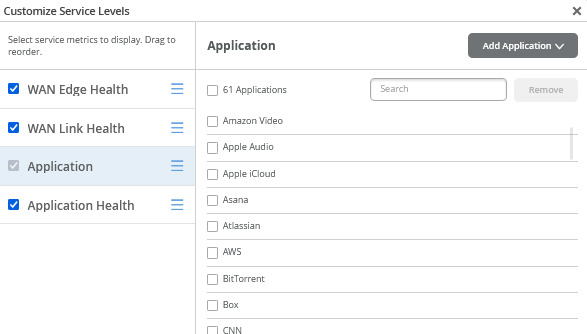
You can customize a few settings, but most are adjusted automatically. In contrast to SRX Series Firewalls, the Session Smart Routers do not require application customization and probe configuration. All applications are automatically monitored when they are detected but you can add or remove them in the dialogue window indicated below:
It's important to understand that the metrics and reports for WAN Edge Health, WAN Link Health, and Application Health are powered by Mist AI, which uses a TensorFlow-based network. This has several implications:
Data-Driven Learning: Like all AI systems, Mist AI requires a significant amount of data to analyze and learn the behavior of your network. For meaningful insights, we recommend waiting at least a week after installing a spoke and generating traffic before reviewing the health metrics.
Proactive Health Insights: Unlike traditional monitoring tools that simply display raw data and leave interpretation up to the user, Mist AI evaluates network health and highlights only those areas that are at risk. If no issues are displayed, it indicates that your network is performing well and no immediate review is necessary.
Let’s now focus on the reports you can get through WAN Edge Health and WAN Link Health.
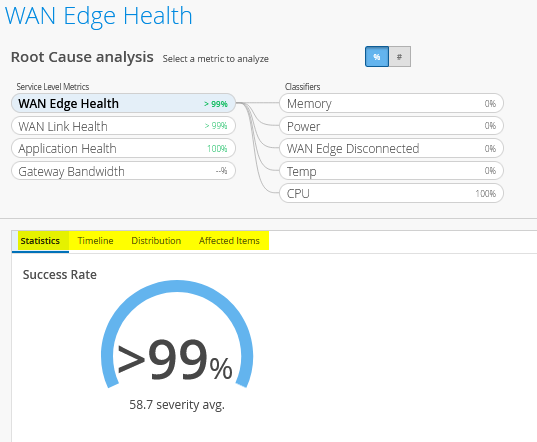
WAN Edge Health reports the health check of the Session Smart Router device deployed with metrics and classifiers such as:
- Memory usage
- Power
- WAN Edge Disconnected
- Temperature
- CPU utilization
Below is an example chart. Use the tabs to explore more detailed, granular information:
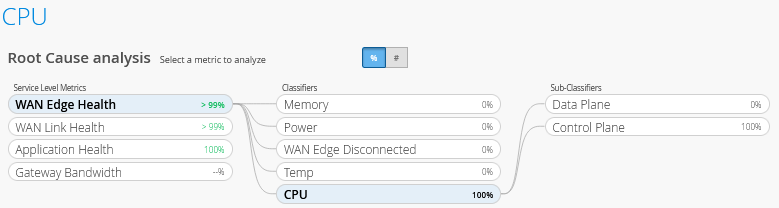
Temperature and CPU utilization have sub-classifiers as shown in the example below:
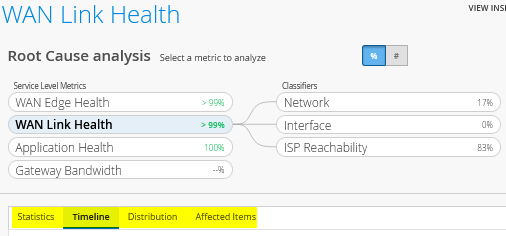
WAN Link Health reports the health status of the Session Smart Router deployed with metrics and classifiers such as:
- Network
- Jitter
- Latency
- Loss
- Peer Path Down
- Interface
- LTE Signal
- Congestion
- Cable Issues
- ISP Reachability
- ARP
- DHCP
.
.
Reports on SLEs are only made visible if there is a concern you need to review. If you want charts on raw data without the benefit of an AI based analysis, see the Device page for WAN Edge Insights Page.
Alerts Page
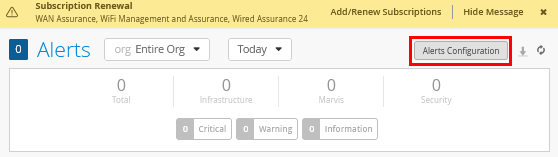
This test case demonstrates how to view gateway alarms and receive them as email notifications for the administrator. To set this up, navigate to Monitor -> Alerts, review the current alerts page, and then click on Alerts Configuration.
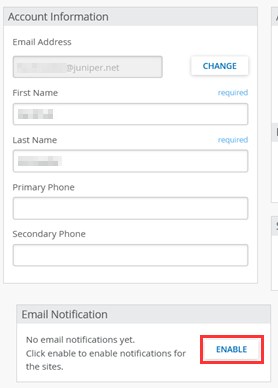
Under Configuration, enable the reporting default for Scope=Entire Org, To Organization admins, and To site admins. You can either add your email address to the To additional email recipients field or click My Account in the upper-right corner to verify your settings.
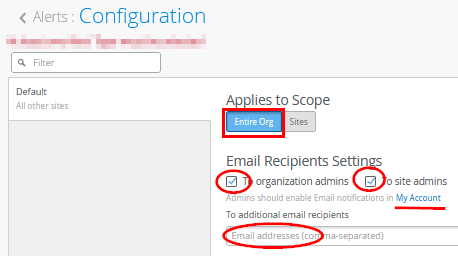
By default, administrators do not receive email notifications. To start receiving them, make sure to enable email alerts in your settings.
If you have followed the My Account link, click Enable under Email Notification.
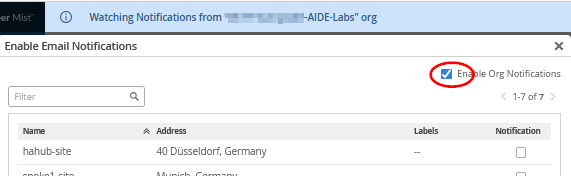
You can enable notifications on a site-by-site basis. But for now, enable the Enable Org Notifications option as shown below:
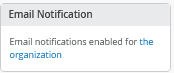
Your account email notification settings look similar to the figure below:
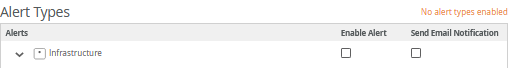
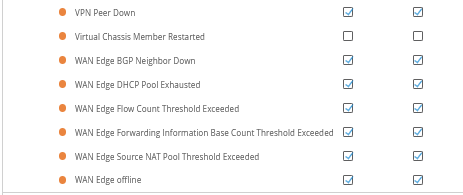
Now, enable the Gateway Alerts and email notifications for Infrastructure as the options shown below:
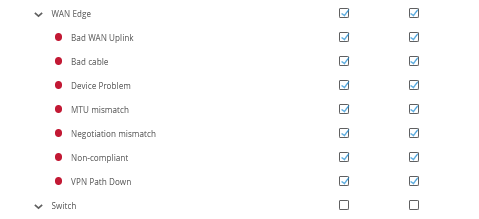
Additionally, we recommend you enable the Marvis WAN Edge alerts and email notifications.

.
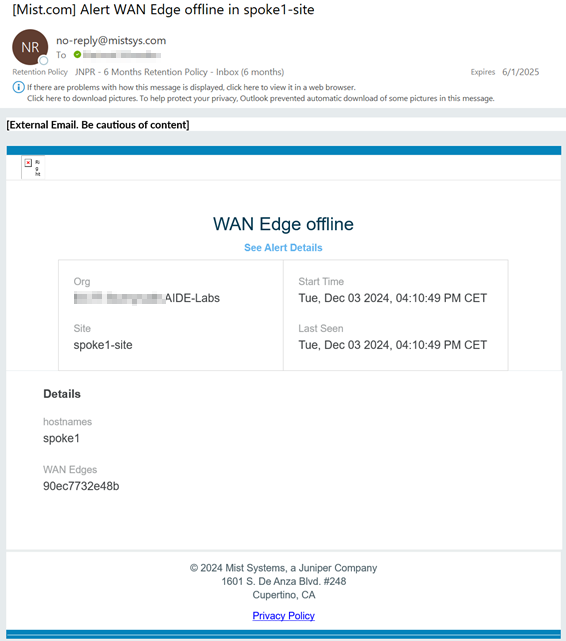
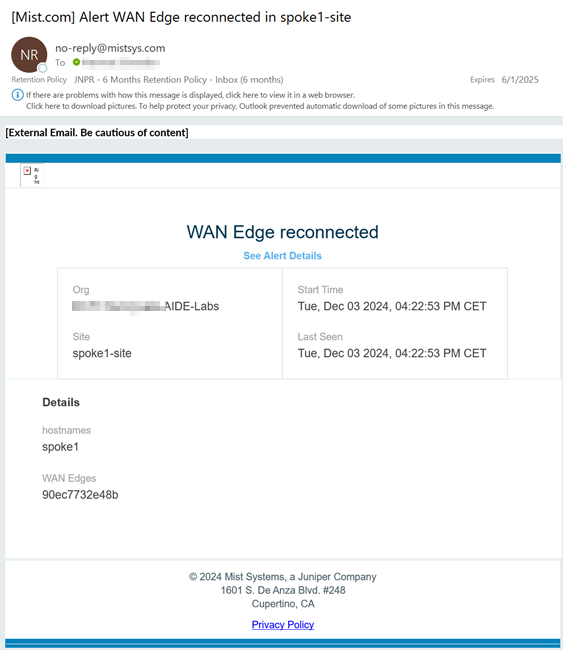
As an example, if a device loses connection to the Juniper Mist cloud, you might receive an email after a couple of minutes. See an example below:
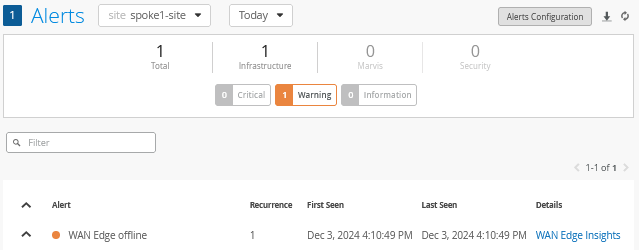
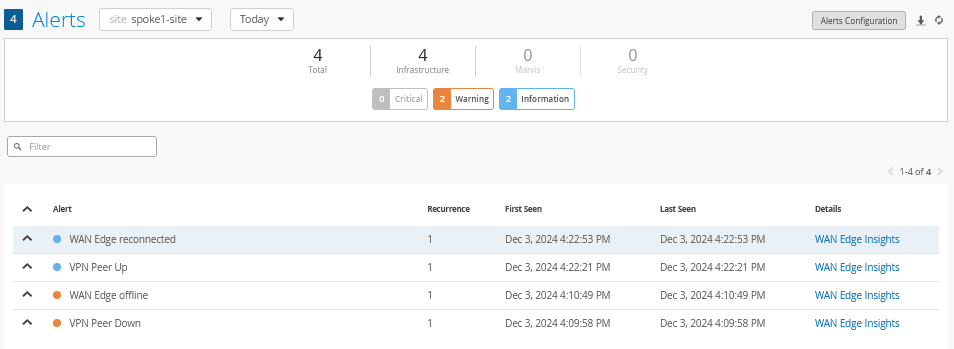
When you click See Alert Details, the link redirects you to the Alerts page. You can also navigate directly to the Alerts page to view the event reported as shown below:
Let’s assume that the connection to the Juniper Mist cloud is restored and you get another email with a status change. When such an email arrives, the alert details are similar to those shown below:
Again, on the Alerts page you should see the second event reported.
Marvis Actions
Marvis Actions are reachable through Marvis > Marvis Actions.
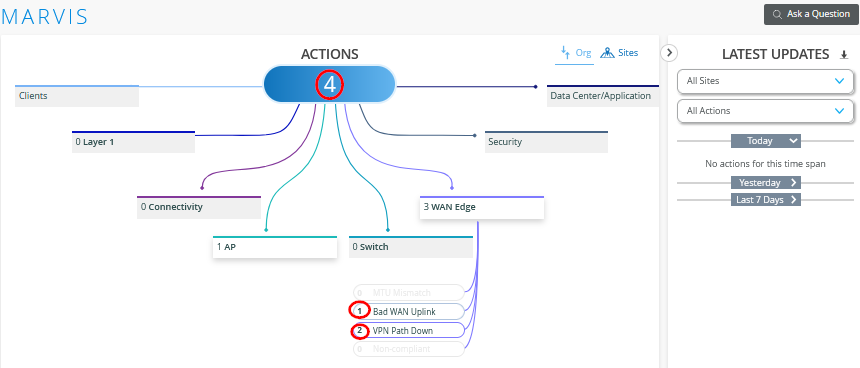
The Marvis Actions related to WAN Edge include:
- MTU Mismatch
- Bad WAN Uplink
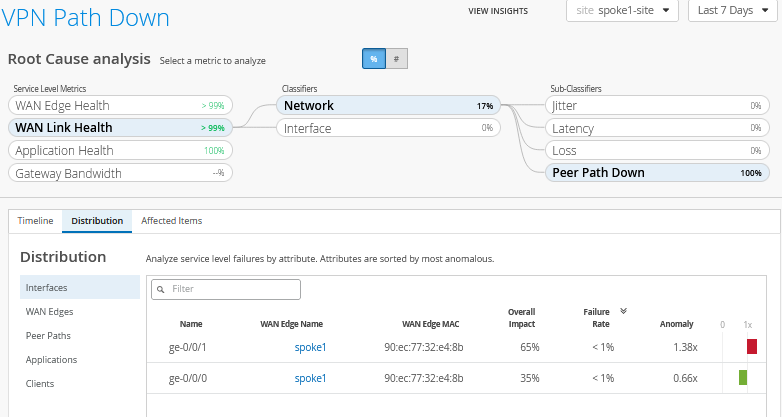
- VPN Path Down
- Non compliant
In our example, with a simulated WAN outage, we can inspect the VPN Path Down to get more information.
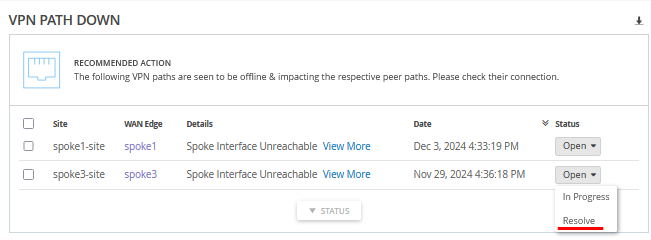
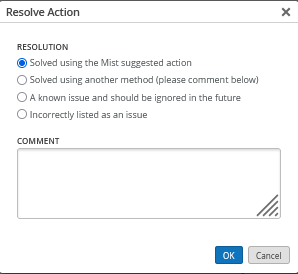
When you select Resolve under an alarm's status, you have the option to add details about the resolution for better context and documentation.
Application SLE
We recommend running traffic for at least a week for the Mist AI system to have enough data for analysis.
The Application SLE is used to monitor the reachability of applications based on traffic generated by a Session Smart Router. This allows for the automatic collection of monitoring data, which is then sent to the Juniper Mist cloud for analysis and visibility. Unlike SRX Firewalls, which require manual configuration of monitoring probes, Session Smart Routers collect this data automatically.
In lab environments, it may be useful to generate simulated user traffic using scripts. However, in a production setting, it’s best to allow actual traffic to flow so you can observe real application usage. This insight helps you fine-tune the required probes based on actual demand.
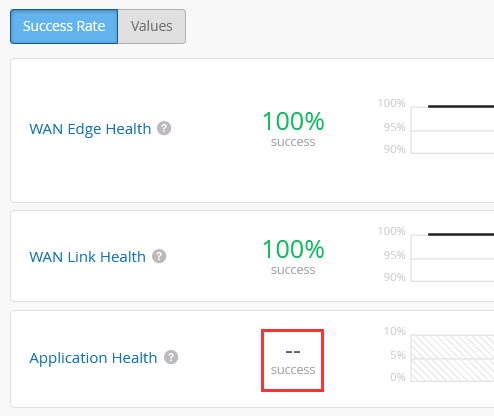
When monitoring WAN SLEs, ensure that metrics are being populated. In the example screen below, no values are shown yet—likely because sufficient application traffic has not been present. Remember, the system requires sustained traffic over time to collect enough data for meaningful analysis.
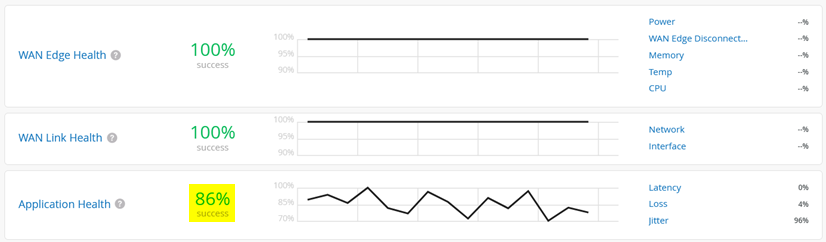
Now, we can check the Application Health SLE. A displayed percentage value means that enough data was collected for analysis.
 .
.
In our case, we see 86%. Let’s inspect these reports to see who or what is impacted.
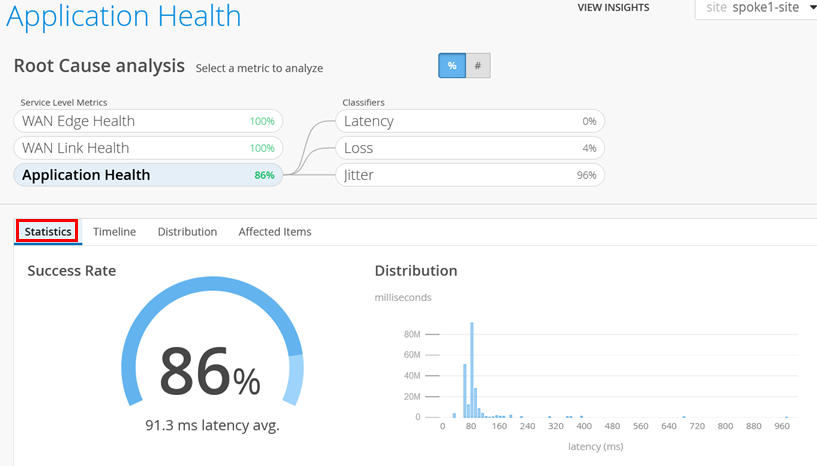
Within the Application Health SLE, review the Statistics tab to see the distribution of latency values as shown below:
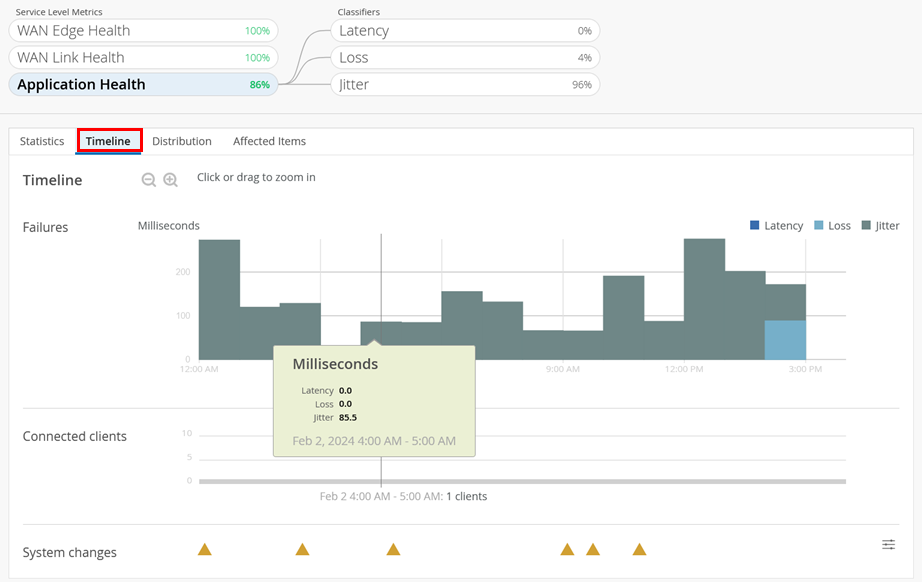
Then, check the Timeline tab to see what the impact is and when:
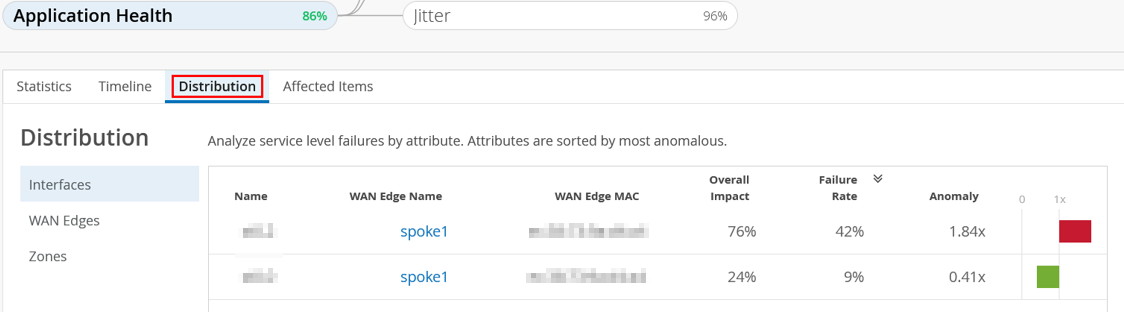
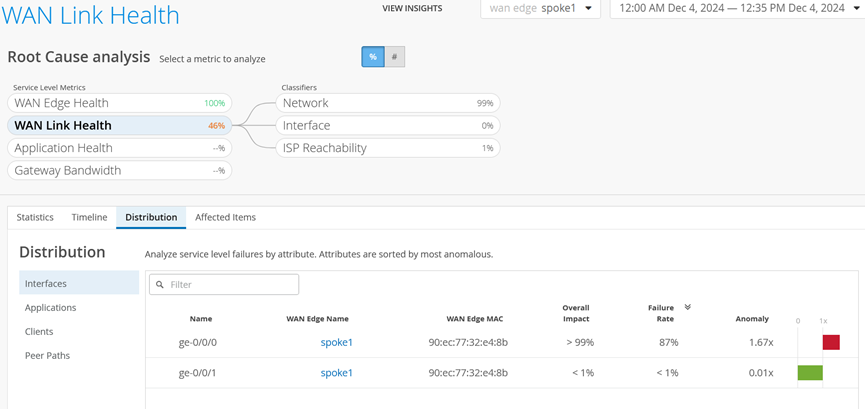
Next, check the Distribution tab. Selecting Interfaces provides data on the anomaly:
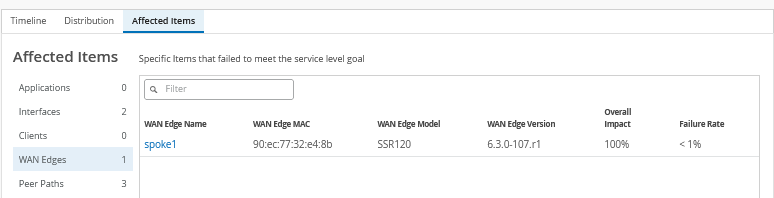
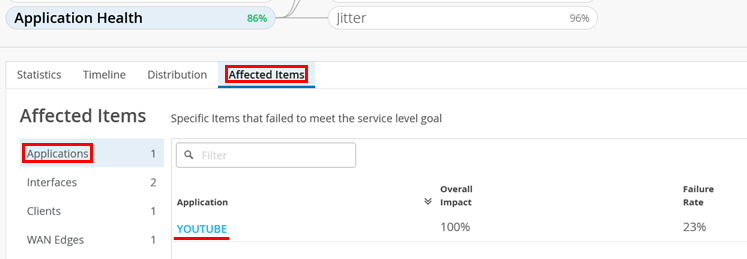
Finally, check Affected Items and then Applications. In this example, we see issues with YouTube:
Finally, we check the affected users:
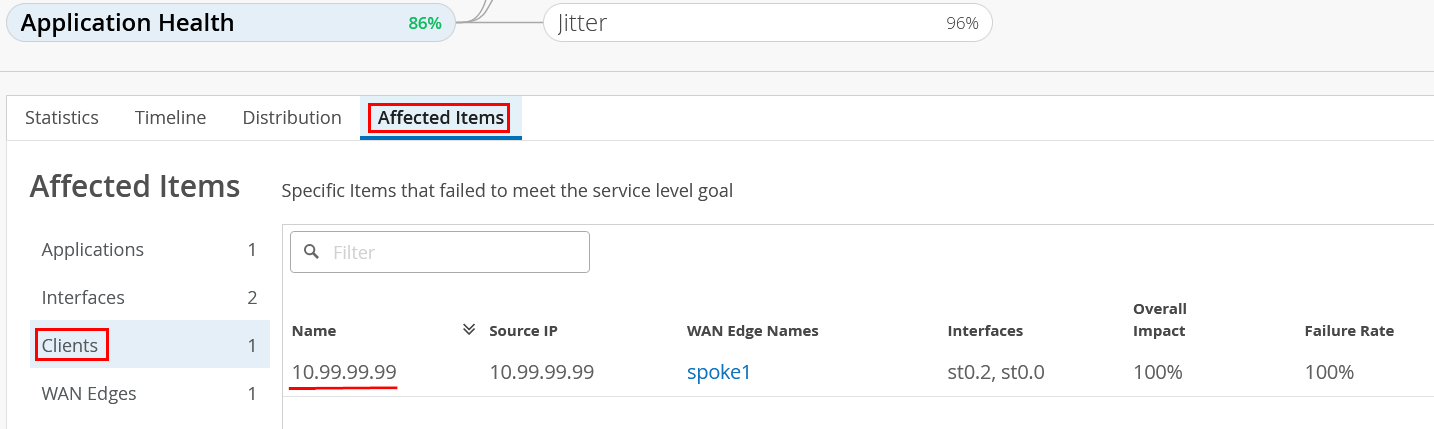
You can also inspect Interfaces and WAN Edges.
Marvis Conversational Assistant
We recommend running traffic for at least a week for the AI system to have enough data for analysis.
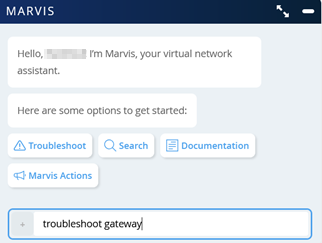
The Marvis Conversational Assistant is in the lower-right corner of your browser window.

The window that appears has some predefined terms to choose. Enter “troubleshoot gateway” to limit the search to the WAN router:
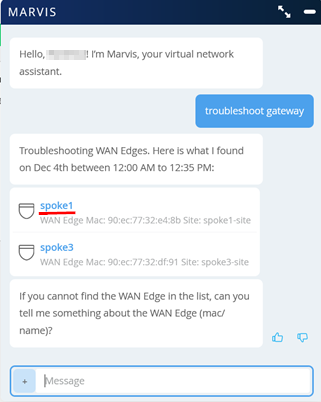
In our case (which may be different in your environment), we get a report about the spokes where we simulated a WAN outage before. Here, we select one of the displayed spokes to get further information:
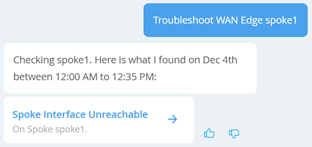
When narrowing down on Spoke1, we see that interfaces became unavailable:
Narrowing down further allows us to select Failure Timeline and WAN Edge Insights:
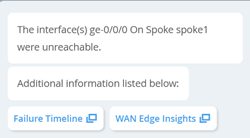
When you select Failure Timeline, the WAN Link Health page opens offering more information:
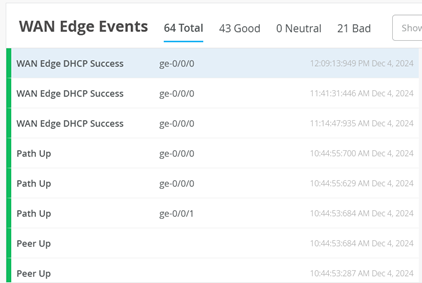
When you select WAN Edge Insights, the Insights page opens and in this case, the Events show when these interfaces came back up and the SVR tunnels towards the hubs were established.
Speed Tests for Session Smart Router
Service Providers (SPs) as well as their end customers install and deploy telecommunication circuits (or paths) to offices, branches, and so on. As Session Smart Routers are deployed at the edge of the customer premises, SPs and customers need to generate traffic to test the speed and performance of these circuits to ensure the quality is being maintained.
From the Juniper Mist portal, you can run a speed test for a Session Smart Router deployed as a WAN Edge on your network. Speed tests come in handy, for example, when:
- You need to test the speed and performance of the circuit being delivered to the customer.
- You need to perform new link qualification to verify that speeds are what the service provider and customer have agreed upon.
- You need to perform on-demand speed tests when you suspect a low link speed is causing link issues.
- You need to run scheduled speed tests to re-test link speeds and ensure performance continues to meet expectations on an ongoing basis.
The WAN Edge speed test tool can reliably validate circuit speeds of 1 megabit per second (Mbps) to 1 gigabit per second (Gbps). Circuits exceeding 1Gbps must rely on other tools for validation. The WAN Edge speed test tool does not measure or validate jitter or loss.
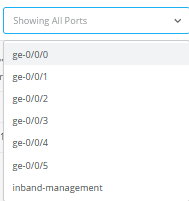
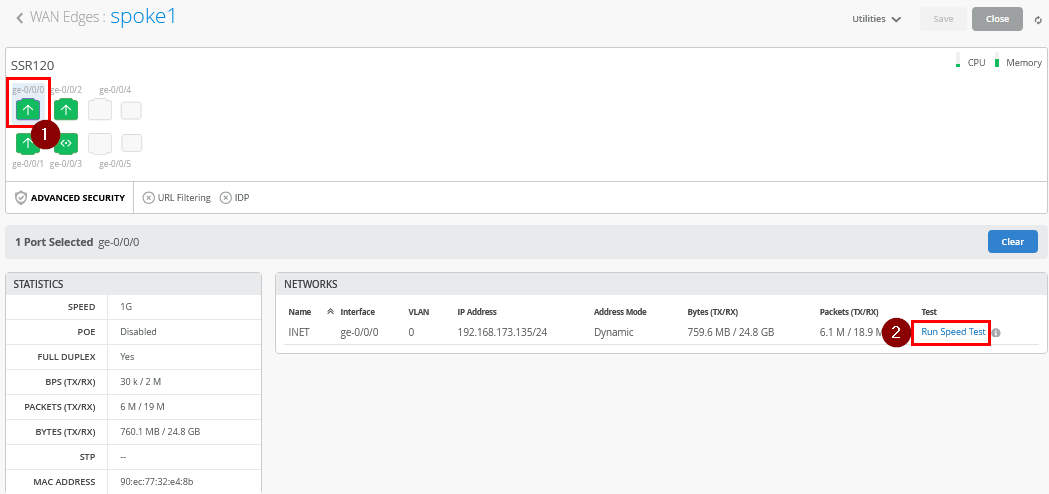
In the example below, we select port ge-0/0/0 as
one of the WAN ports to be tested. We then initiate the test
command using the Run Speed Test link as shown in
the figure below:
The example results are shared in the figure below:
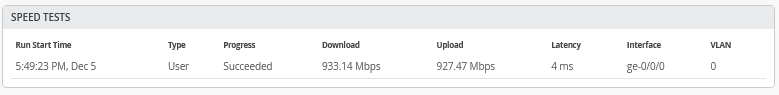
The traffic destinations for this speed test are publicly hosted services that also provide feedback to end users when initiating a test through their browser. This is not a test towards a hub but it’s a good test for Internet connectivity overall.
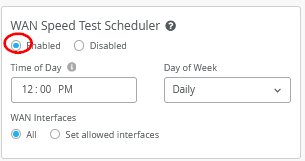
If you want, you can also initiate regular testing schedules. Go to Organization -> Settings where you can enable the new WAN Speed Test Scheduler and configure the rest.
Debugging Using Packet Captures to Collect Remote Traffic Data
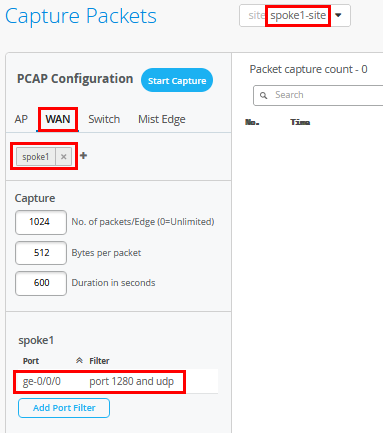
Go to Site -> WAN Edge Packet Capture and a new pane will open. In our example, we configure the following for packet capture:
- Site=
spoke1-site - WAN=
spoke1 - Capture
- No. of packets/Edge=
1024(the default). Do not set this parameter to 0. - Bytes per packet=
512 - Duration in seconds=
600
- No. of packets/Edge=
- spoke1
- Port1=
ge-0/0/0. Our first WAN Interface. - Filter1=
port 10280 and udp. We want to capture SVR traffic between spoke and hubs.
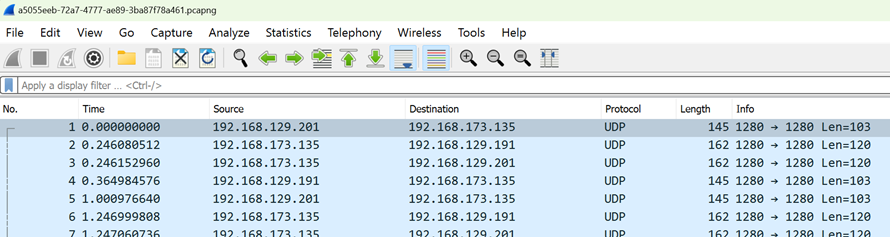
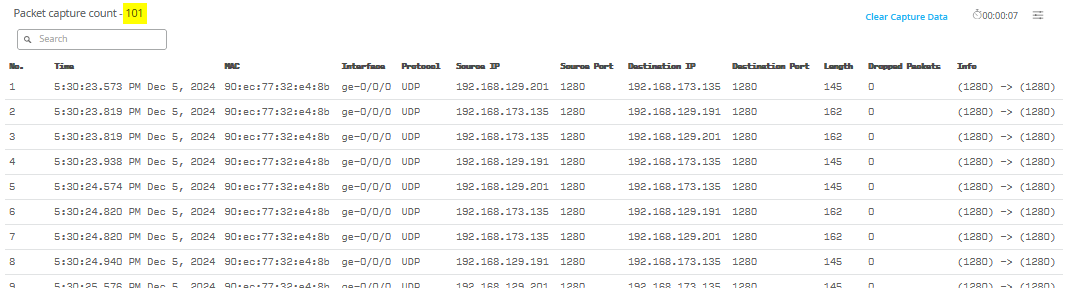
Then, click on Start Capture. If your filter captures traffic, it’s immediately displayed in the packet capture window as shown in the figure below:
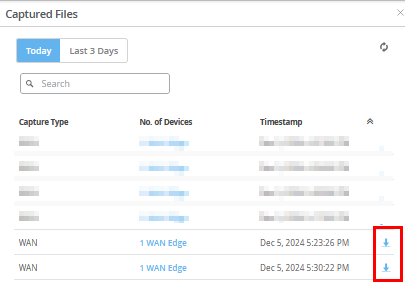
After you have stopped the packet capture, the PCAP file is uploaded (taking ~3 minutes) and you can download the received files.
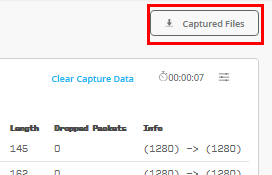
Now, download the PCAP files.
When you open them in Wireshark you can further analyze the traffic.