Solution Architecture
JVD Lab Topology
Platform Positioning
This JVD is evaluated and validated on the following platforms.
The Devices Under Test (DUT) are used with helper devices. However, the helper devices functionality is not evaluated. Their role is to facilitate test execution.
- Switch SW:
- SW1 – EX4200-48T (Helper)
- SW2 – QFX5100-48S (Helper)
- Access Node AN – ACX7024/ACX7100-48L (DUT)
- Aggregation Node AGN – ACX7100-32C (DUT)
- Core Router CR – PTX10004 (Helper)
- BBE/BNG:
- BNG1 – MX304 (DUT)
- BNG2 – MX204 (DUT)
- BNG3 – MX10004 with LC480 and LC9600 (DUT)
- BNG4 – MX480 with MPC3 and MPC5E and MPC7E and MPC10 (DUT)
- RT – IXIA (Helper) Tester device to simulate subscriber devices and traffic flow
Network Architecture
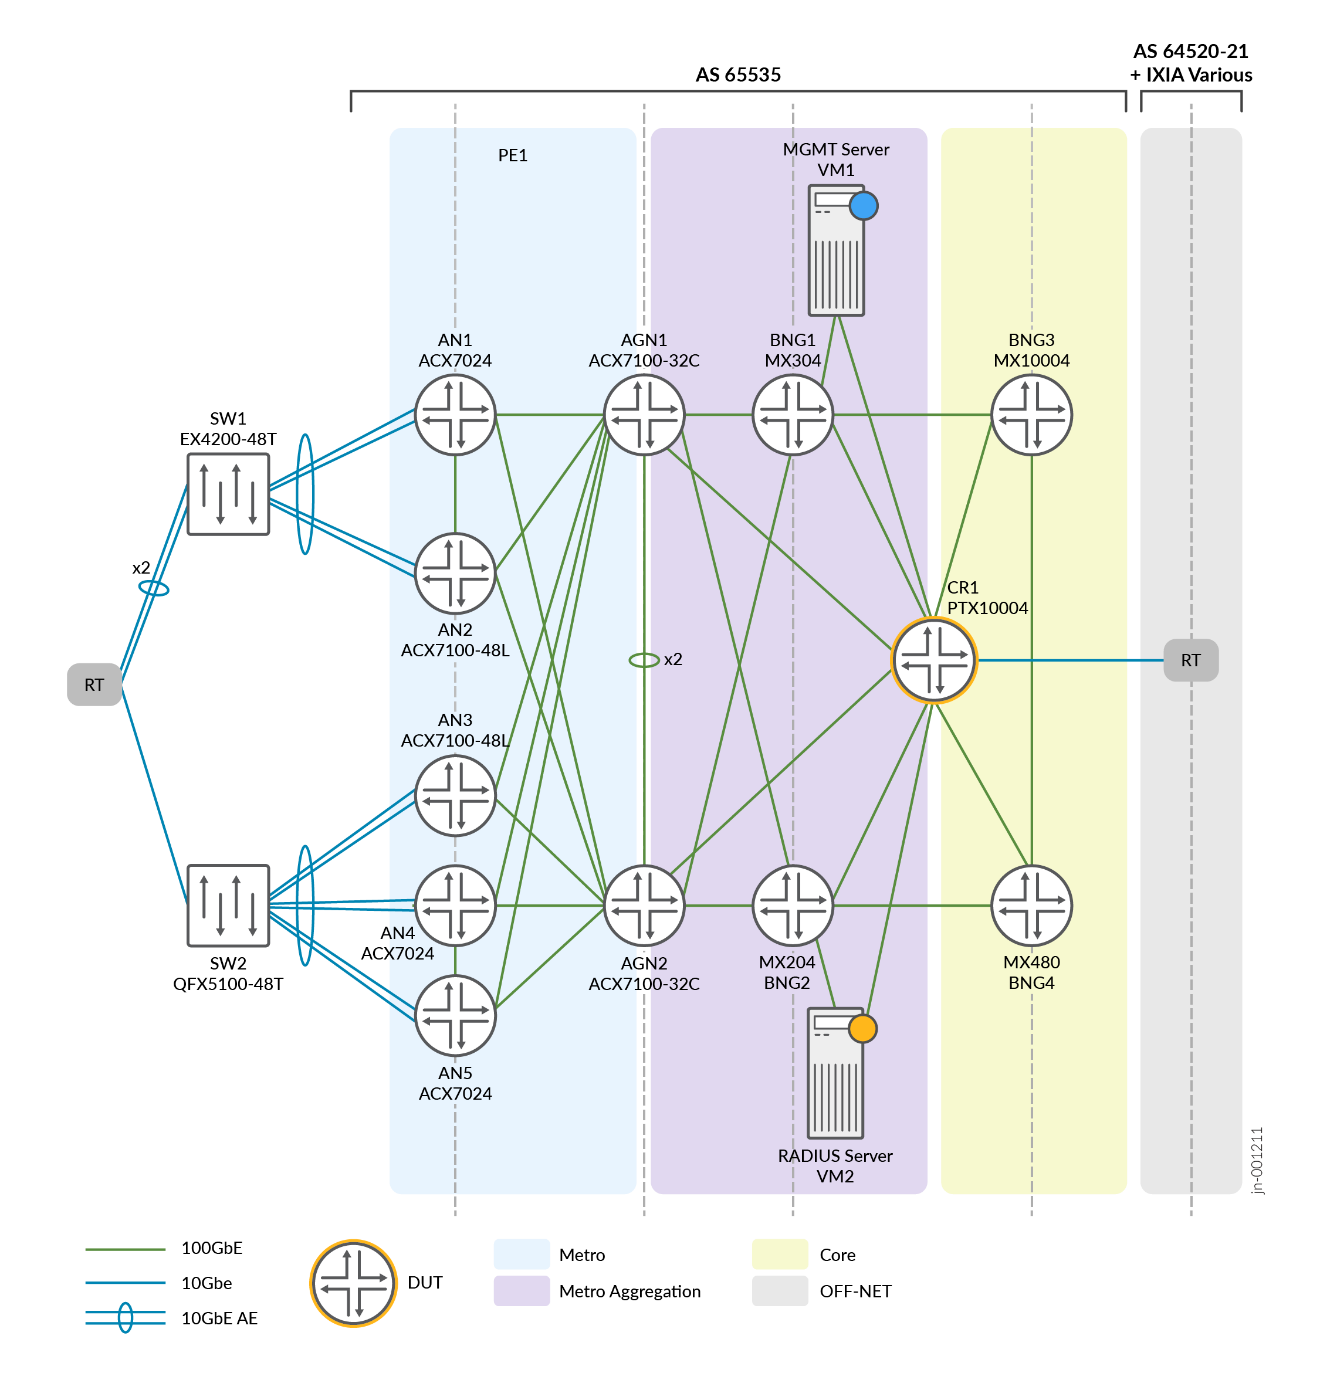
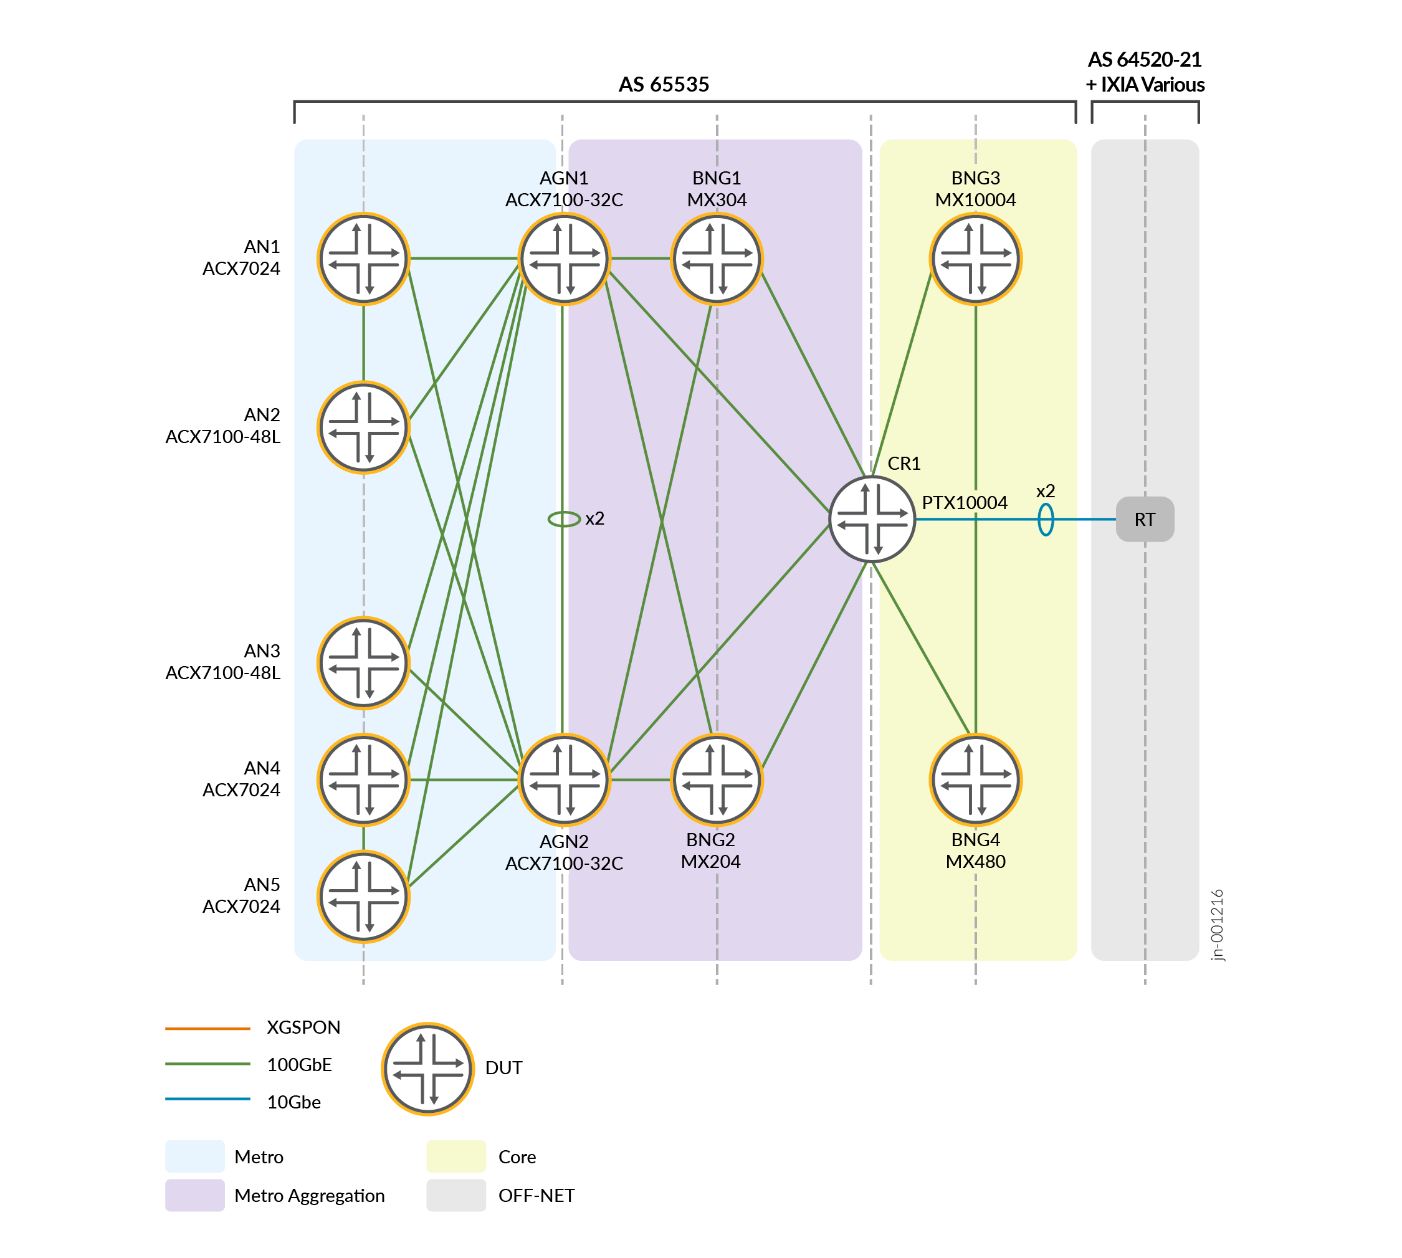
The following figure shows the underlay solution architecture for a tier 1 service provider.
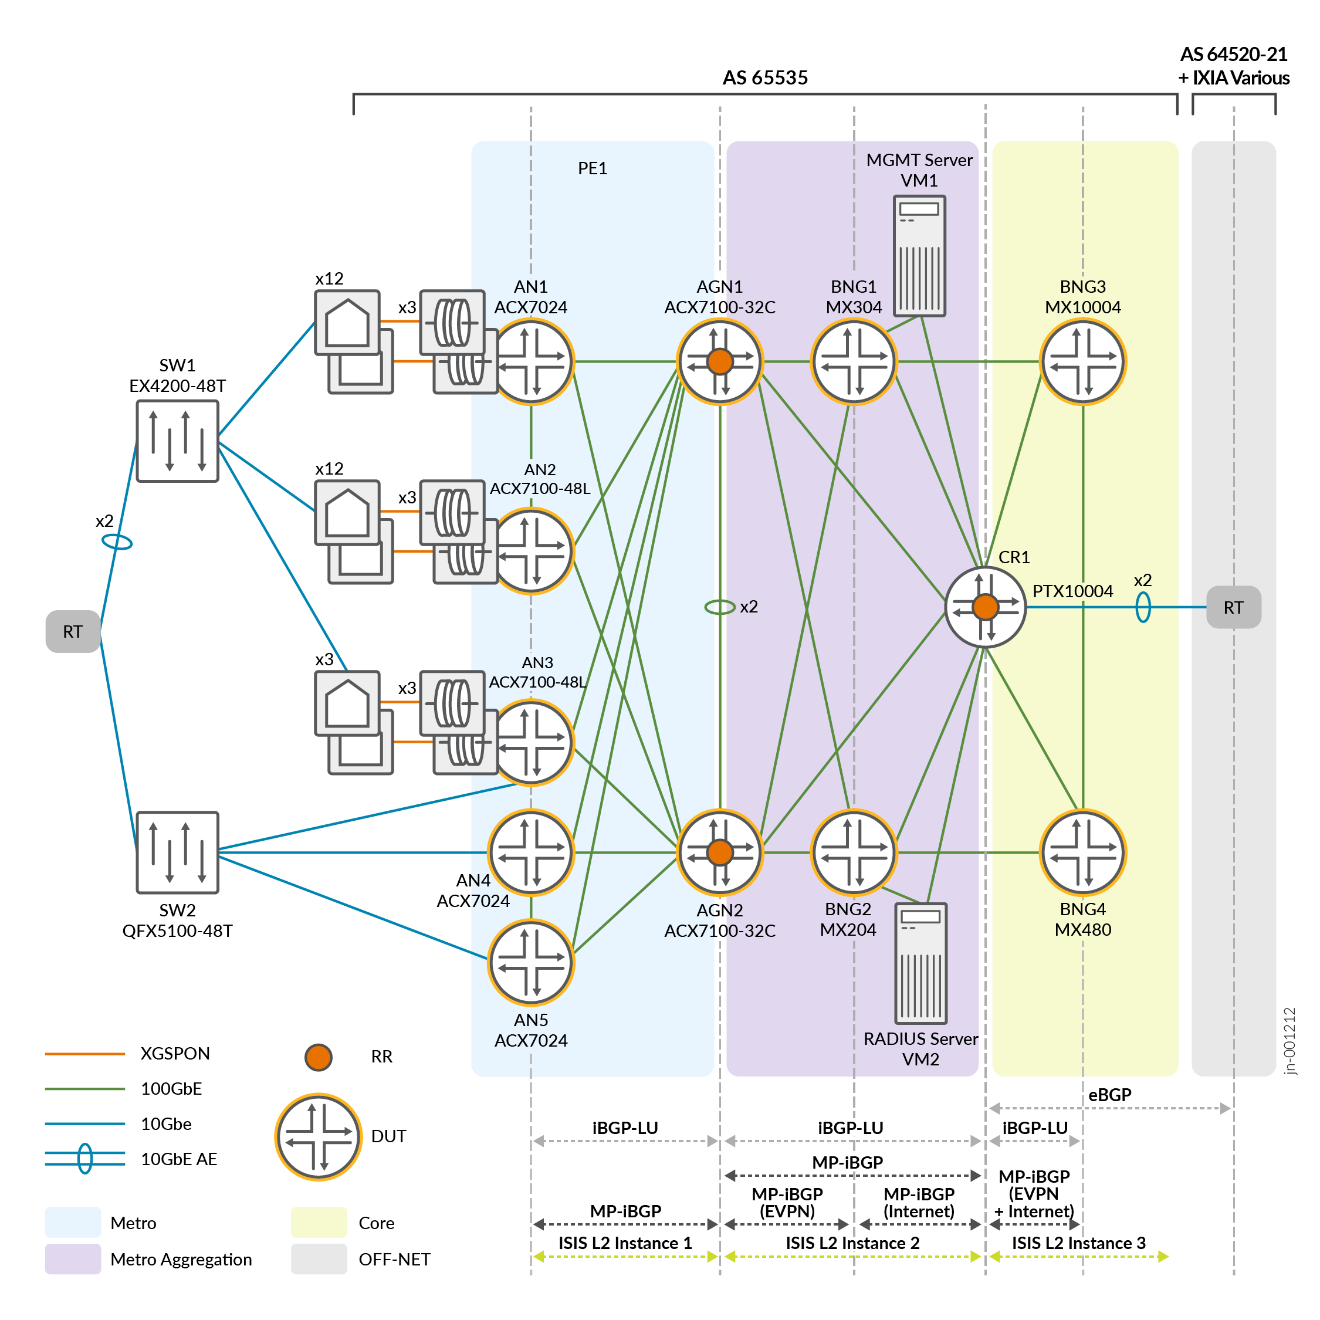
The underlay solution is based on SR MPLS technology with IS-IS as the IGP protocol. The routing domain is divided into Metro, Metro Aggregation, and Core areas. Each area runs a separate IGP Instance. Due to this, the routing information is condensed to only the necessary routes in a particular domain. BGP-LU protocol is used to distribute routing information between metro areas. If needed, a Tier 2/3 SP can condense the Metro and Metro Aggregation IGPs into a single instance:
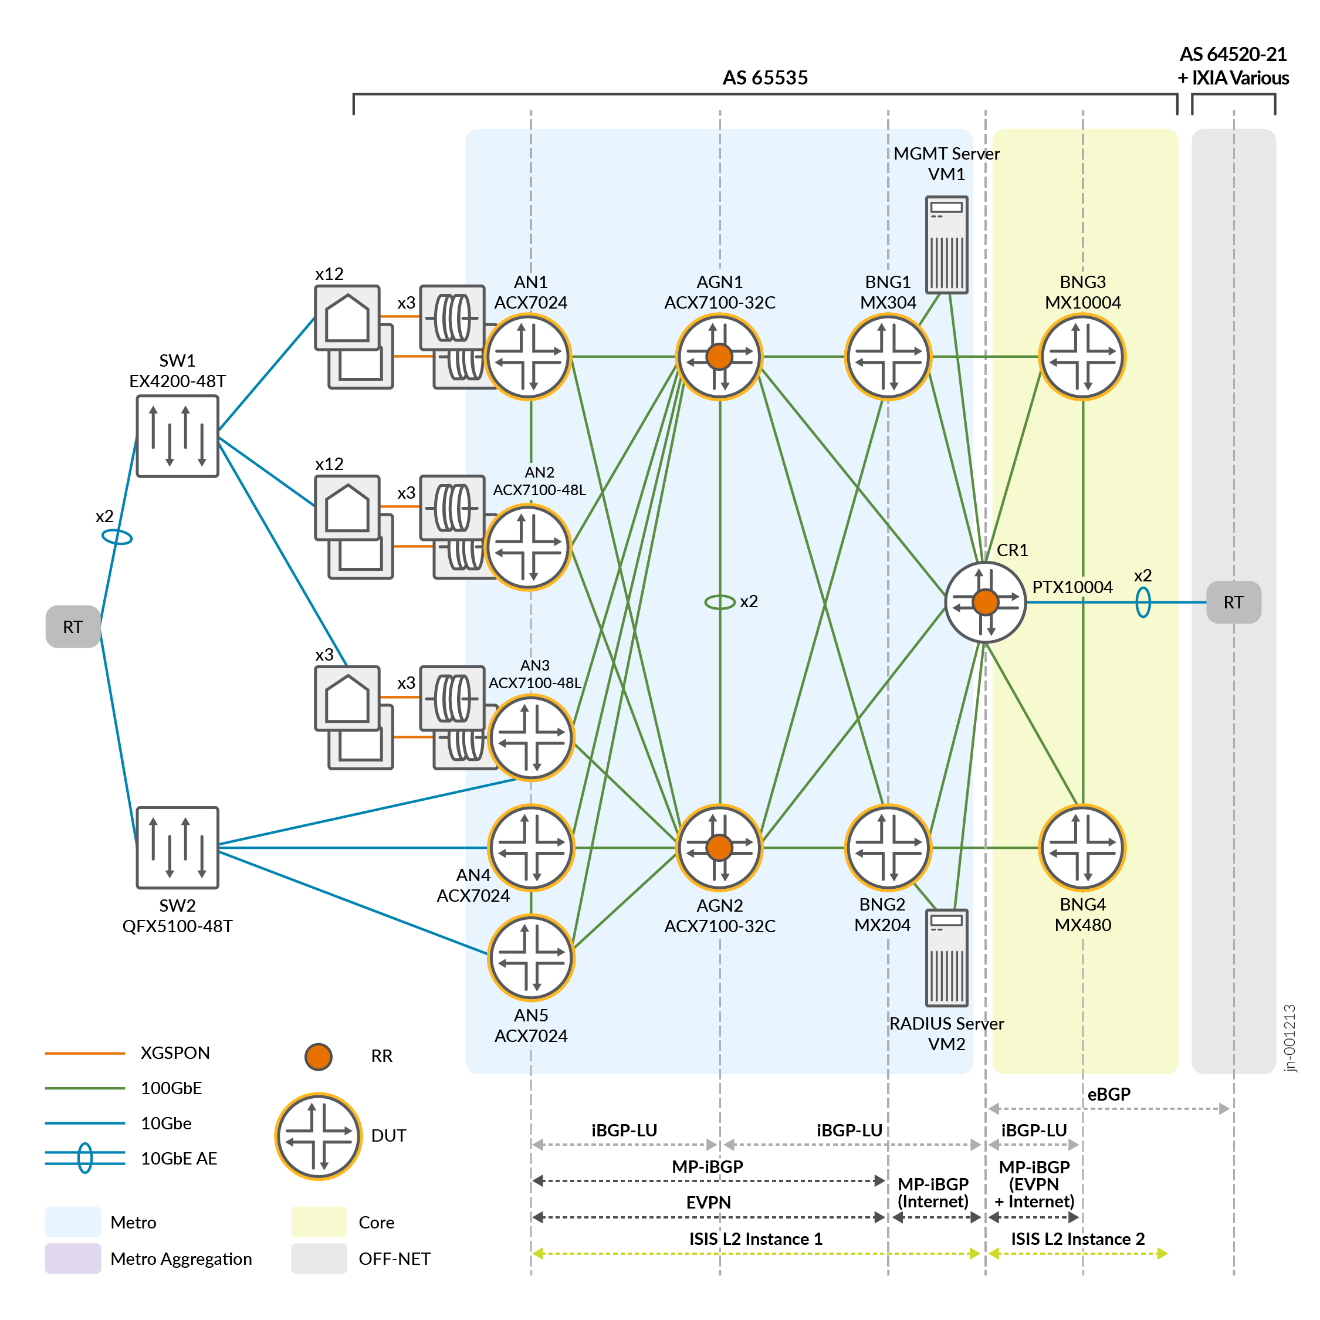
Figure 4 outlines the overlay solution architecture with collapsed Metro and Aggregation areas. This more closely resembles current T2 and T3 provider networks.
The following overlay models are utilized in both SP Tier 1 and SP Tier 2/3 design models.
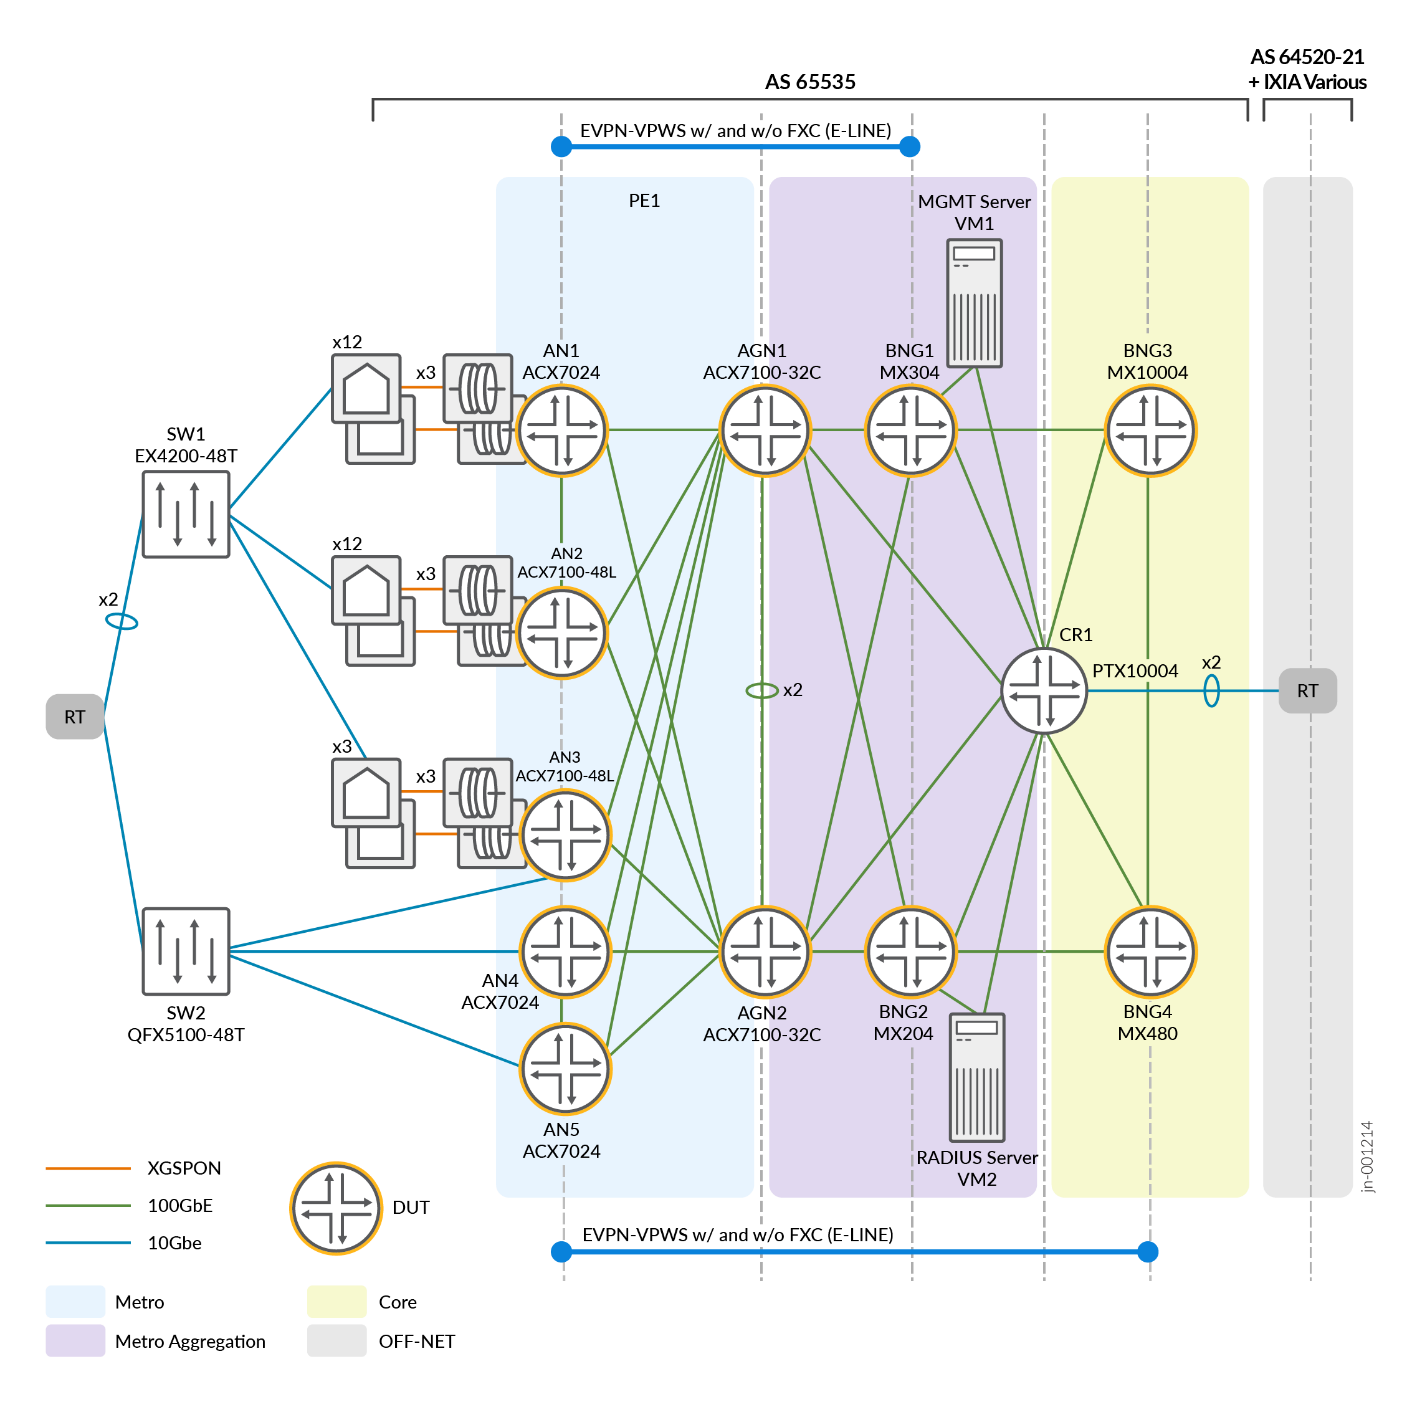
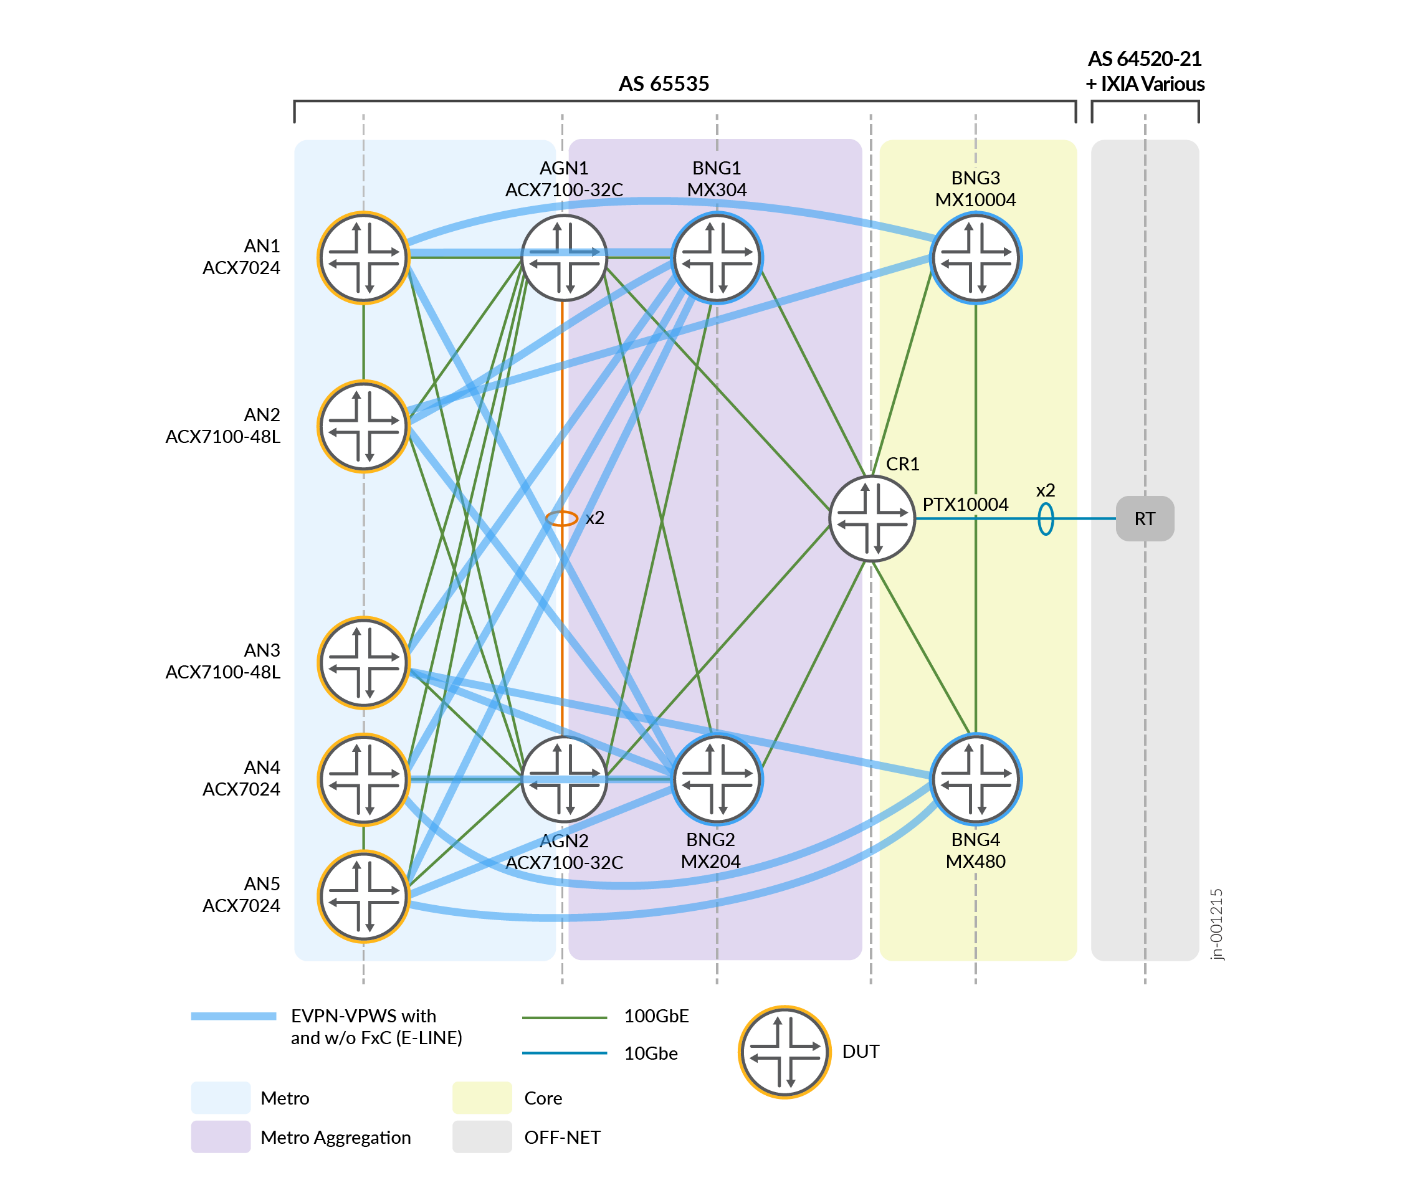
You can build the overlay structure using different L2 service technologies. This JVD proposes to use EVPN-VPWS as an overlay structure for current testing. Other overlay structures are documented for reference in the backup section.
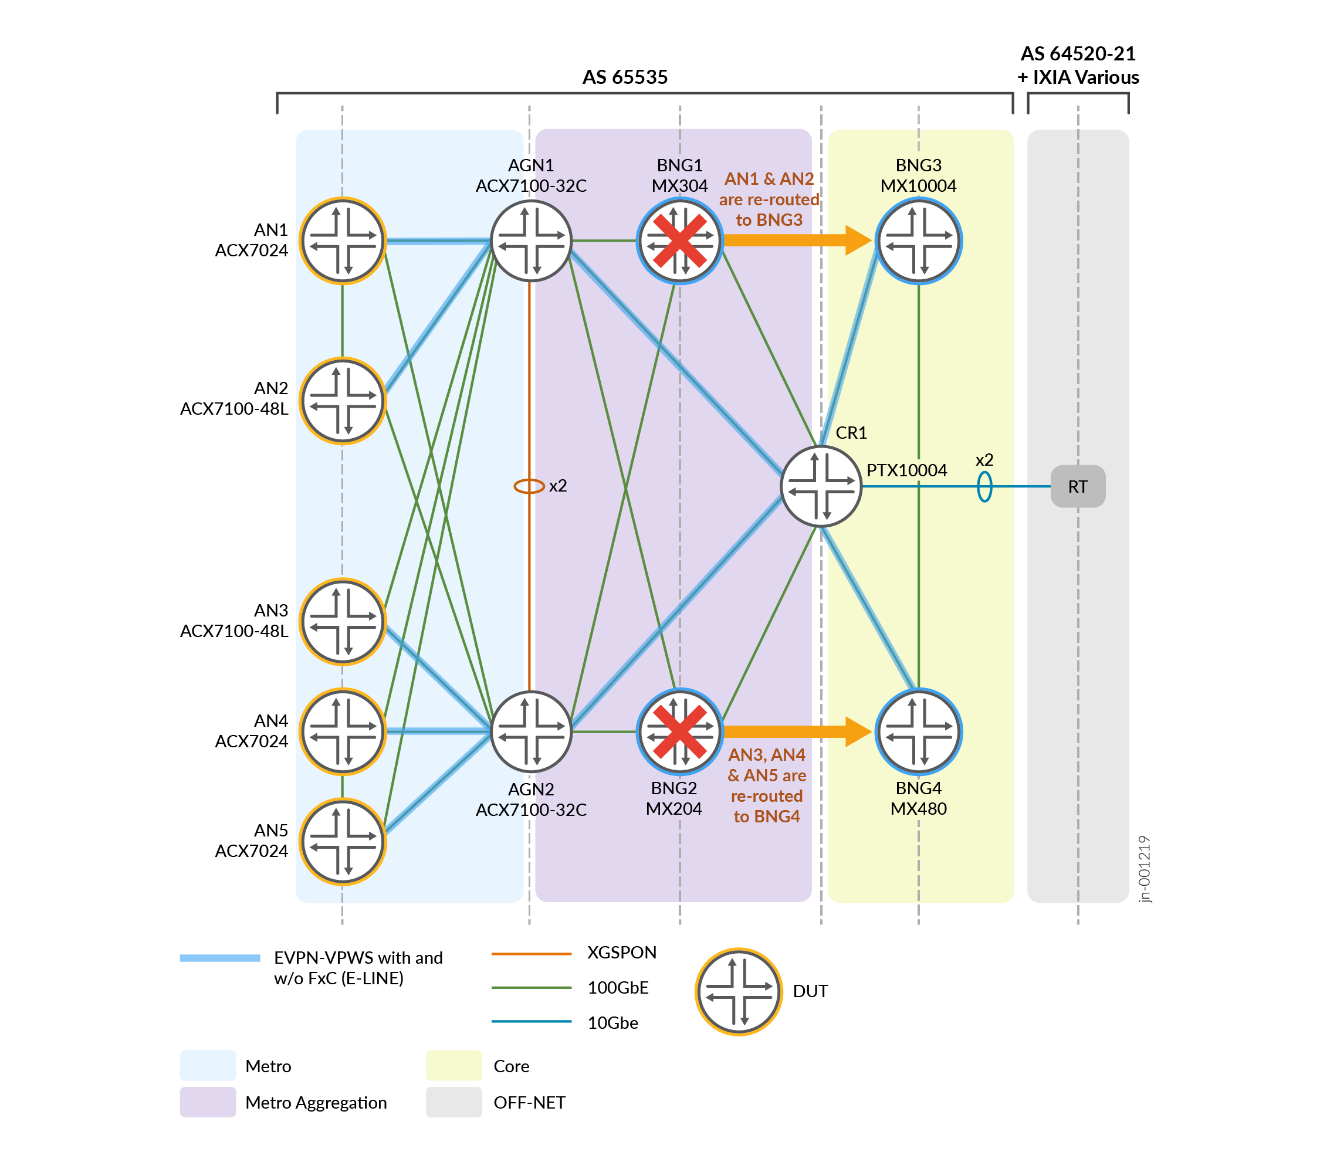
The following figure shows EVPN-VPWS (E-LINE) overlay structure.
BNG Network Architecture
This JVD evaluates the following residential subscribers’ services:
- Residential broadband subscribers with 100Mbps, 200Mbps, and 500Mbps services
- Business broadband subscribers with 100Mbps services
Base
The RADIUS attributes are used to steer the subscribers to the correct VRF and/or default instance.
The BNGs are paired as follows for Stateless RR:
- BNG1 + BNG2 = BNG Group A
- BNG3 + BNG4 = BNG Group B
The ANs are homed to the BNGs as follows:
- AN1 + AN2 = BNG Group A
- AN3 + AN4 + AN5 = BNG Group B
Broadband Subscribers
Each ANx has its own S-VLAN per access-facing port to delineate its presence in the metro, and the subscribers are split based on their C-VLAN as to whether they are residential or business broadband customers.
The BNG groups are loaded with 128k subscribers total and split 50:50 between them (64k subscribers each). The subscribers are mapped as follows:
| ANx | C-VLAN | S-VLAN | Primary BNGx | Secondary BNGx |
|---|---|---|---|---|
| AN1 | 2-3202 | 1011 | BNG1 | BNG2 |
| AN1 | 2-3202 | 1012 | BNG2 | BNG1 |
| AN1 | 2-3202 | 1013 | BNG1 | BNG2 |
| AN1 | 2-3202 | 1014 | BNG2 | BNG1 |
| AN1 | 2-3202 | 2011 | BNG1 | BNG2 |
| AN1 | 2-3202 | 2012 | BNG2 | BNG1 |
| AN1 | 2-3202 | 2013 | BNG1 | BNG2 |
| AN1 | 2-3202 | 2014 | BNG2 | BNG1 |
| ANx | C-VLAN | S-VLAN | Primary BNGx | Secondary BNGx |
|---|---|---|---|---|
| AN2 | 2-3202 | 1021 | BNG1 | BNG2 |
| AN2 | 2-3202 | 1022 | BNG2 | BNG1 |
| AN2 | 2-3202 | 1023 | BNG1 | BNG2 |
| AN2 | 2-3202 | 1024 | BNG2 | BNG1 |
| AN2 | 2-3202 | 2021 | BNG1 | BNG2 |
| AN2 | 2-3202 | 2022 | BNG2 | BNG1 |
| AN2 | 2-3202 | 2023 | BNG1 | BNG2 |
| AN2 | 2-3202 | 2024 | BNG2 | BNG1 |
| ANx | C-VLAN | S-VLAN | Primary BNGx | Secondary BNGx |
|---|---|---|---|---|
| AN3 | 2-3202 | 1031 | BNG1 | BNG2 |
| AN3 | 2-3202 | 1032 | BNG2 | BNG1 |
| AN3 | 2-3202 | 1033 | BNG1 | BNG2 |
| AN3 | 2-3202 | 1034 | BNG2 | BNG1 |
| AN3 | 2-3202 | 2031 | BNG1 | BNG2 |
| AN3 | 2-3202 | 2032 | BNG2 | BNG1 |
| AN3 | 2-3202 | 2033 | BNG1 | BNG2 |
| AN3 | 2-3202 | 2034 | BNG2 | BNG1 |
| ANx | C-VLAN | S-VLAN | Primary BNGx | Secondary BNGx |
|---|---|---|---|---|
| AN4 | 2-3202 | 1031 | BNG1 | BNG2 |
| AN4 | 2-3202 | 1032 | BNG2 | BNG1 |
| AN4 | 2-3202 | 1033 | BNG1 | BNG2 |
| AN4 | 2-3202 | 1034 | BNG2 | BNG1 |
| AN4 | 2-3202 | 2031 | BNG1 | BNG2 |
| AN4 | 2-3202 | 2032 | BNG2 | BNG1 |
| AN4 | 2-3202 | 2033 | BNG1 | BNG2 |
| AN4 | 2-3202 | 2034 | BNG2 | BNG1 |
| ANx | C-VLAN | S-VLAN | Primary BNGx | Secondary BNGx |
|---|---|---|---|---|
| AN5 | 2-3202 | 1031 | BNG1 | BNG2 |
| AN5 | 2-3202 | 1032 | BNG2 | BNG1 |
| AN5 | 2-3202 | 1033 | BNG1 | BNG2 |
| AN5 | 2-3202 | 1034 | BNG2 | BNG1 |
| AN5 | 2-3202 | 2031 | BNG1 | BNG2 |
| AN5 | 2-3202 | 2032 | BNG2 | BNG1 |
| AN5 | 2-3202 | 2033 | BNG1 | BNG2 |
| AN5 | 2-3202 | 2034 | BNG2 | BNG1 |
To terminate the broadband subscribers, the BNGs add pseudowires using PHWT in the BBE/BNG. BNG1 is a primary BNG for specific C-VLAN and S-VLAN ranges with BNG2 being backed up. These mappings are presented in Table 2 through Table 6 . For different S-VLAN ranges, BNG1 is backed up for customers connected to BNG2. In the case of both BNGs, BNG3 and BNG4 serve as backup BNG, respectively.
QoS Consideration for BNG Subscribers
A subscriber hierarchical QoS profile is attached to every subscriber interface that terminates on the BNG. The BNG QoS TCP (traffic-control-profile) parameters are defined as:
- Policing traffic on subscriber profiles to:
- 100 Mb/s
- 200 Mb/s
- Scheduling and Queuing properties are defined at the logical
interface (Level 4) hierarchy
- A four-queue model is created for each L4 IFL with Best Effort, Expedited Forwarding, Voice, and Assured Forwarding queue definitions.
- Voice queue is assigned strict-high priority with 5% interface bandwidth (transmit-rate) and rate-limited to prevent starving.
- Assured and Expedited Forwarding queues are assigned as high-priority with a 10% transmit-rate.
- Best Effort queue is assigned low-priority with a remainder of transmit-rate
- Buffering scheduler configuration values are set up according to the queue transmit-rate, except the Voice queue is configured with a temporal value of 10ms.
- Traffic is marked using DSCP for IPv4 packets and BA classification with arbitrary values consistent across the network
The TCP profiles are passed to BNG through radius server parameters.
Solution Validation Requirements
This JVD validates an end-to-end network architecture and design using SR MPLS, IPv4 IGP as underlay, and EVPN pseudowires at scale under multiple stress conditions to emulate Business as Usual Operations (BAU OPS).
- Validate EVPN E-LINE for PWHT into a BBE/BNG
- Validate EVPN E-LINE with FXC for PWHT into a BBE/BNG
- Validate BNG failover for:
- Stateless Rapid Reconnect (RR)
- N:1 Stateful Model (N<4)
- Validate L3 routing when using ESI LAG to an ‘OLT’
- Capacity planning and monitoring:
- Bandwidth per PFE in the BBE
- Subscribers per pseudowire terminated on the BBE
- The subscriber scale included is a reasonable approximation of values used in service provider networks. JVD is considered a design blueprint rather than an extensive unidimensional scale testing.
- Validation of basic per subscriber QoS profile with policer attached.
- Validation of largescale subscribers’ QoS behaviours.
Key Measurements
Record the following items as a part of JVD testing.
- In a BBE network failure scenario:
- pseudowire re-routing during:
- Link failure event (should be ≤50ms)
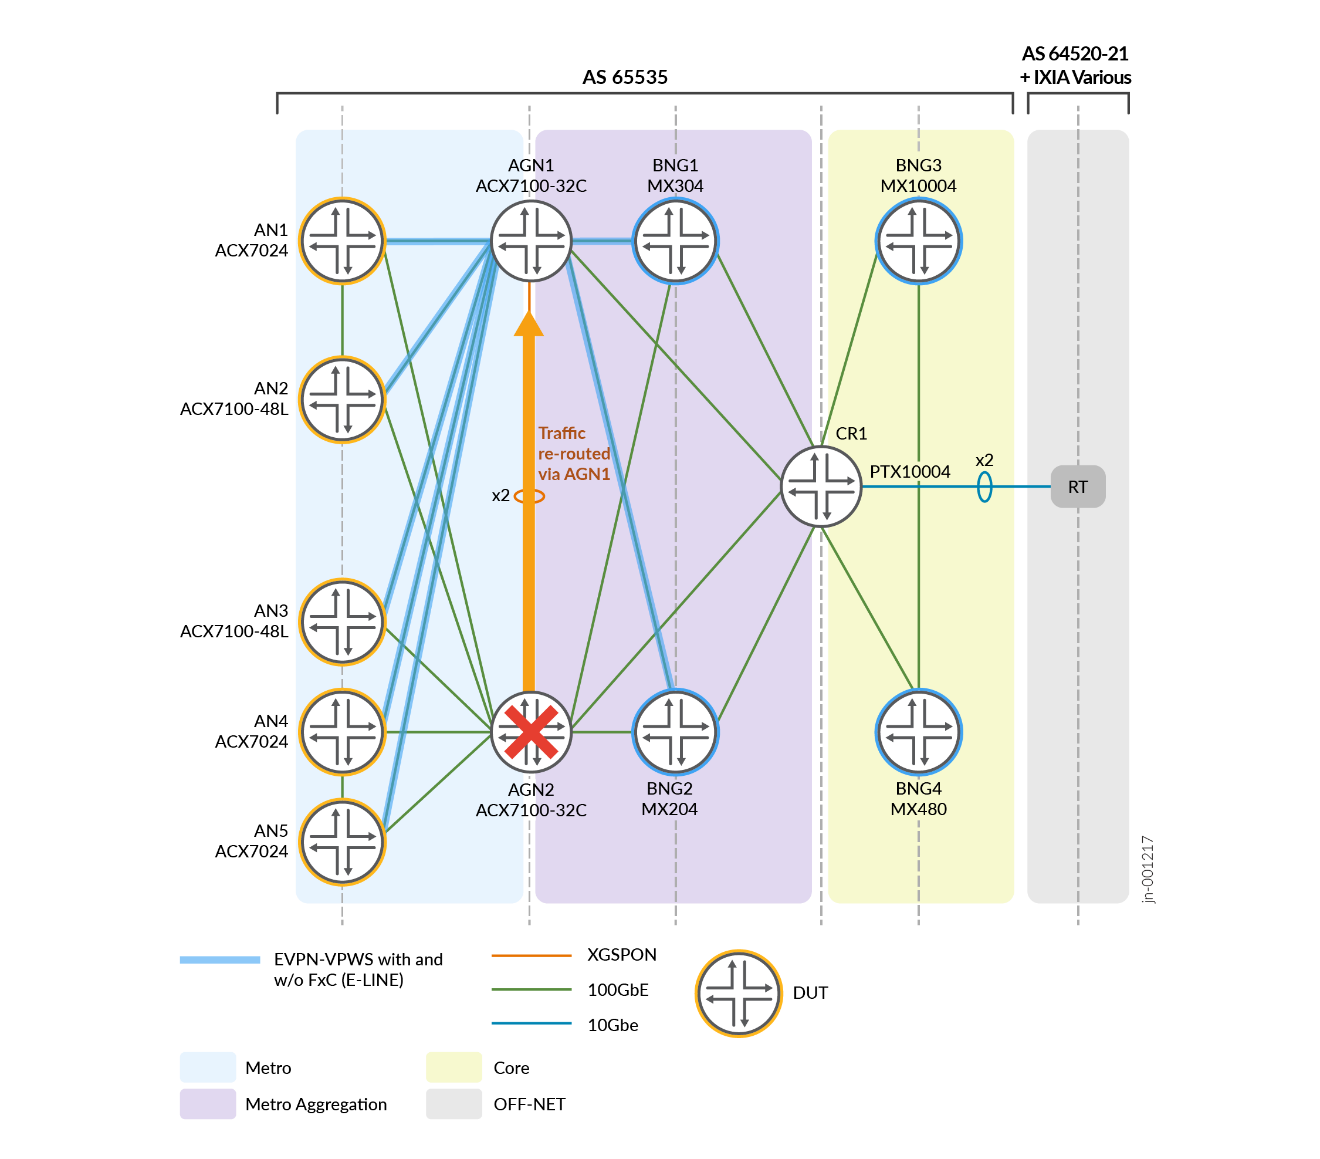
- AGNx node failure event (should be ≤50ms)
- pseudowire re-routing during:
- In a BNG failover scenario:
- Time to reconnect for a subscriber. This time is expressed as connections per second (CPS) occurring on the BNG backup. Typical values observed are approximately 300 CPS. Results depend on variable factors, such as hardware platforms.
- In a BNG recovery scenario:
- Repeat the above steps during the recovery period while no state exists between BBE/BNG pair.
Failover Testing
Following are examples of the failure scenarios.
- AGN Failure: During the AGN2 failure event, network resiliency mechanisms (ECMP) ensure that traffic destined for BNG2 (and potentially BNG4) is rerouted immediately to AGN1.
- BNG1 Failure: If BNG1 fails, then all the subscribers should failover immediately to BNG2 and remain in a ‘fail open’ state until the subscriber re-authenticates.
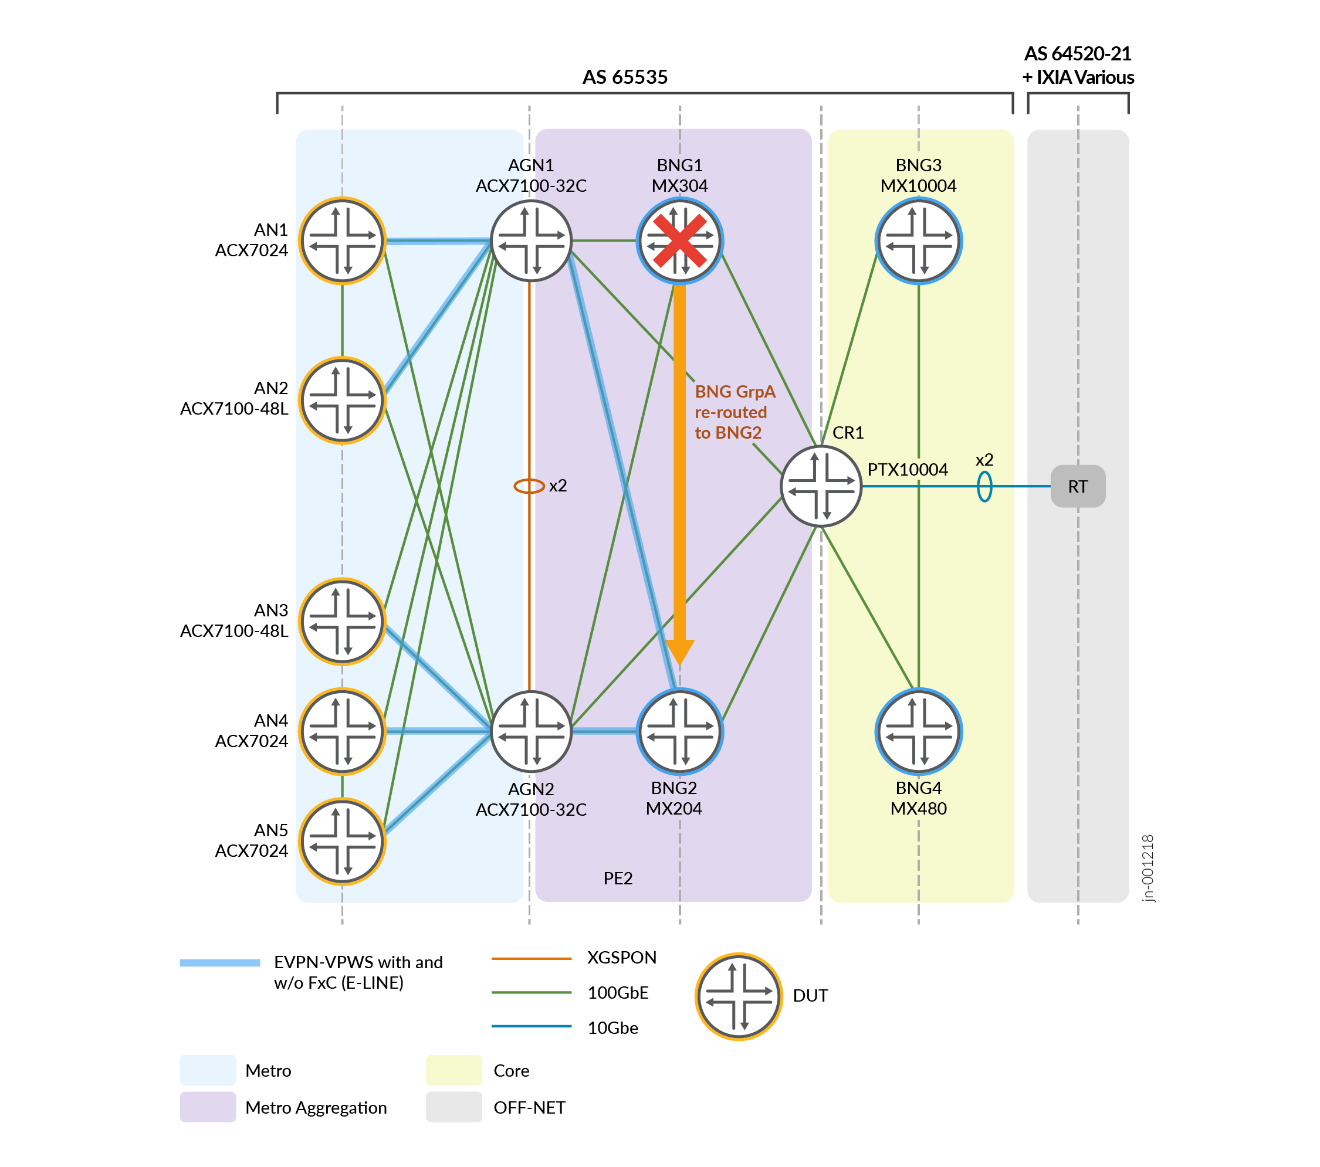
- BNG1 and BNG2 Failures: If BNG1 and BNG2 fail, then all of the subscribers should failover immediately to their respective backup BNGs (see Broadband Subscribers ) and remain in a ‘fail open’ state until the subscriber re-authenticates (see Stateless Rapid Reconnect (RR) Model ).
- ESI LAG failover. L2 device (switch or OLT) is multihomed to AN and in case of one link failure (between L2 device and AN) second AN can forward traffic. This failover can happen between AN1 and AN2 nodes as an example.
- Core link between AN and AGG device failover. Fast underlay (SR-MPLS) restoration happens because of TL-LFA (topology independent loop-free alternates).
Test Bed Device Configuration
Base configuration examples for AN, AGN, and BNG nodes are as follows:
AN4 EVPN-VPWS instance configuration example on ACX7024.
regress@rtme-acx7024-03# show routing-instances METRO_BBE_EVPN_VPWS_IPoE_GROUP_10
instance-type evpn-vpws;
protocols {
    evpn {
        interface ae1.1050 {
            vpws-service-id {
                local 20;
                remote 40;
            }
        }
    }
}
interface ae1.1050;
route-distinguisher 103.103.103.103:1050;
vrf-target target:60000:1050;
regress@rtme-acx7024-03# show interfaces ae1
flexible-vlan-tagging;
mtu 9102;
encapsulation flexible-ethernet-services;
aggregated-ether-options {
    lacp {
        active;
        periodic fast;
        system-id 00:00:00:00:04:04;
    }
}
unit 1050 {
    encapsulation vlan-ccc;
    vlan-id 1050;
    esi {
        00:10:11:11:11:11:11:00:00:4a;
        all-active;
    }
    family ccc;
}
AN5 EVPN-VPWS configuration example on ACX7024.
regress@rtme-acx7024-09# show routing-instances METRO_BBE_EVPN_VPWS_IPoE_GROUP_10
instance-type evpn-vpws;
protocols {
    evpn {
        interface ae1.1050 {
            vpws-service-id {
                local 20;
                remote 40;
            }
        }
    }
}
interface ae1.1050;
route-distinguisher 104.104.104.104:1050;
vrf-target target:60000:1050;
regress@rtme-acx7024-09# show interfaces ae1
flexible-vlan-tagging;
mtu 9102;
encapsulation flexible-ethernet-services;
aggregated-ether-options {
    lacp {
        active;
        periodic fast;
        system-id 00:00:00:00:04:04;
    }
}
unit 1050 {
    encapsulation vlan-ccc;
    vlan-id 1050;
    esi {
        00:10:11:11:11:11:11:00:00:4a;
        all-active;
    }
    family ccc;
}
BNG1 (MX304) and BNG2 (MX204) EVPN-VPWS with PWHT instance configuration examples.
              BNG1:

regress@jvd-awan-mx304-h# show routing-instances METRO_BBE_EVPN_VPWS_IPoE_GROUP_10
instance-type evpn-vpws;
protocols {
    evpn {
        interface ps20.0 {
            vpws-service-id {
                local 40;
                remote 20;
            }
        }
    }
}
interface ps20.0;
route-distinguisher 192.168.107.107:1050;
vrf-target target:60000:1050;

BNG2:

regress@jvd-awan-mx204-i# show routing-instances METRO_BBE_EVPN_VPWS_IPoE_GROUP_10
instance-type evpn-vpws;
protocols {
    evpn {
        interface ps20.0 {
            vpws-service-id {
                local 40;
                remote 20;
            }
        }
    }
}
interface ps20.0;
route-distinguisher 192.168.108.108:1050;
vrf-target target:60000:1050;
BNG3 (MX10004) and BNG4 (MX480) EVPN-VPWS with PWHT configuration examples.
              BNG3:
regress@jvd-awan-mx10k4-e# show routing-instances METRO_BBE_EVPN_VPWS_IPoE_GROUP_10
instance-type evpn-vpws;
protocols {
    evpn {
        interface ps20.0 {
            vpws-service-id {
                local 40;
                remote 20;
            }
        }
    }
}
interface ps20.0;
route-distinguisher 192.168.109.109:1050;
vrf-target target:60000:1050;

BNG4:
regress@jvd-awan-mx480-n# show routing-instances METRO_BBE_EVPN_VPWS_IPoE_GROUP_10
instance-type evpn-vpws;
protocols {
    evpn {
        interface ps20.0 {
            vpws-service-id {
                local 40;
                remote 20;
            }
        }
    }
}
interface ps20.0;
route-distinguisher 192.168.110.110:1050;
vrf-target target:60000:1050;
The following example shows the associated BNG PS interface configurations.
              BNG1:
regress@jvd-awan-mx304-h# show interfaces ps20
anchor-point {
    lt-3/2/0;
}
flexible-vlan-tagging;
auto-configure {
    stacked-vlan-ranges {
        dynamic-profile auto-stacked-pwht_dhcp {
            accept any;
            ranges {
                any,any;
            }
        }
        authentication {
            packet-types any;
            password joshua;
            username-include {
                domain-name jnpr.net;
                user-prefix pwht_dhcp;
            }
        }
        access-profile vlan-auth-access1;
    }
    remove-when-no-subscribers;
}
mtu 2022;
esi {
    00:10:12:12:12:12:12:00:00:4a;
    single-active;
    df-election-type {
        preference {
            value 995;
        }
    }
}
mac aa:aa:aa:bb:bb:bb;
no-gratuitous-arp-request;
unit 0 {
    encapsulation ethernet-ccc;
}