ON THIS PAGE
Validation Framework
This JVD addresses the automatization of a physical 5G fronthaul CoS LLQ JVD network. A crucial aspect of the overall solution is to enhance the network deployment using Paragon Automation and other automation tools (for example, python scripts, and a DHCP server).
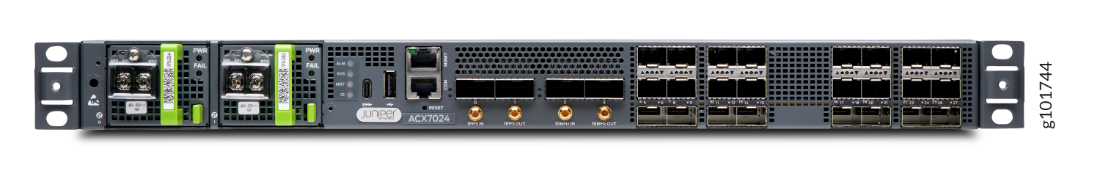
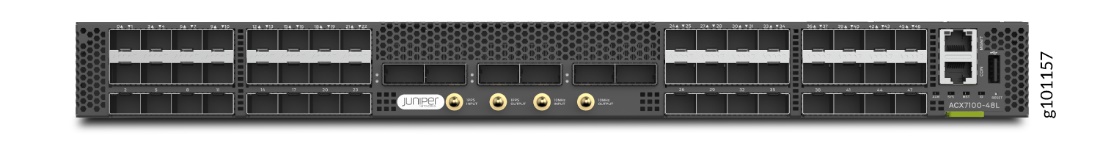
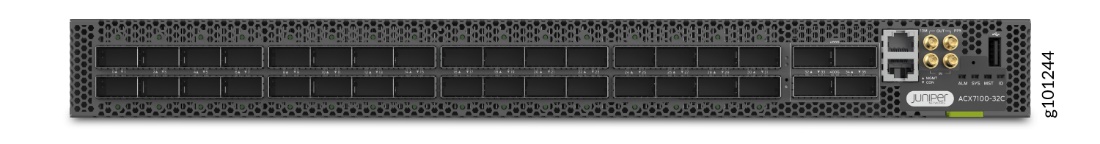
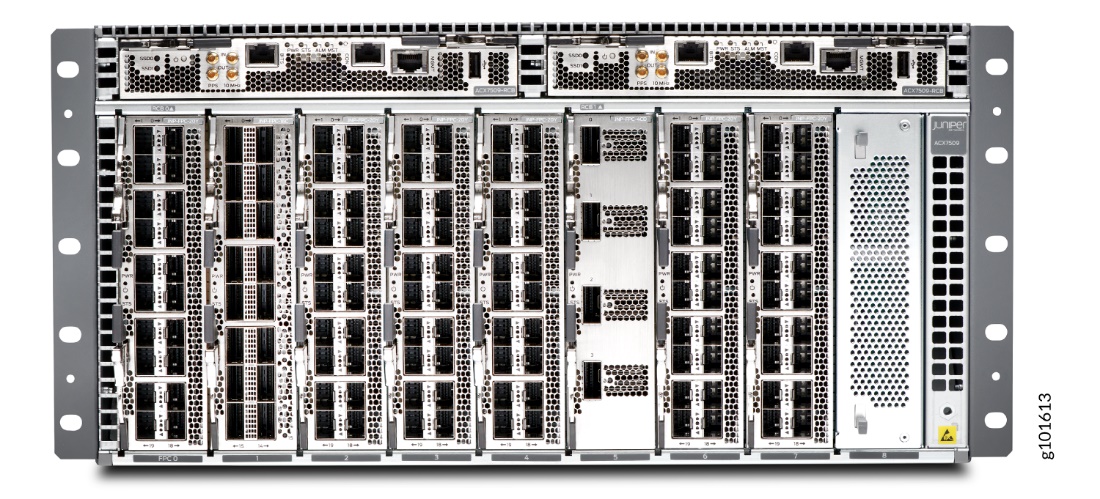
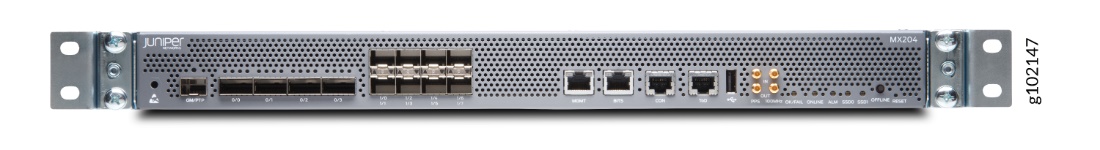
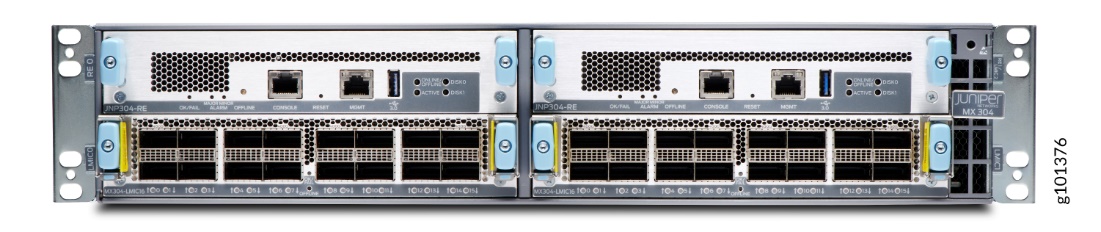
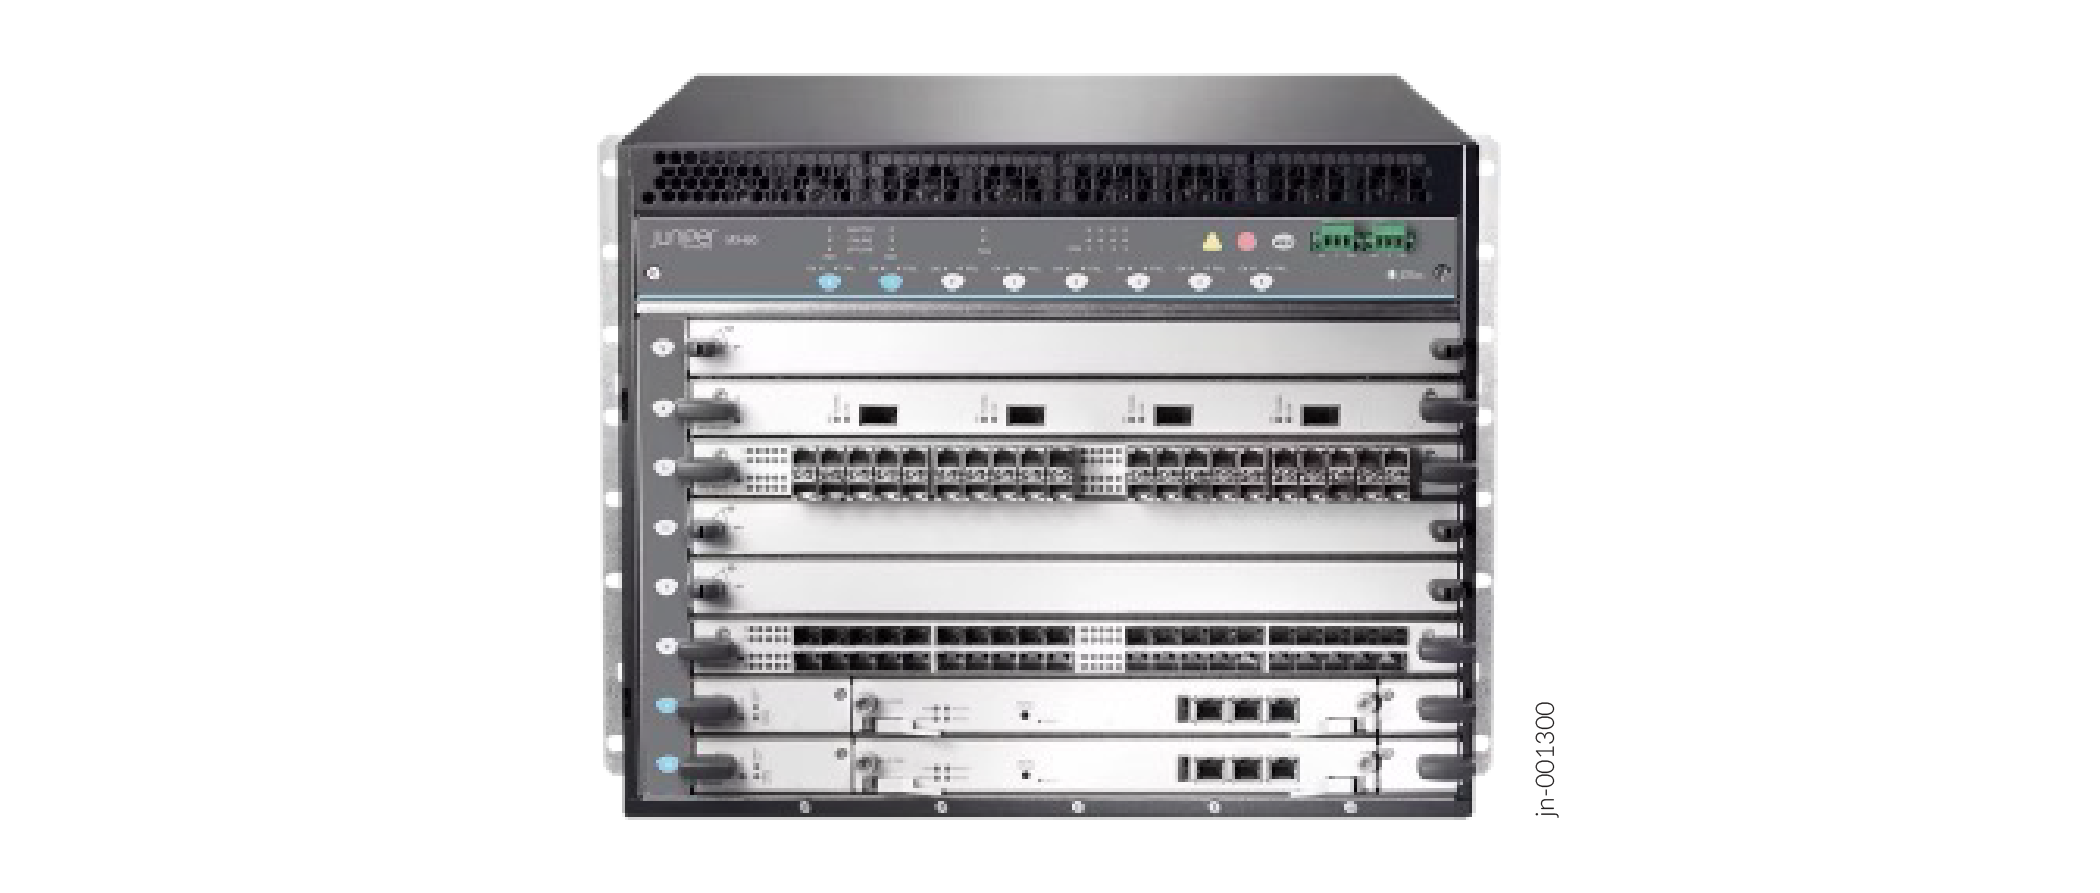
Figure 1 explains the connectivity for building the lab topology used to validate the physical 5G fronthaul CoS LLQ JVD infrastructure. The fronthaul segment leverages a spine-and-leaf topology, enabling connections between access nodes supporting Cell Site Router (CSR) functionality to pre-aggregation nodes supporting Hub Site Router (HSR) functions. The access segment leverages 100GbE speed for the proposed topology, supporting up to 400GbE port speed. CSR aggregates O-RU traffic supporting 5G, including legacy 4G workloads. The selected access nodes for the CSR role include the ACX7024 (AN4) and ACX7100-48L (AN1, AN3) Series Routers. HSR aggregates traffic from multiple CSRs, including additional emulated access segments and supports connectivity into the O-DU and O-CU relative to the functional split model. The selected aggregation nodes for the HSR role include the ACX7509 (AG1.1) and ACX7100-32C (AG1.2). Additional helper nodes build out the aggregation and core segments with the MX204 (AG2), MX480 (AG3), and PTX10001-36MR (CR1, CR2) Series Routers. Finally, the MX304 platform supports the Services Aggregation Gateway (SAG) role. This is exactly the same as in 5G Fronthaul JVD solution ( Low Latency QoS Design for 5G Solution ), but including a DHCP server and the Paragon Automation system. Both are directly connected through OOB network to every single node in the topology, except the access nodes. The access nodes (AN1, AN3, and AN4 in Figure 1 ) are assumed to not have OOB access. Therefore, the connectivity to both DHCP and Paragon is done through in-band. See the following diagram explaining it.
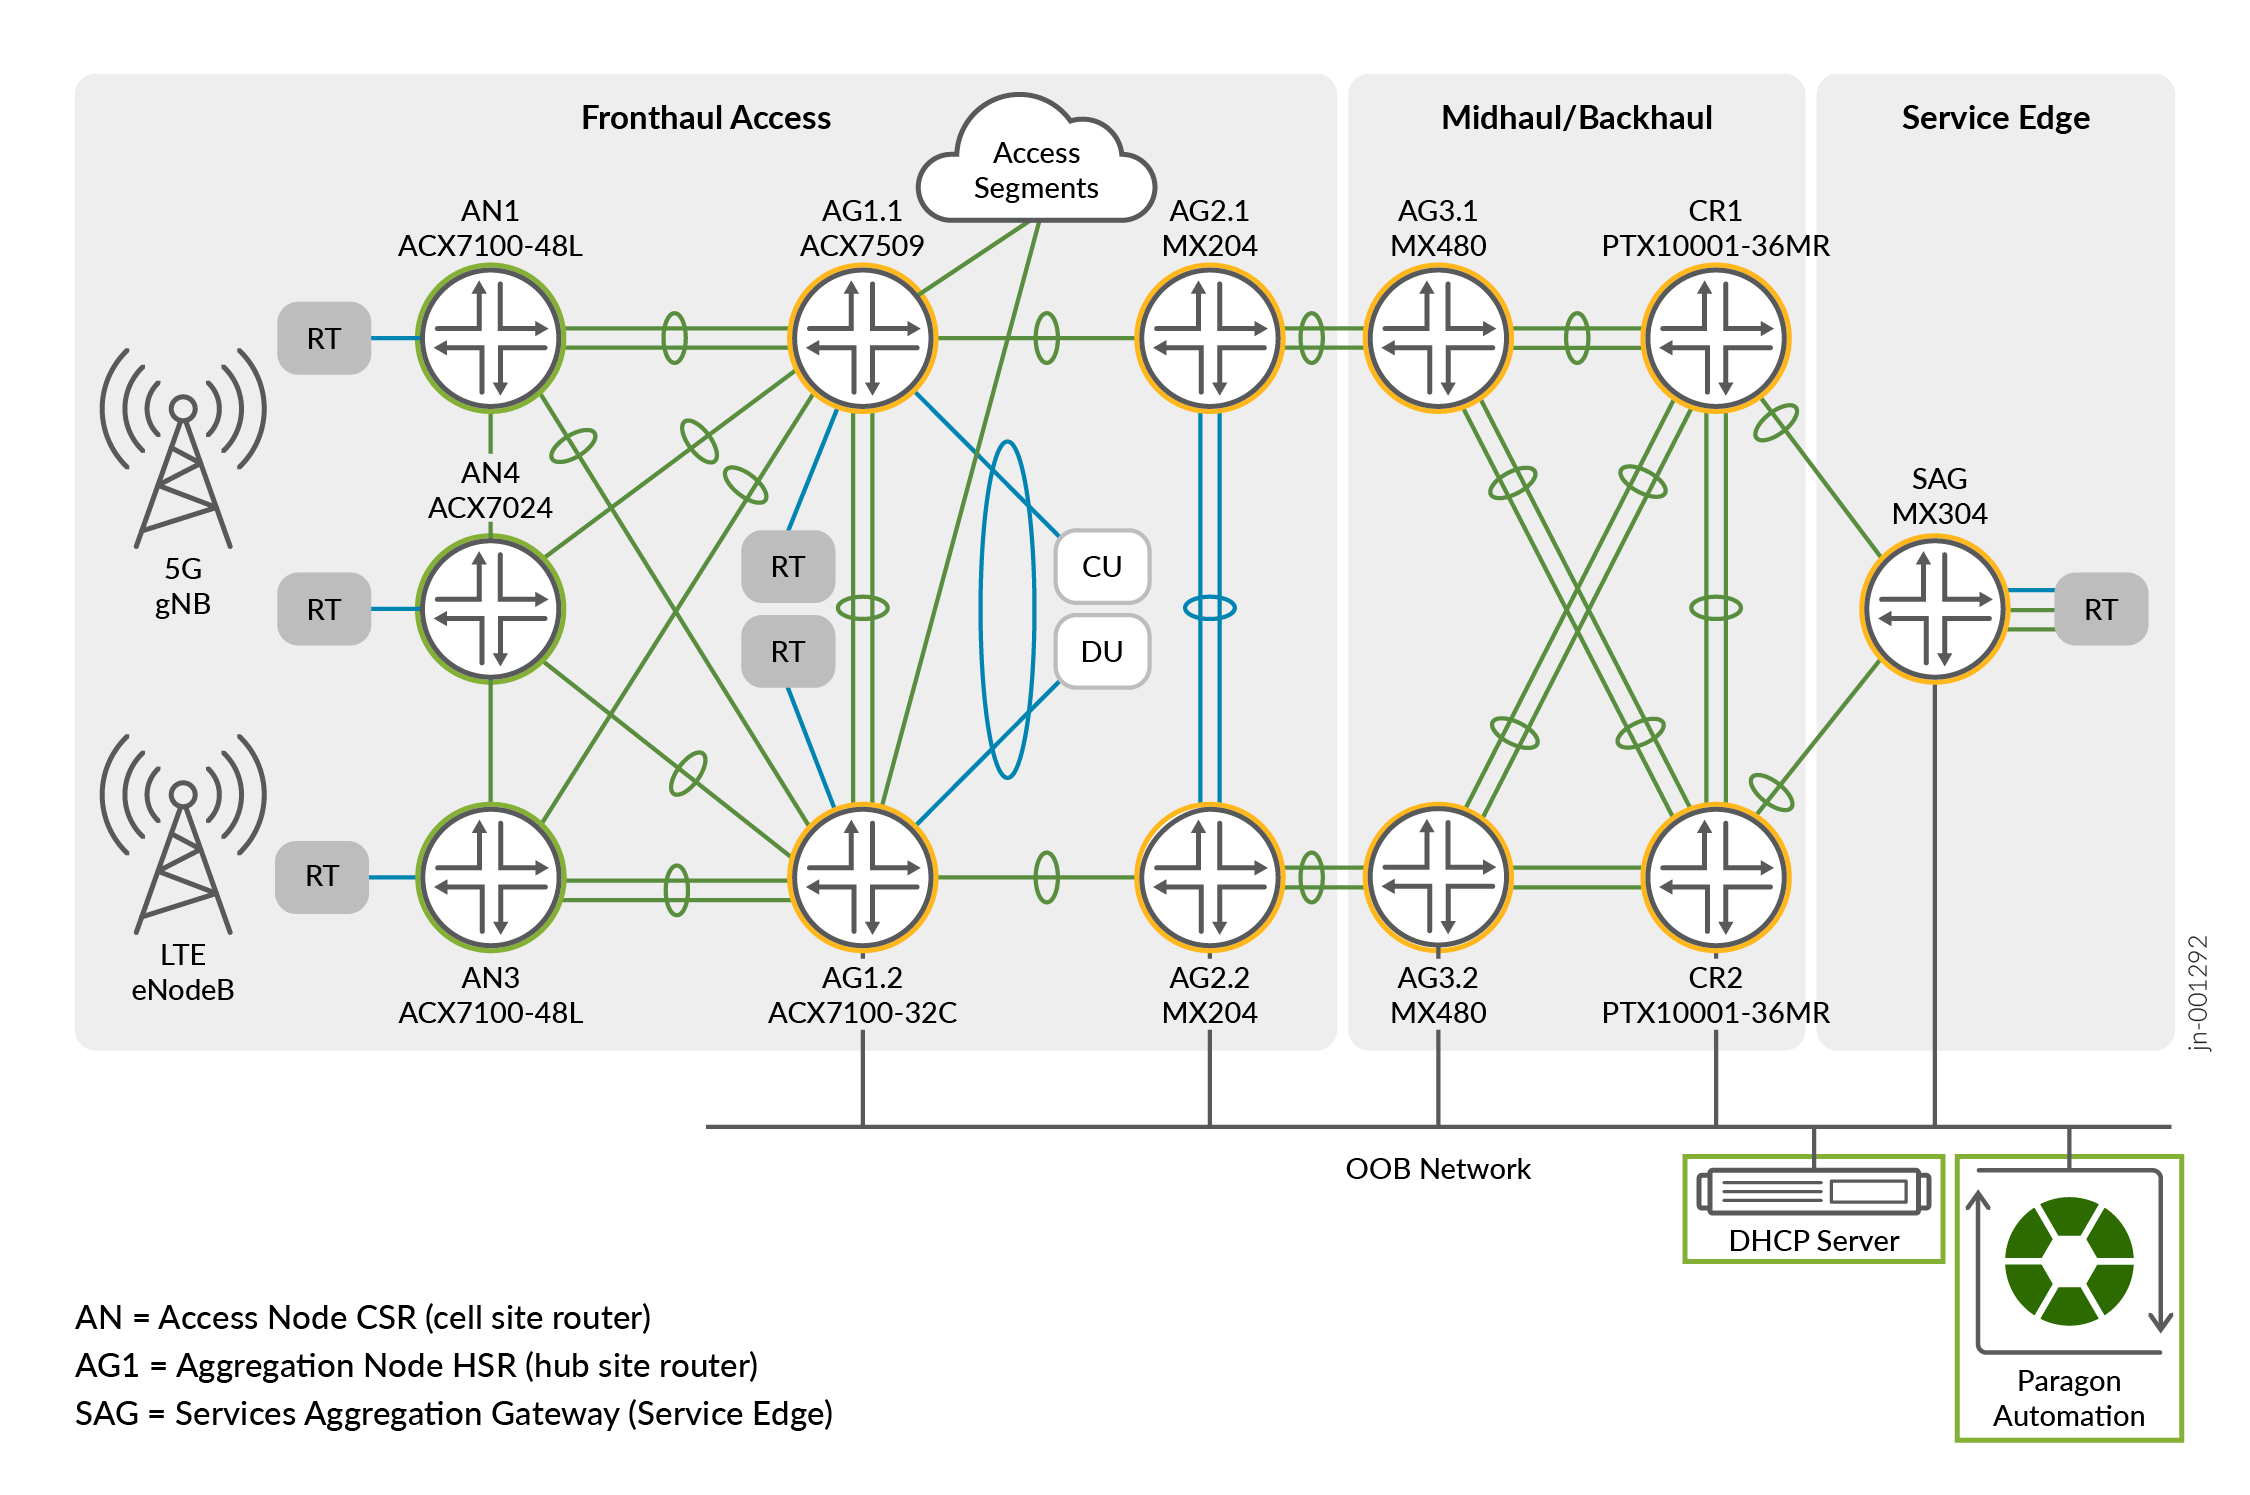
The devices highlighted in Figure 1 are explained as follows:
- AN4 ACX7024 – DUT (one circled in green) and DHCP and Paragon Automation (squared in green), have undergone extensive testing, being involved directly in the automated Zero Touch Provisioning (ZTP) process.
- Other devices circled in orange are tested through manual onboarding (CLI) and configuration provisioning using python scripts. All these onboarded devices are thoroughly checked to ensure all health checks are performed by Paragon Automation on network devices yielding satisfactory results. If any alerts and alarms are raised when there are issues in the network, then monitor device health accordions and view the details of alerts and alarms.
- CU and DU devices (in black) are used only as a helper and are not onboarded or tested.
An organization in Paragon Automation represents a customer. An organization can have multiple sites representing the locations where routers, switches, and firewalls are installed. Each device managed by Paragon Automation must be assigned to a site for efficient management such as for applying policies.
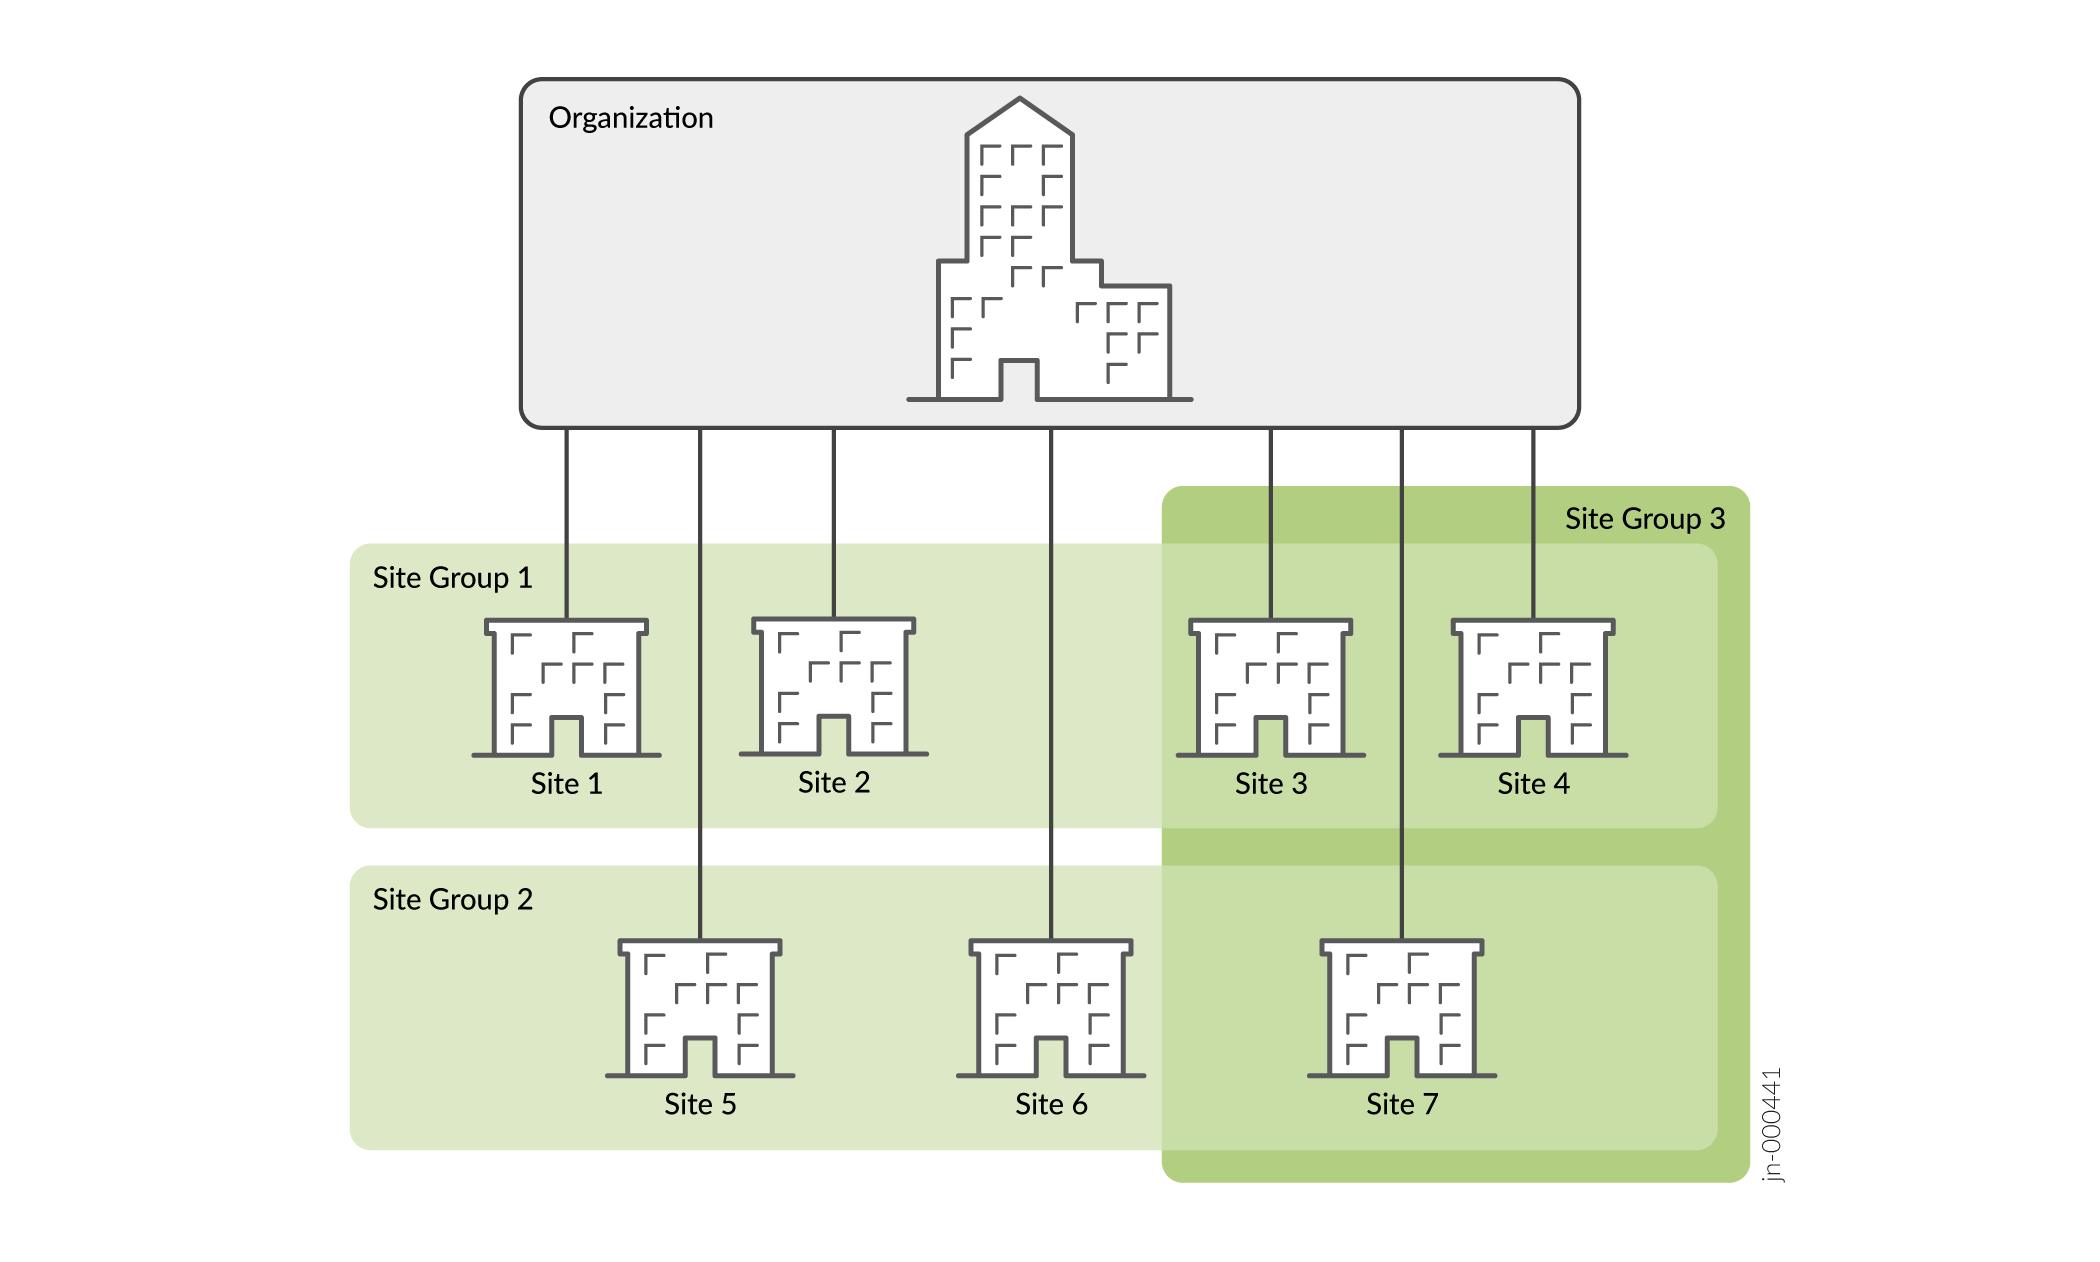
Figure 3 and Figure 4 shows all the sites configured in the lab topology and the configuration of a site in detail (for example, Seattle):
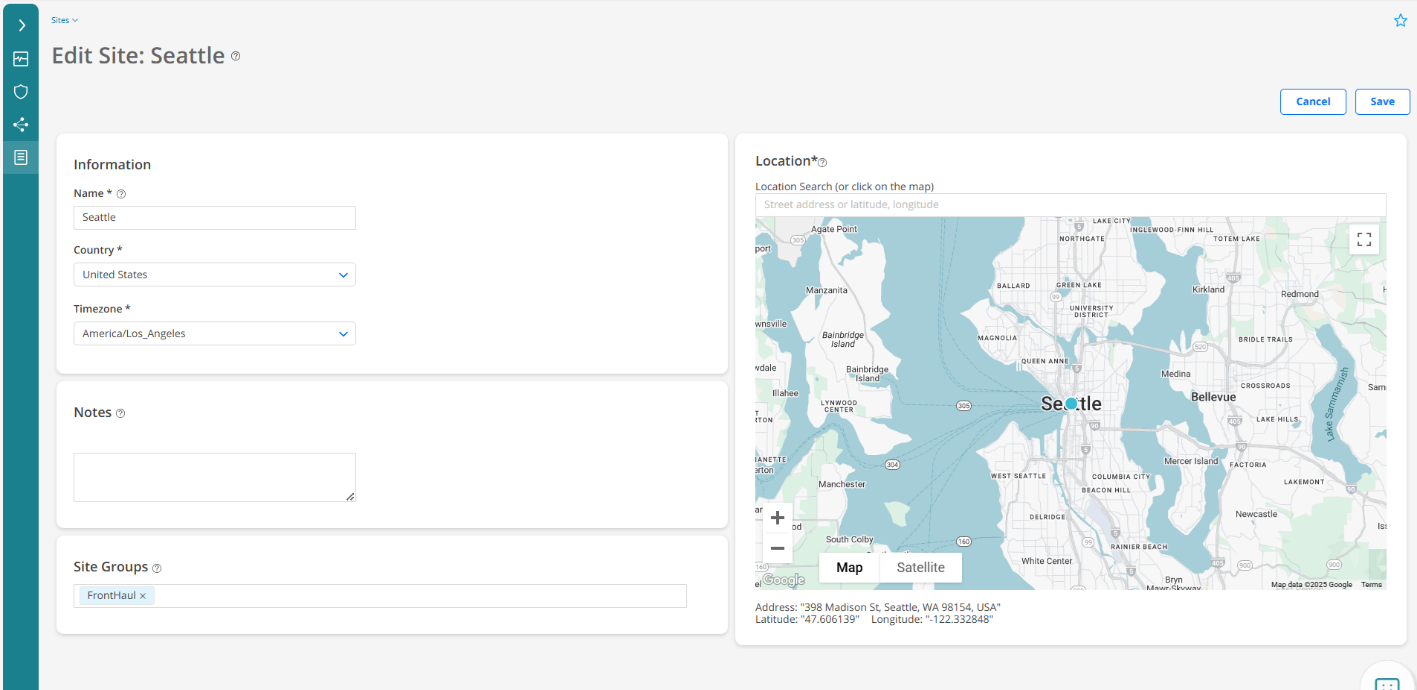
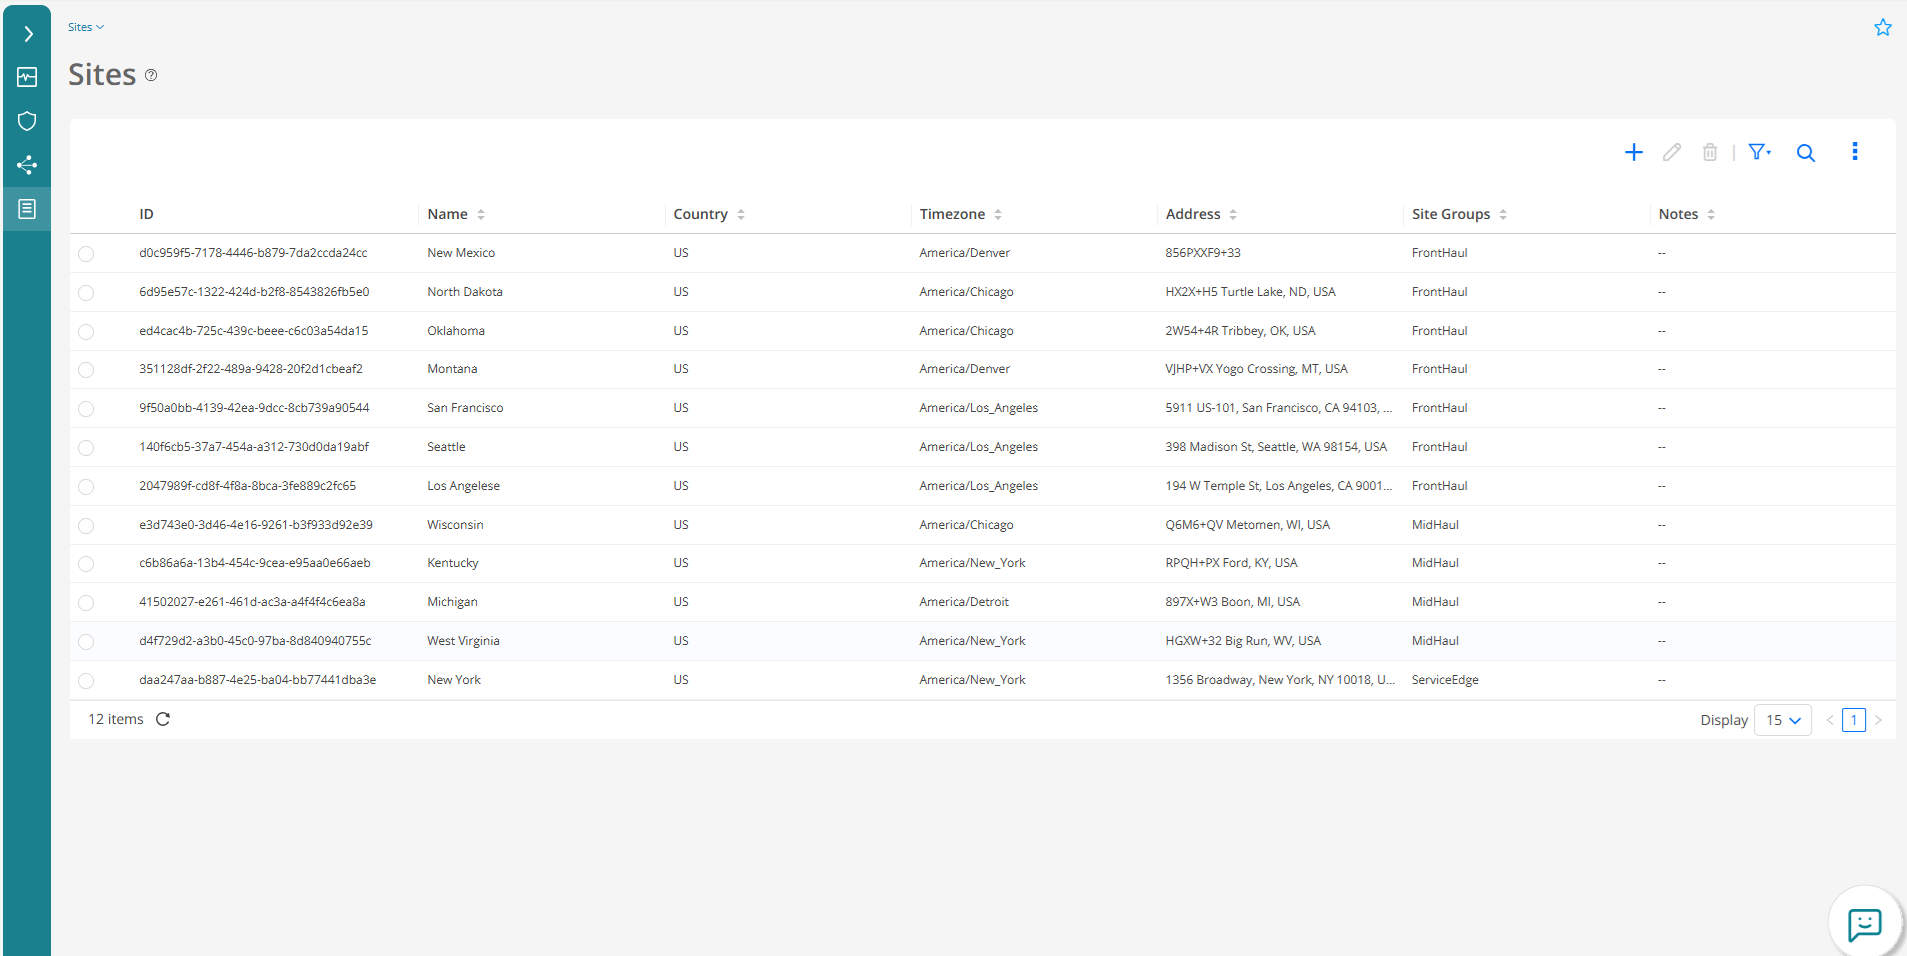
Figure 5 shows different devices (and their assigned sites) used in the JVD topology:
Paragon Automation uses a Network Implementation Plan (NIP) to commit configurations on the device during device onboarding, and update configurations after the device is onboarded. In this phase of the JVD, not all the configurations are provisioned by Paragon, but it is in the roadmap for subsequent releases.
Figure 6 shows an implementation step (links definition) of the network implementation plan:
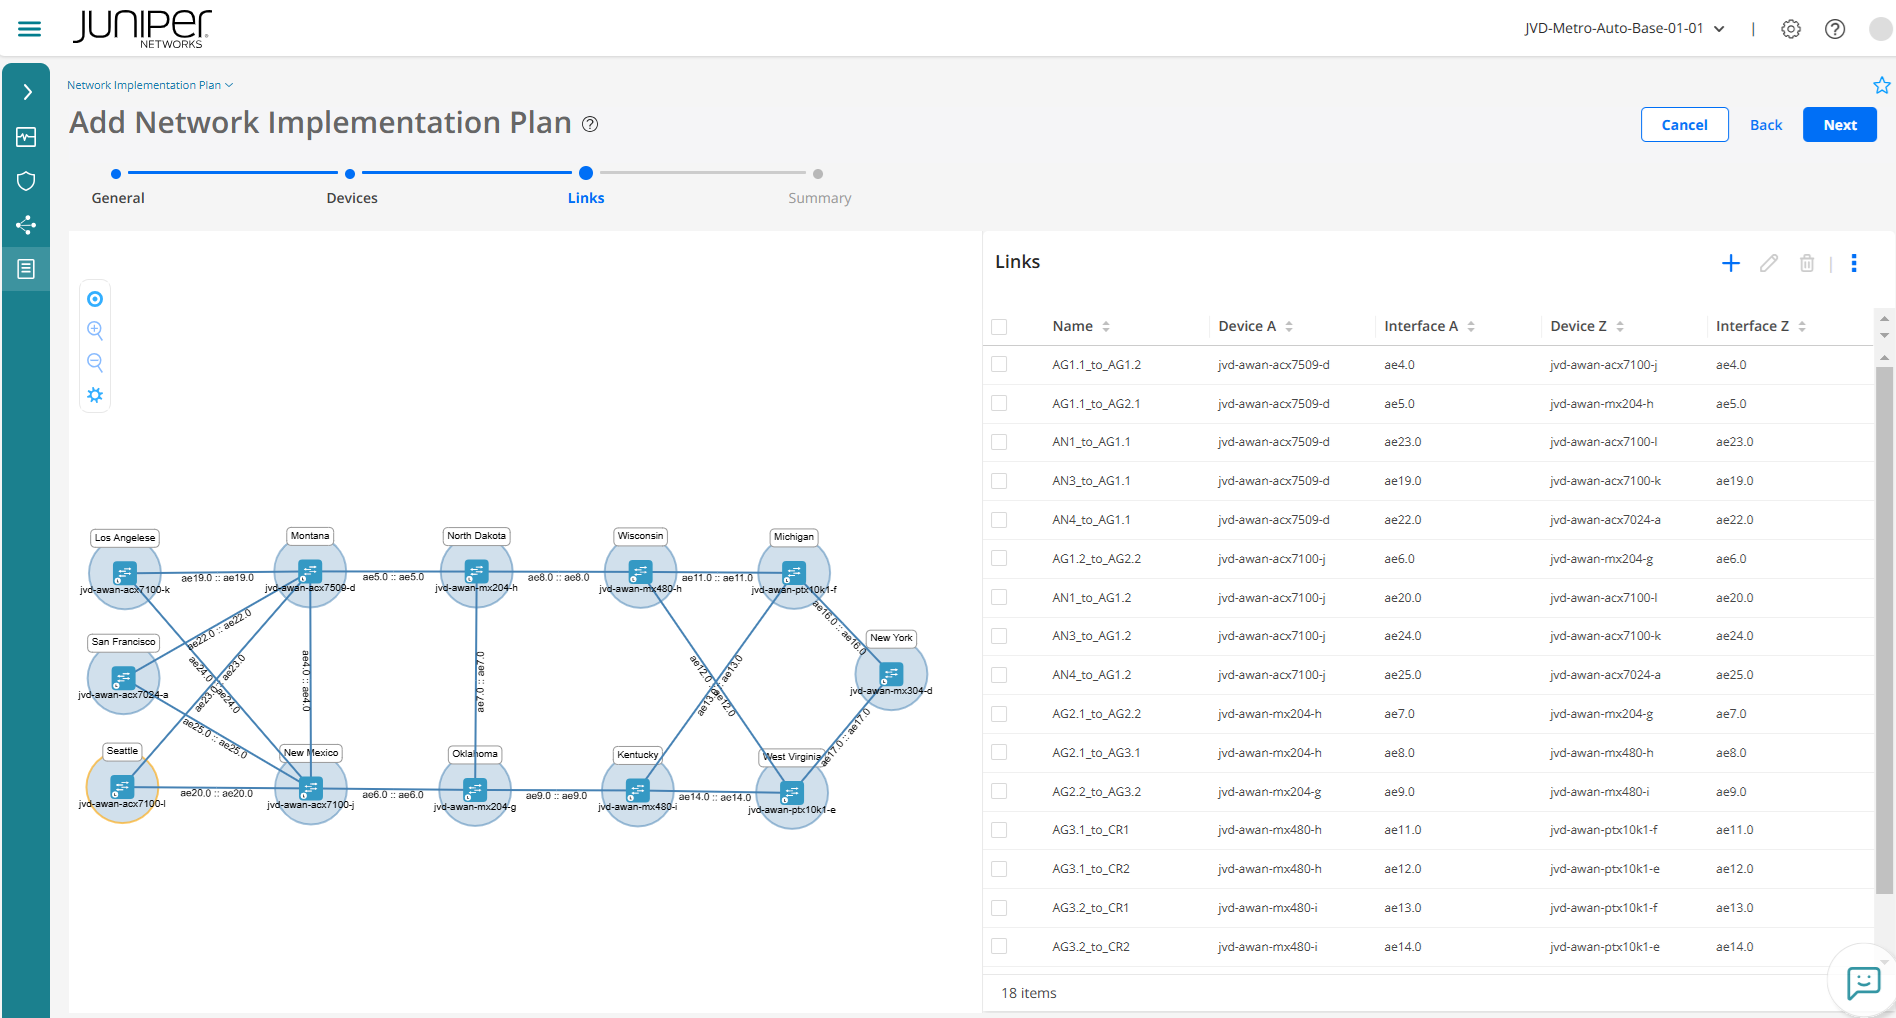
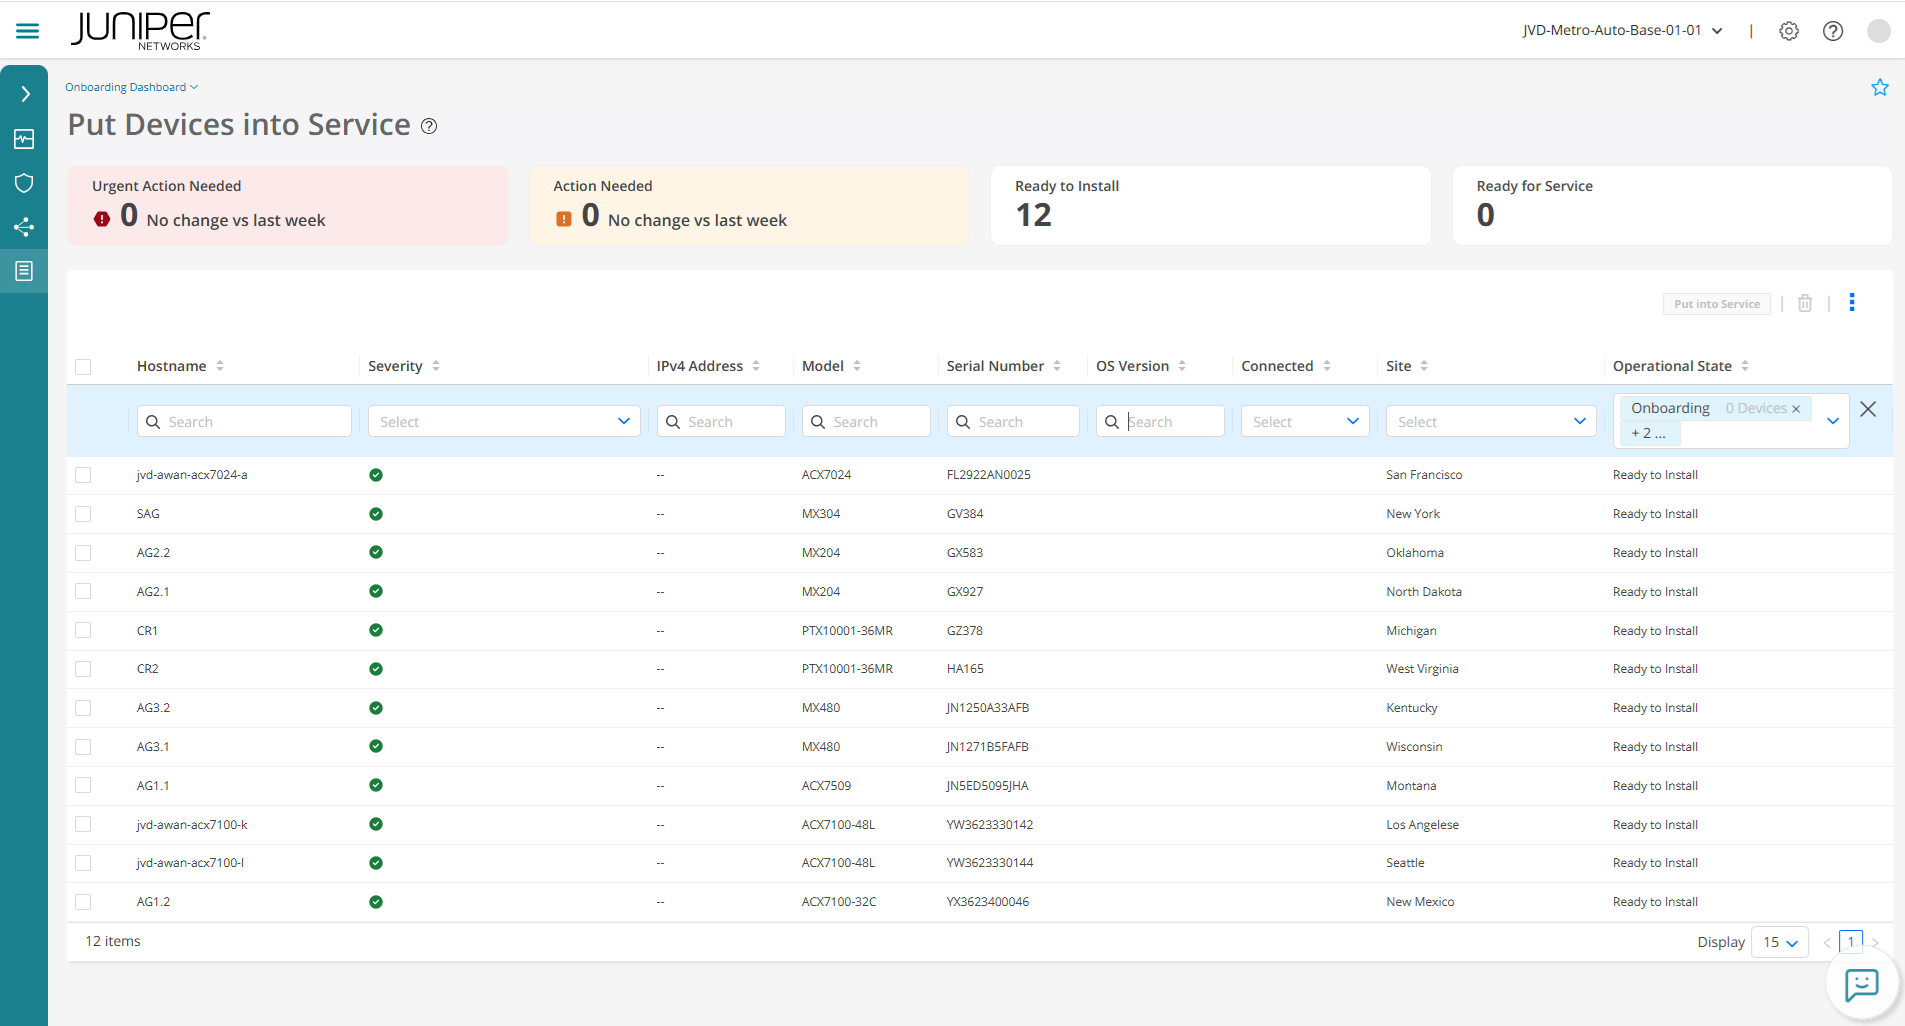
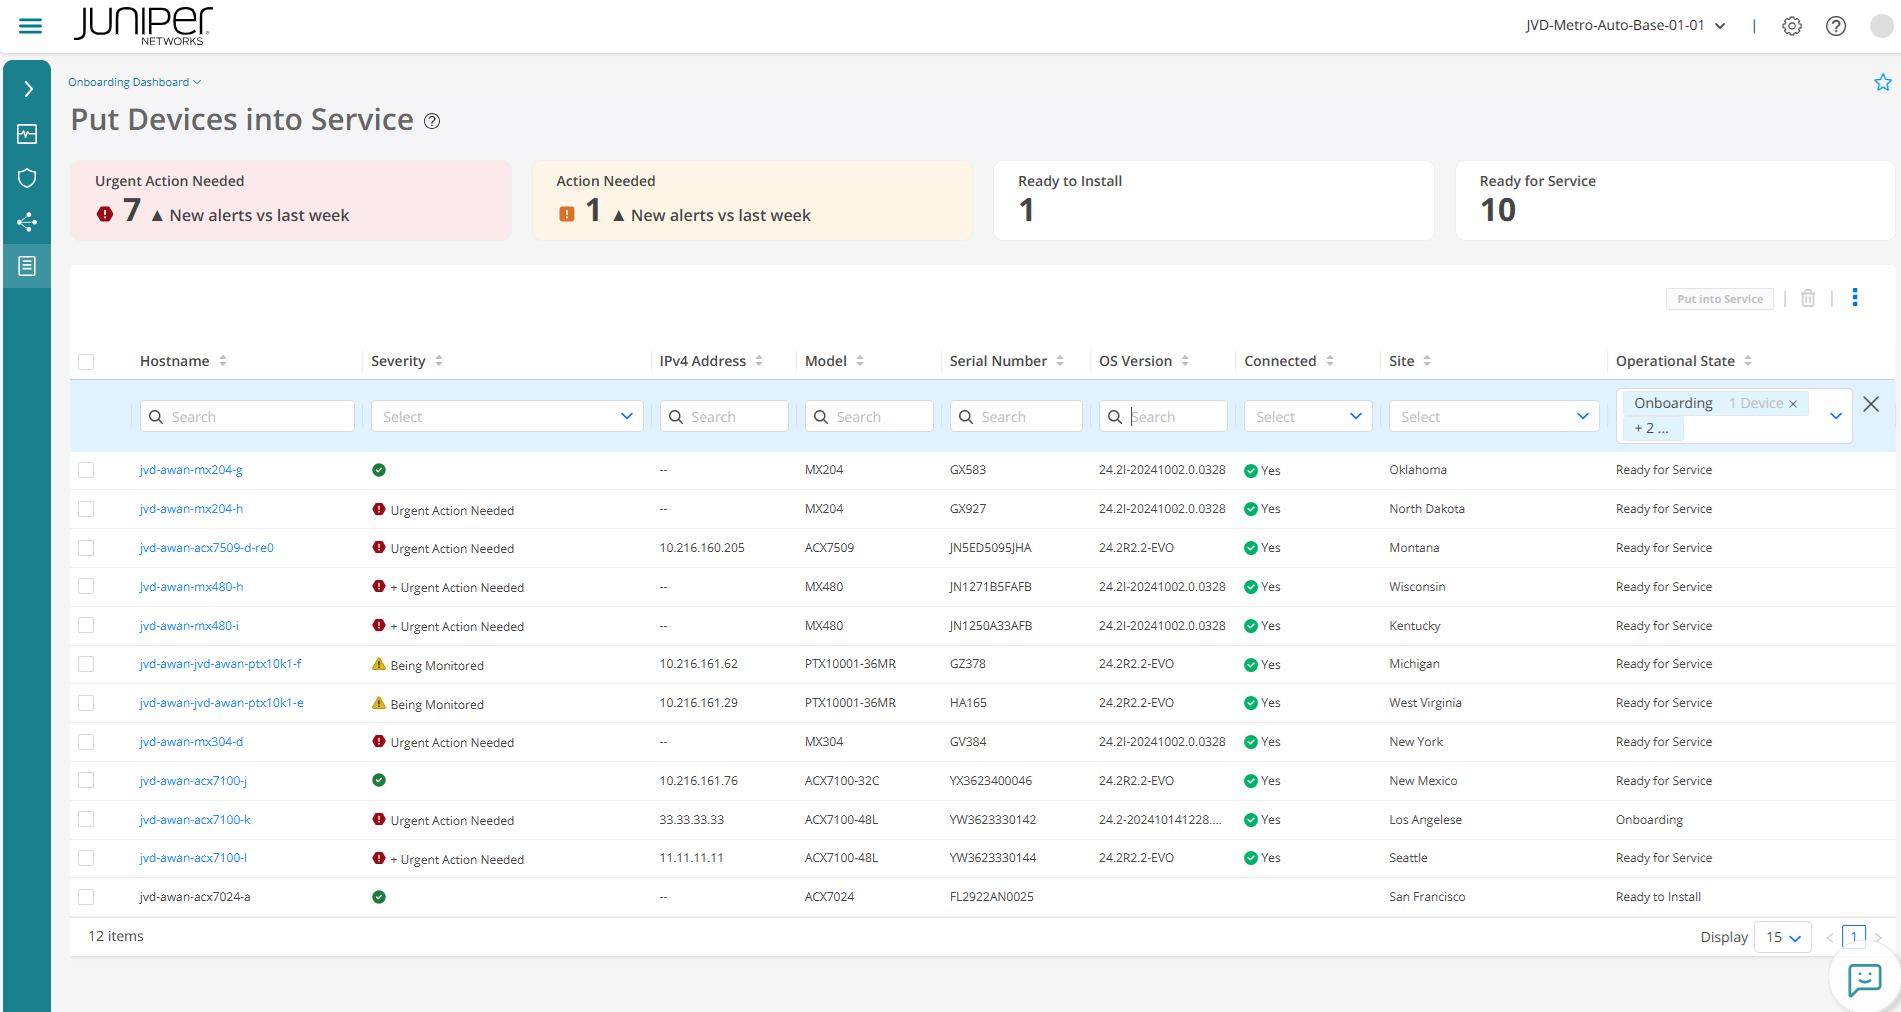
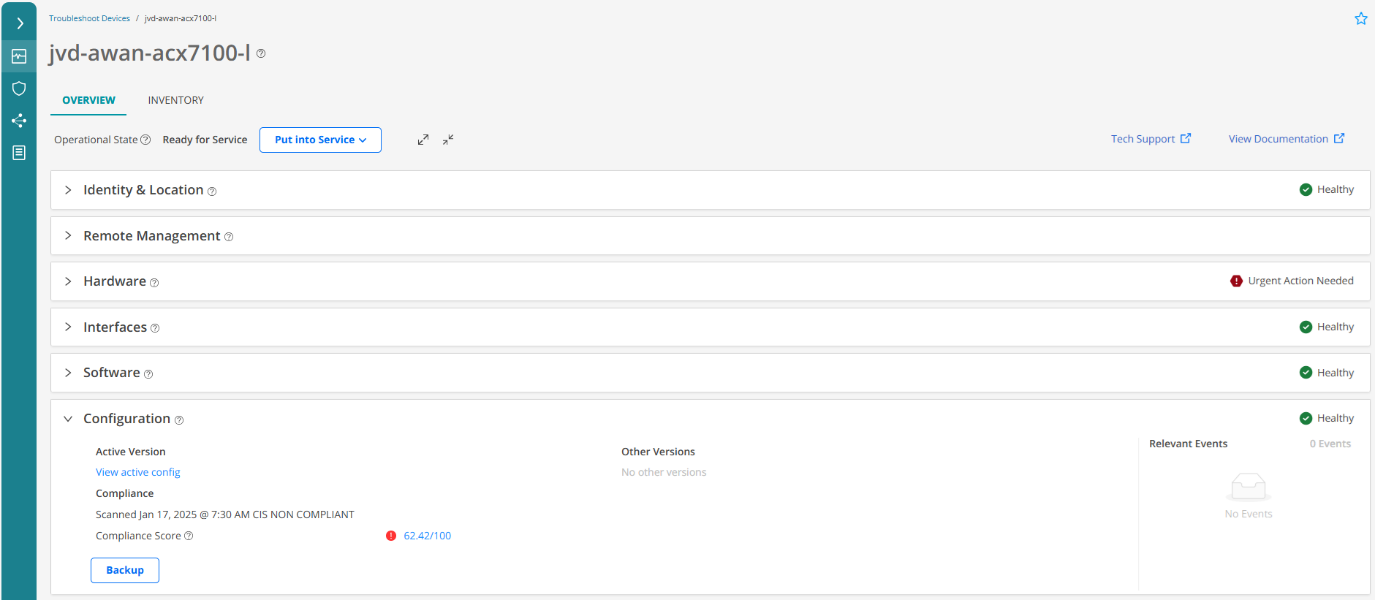
Figure 7 shows onboarding operational state of an access node.
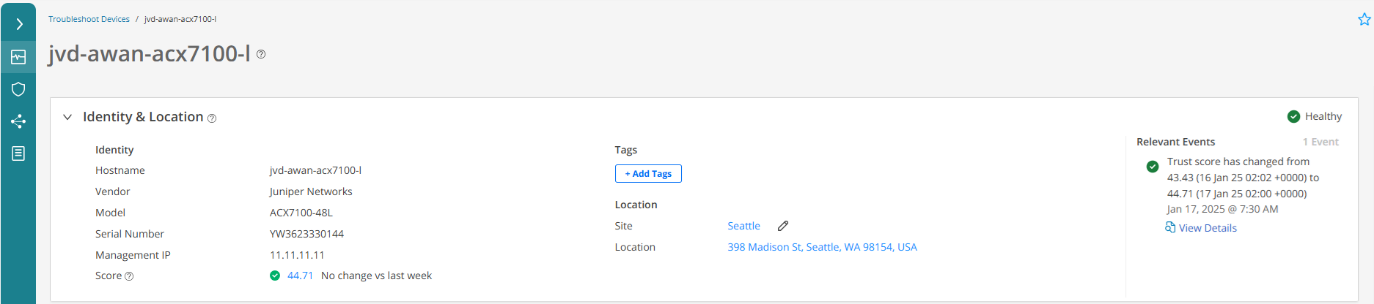
- Identity & Location. Use this accordion to view details (such as vendor, hostname, serial number) of a device and the name and location of the site where the device is installed. You can add tags to the device and also view the most recent trust score recorded for the device, and alerts and alarms related to the trust score.
- Remote Management. Use this accordion to view details of the last outbound SSH and gNMI sessions established or terminated between the device and Paragon Automation as a service. You can also view details about the latest system log and latest alarm that the device generated, and the status of the synchronization between the device’s clock and the NTP server.
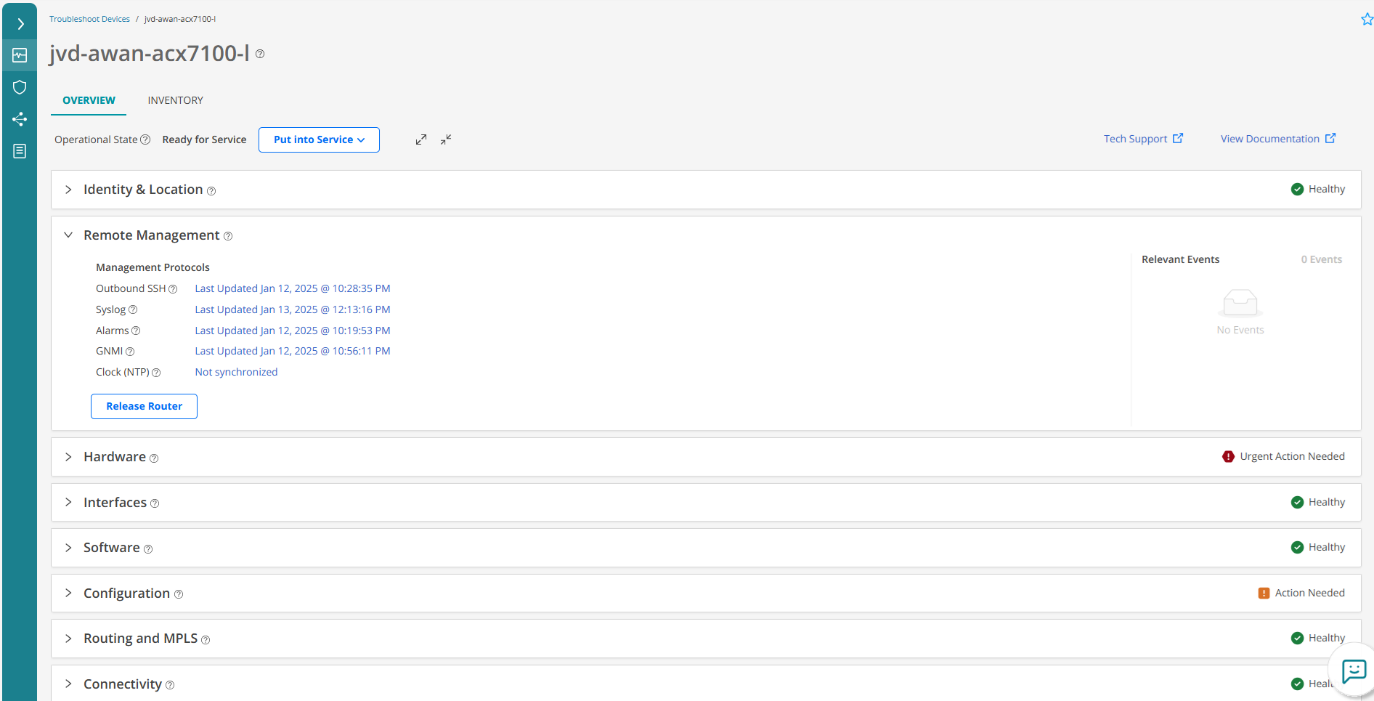
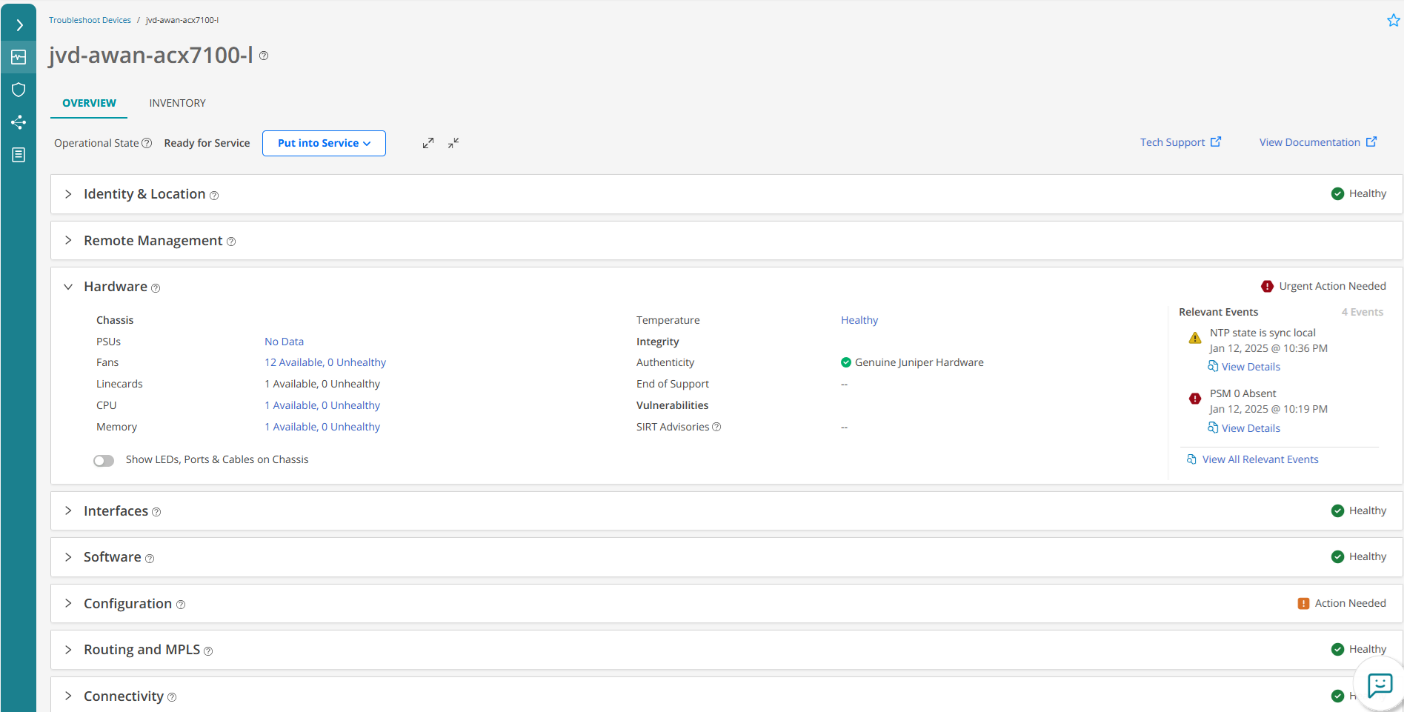
- Hardware. Use this accordion to view data about the number of available and unhealthy chassis components, the KPIs for the components, and the details of temperature sensors. The top-right of the accordion displays the overall health of the device’s hardware components and temperature. Latest events related to hardware performance appear under the Relevant Events section in order of severity.
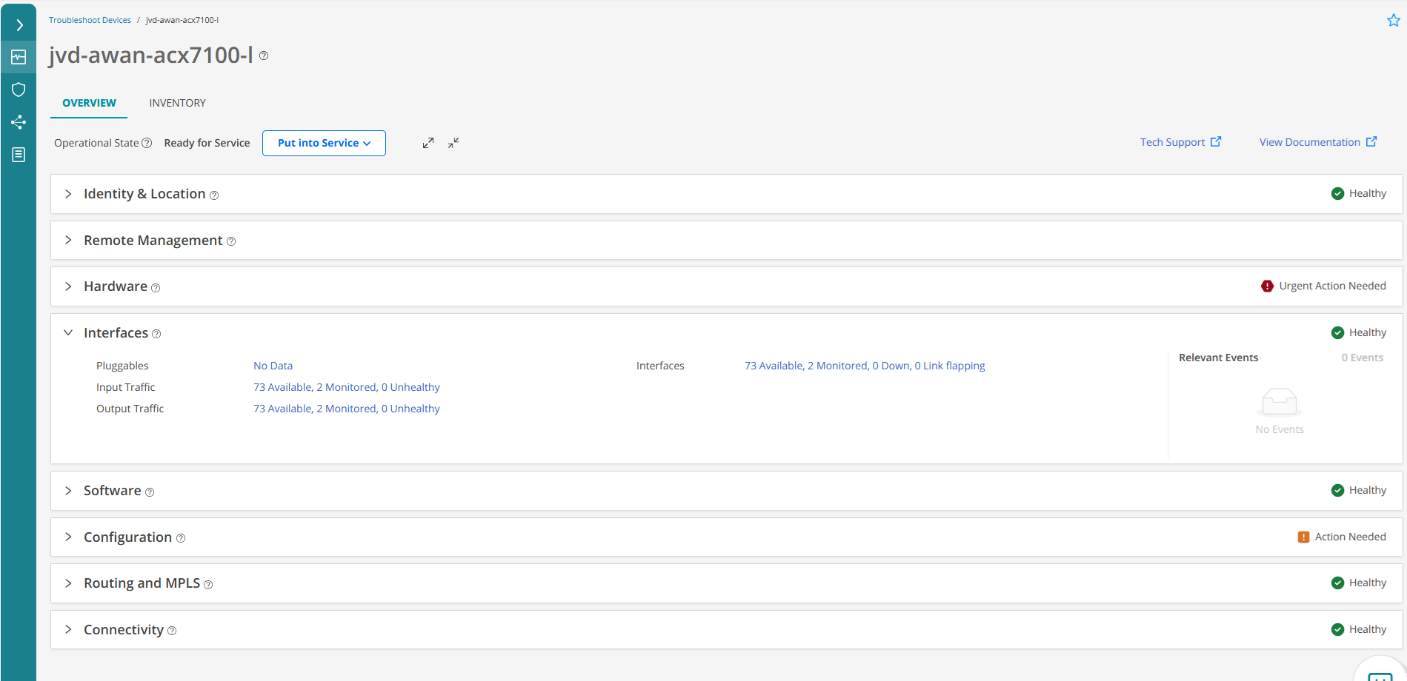
- Interfaces. View the health of the device’s interfaces monitored by Paragon Automation.
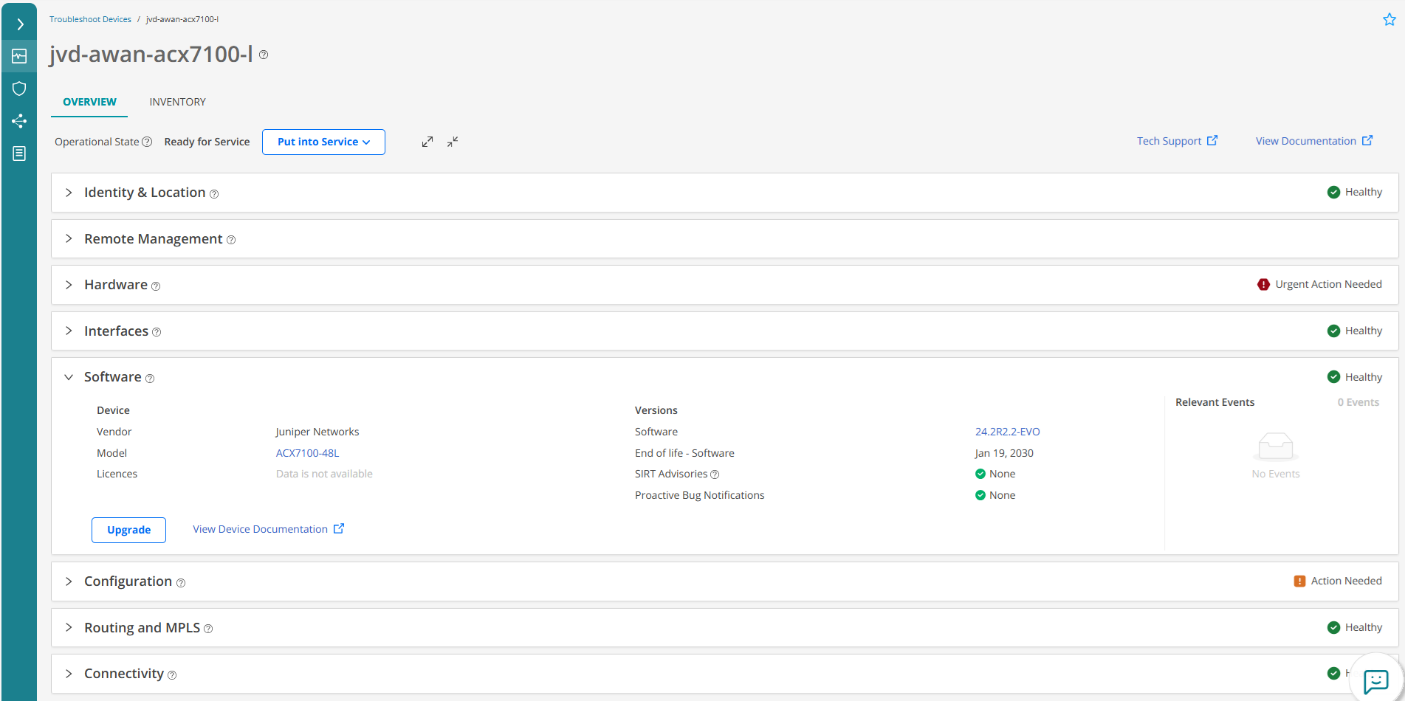
- Software. Displays the details of the OS installed on the device, a link to the OS documentation, and an option to upgrade the OS. The OS details include the OS version installed on the device, end-of-life information, active licenses, and the number of OS related SIRT advisories.
- Configuration: Displays active and backup versions of the device configuration. Gives the option to back up the active configuration. Compares different configuration versions. You can also view the compliance score of the active configuration and alerts and alarms related to the configuration. Displays the status of the overall compliance of the configuration committed on the device.
Inventory Tab
Use the Inventory tab to view a list of all the hardware components present on the chassis, the number of associated physical interfaces, information of licenses applied on the devices, and the features available on the licenses. You can also view general details about the hardware components such as model, serial, and part numbers.
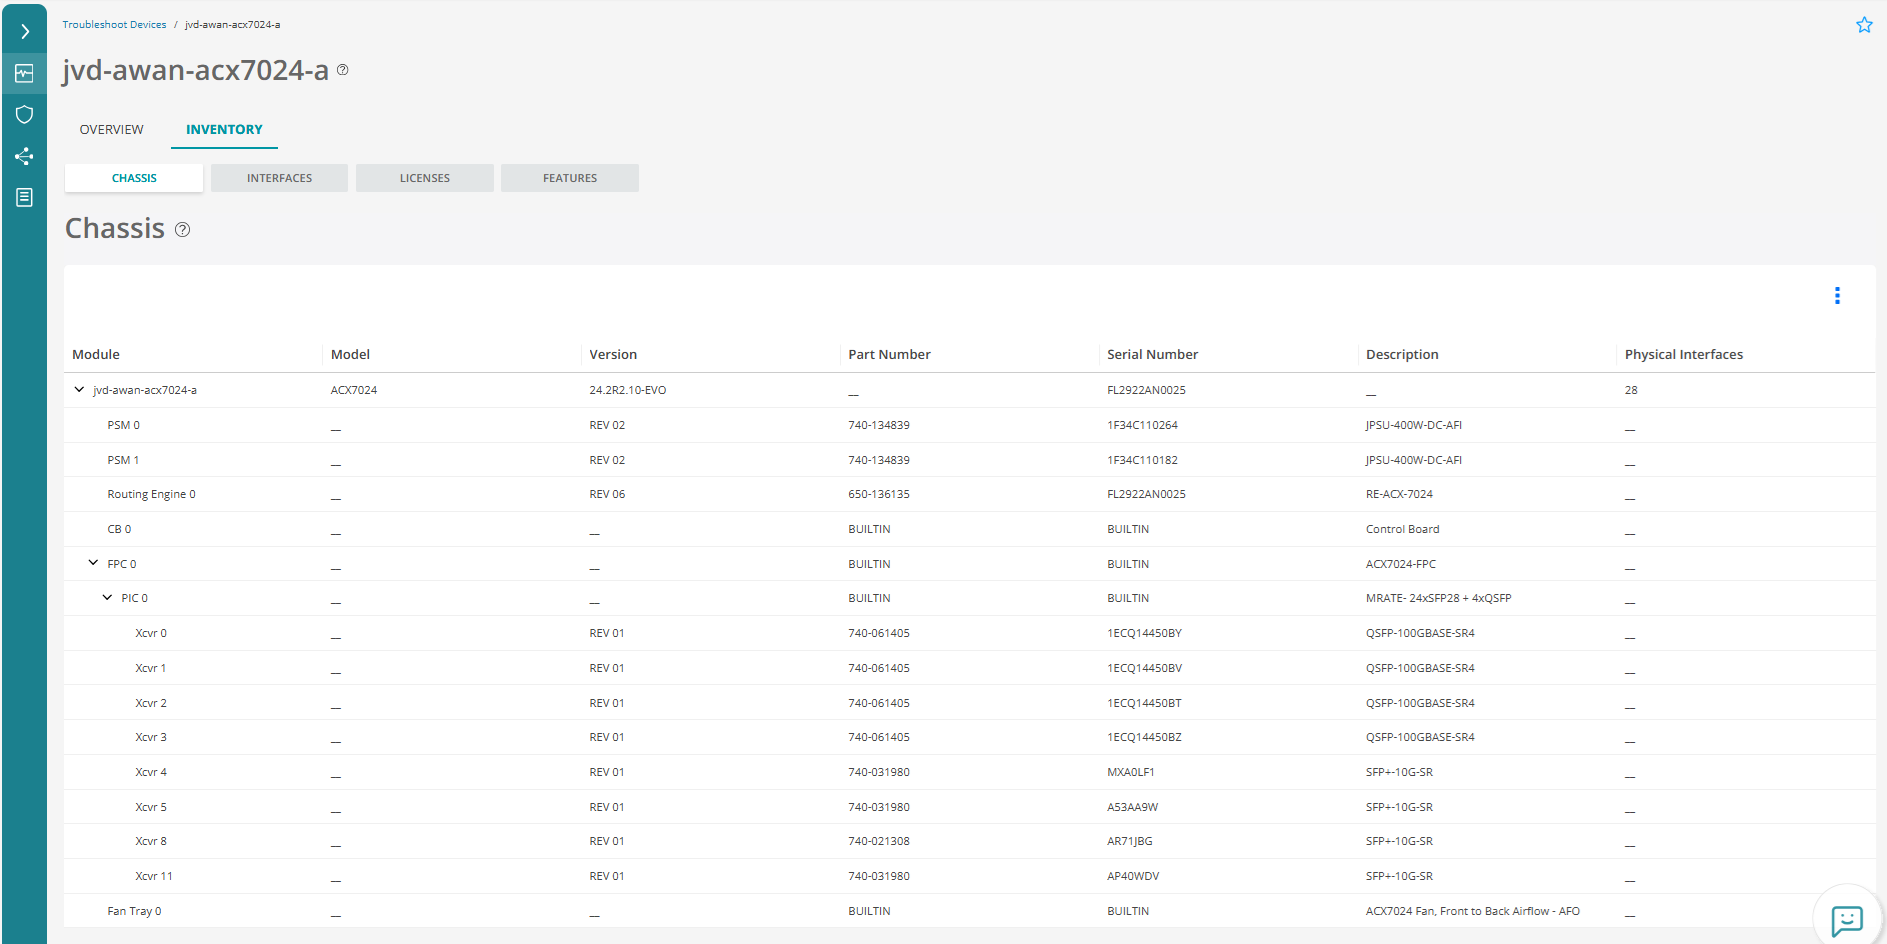
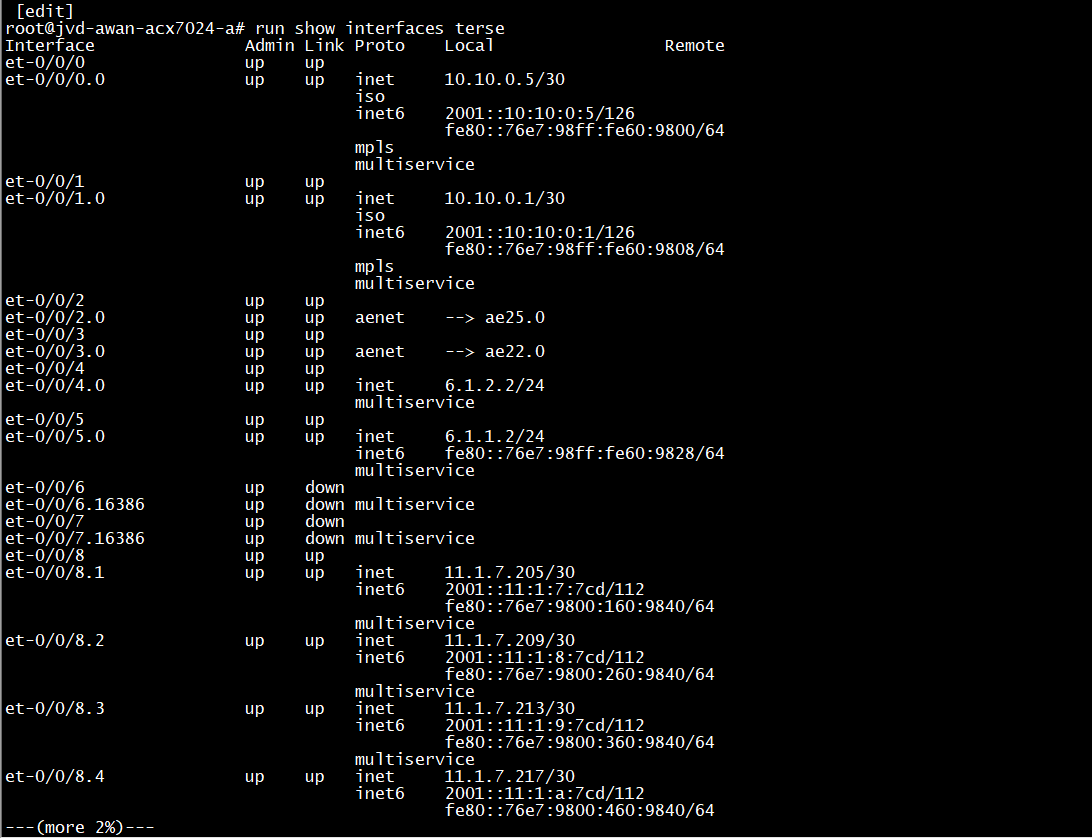
Figure 15 shows same information at the device CLI.
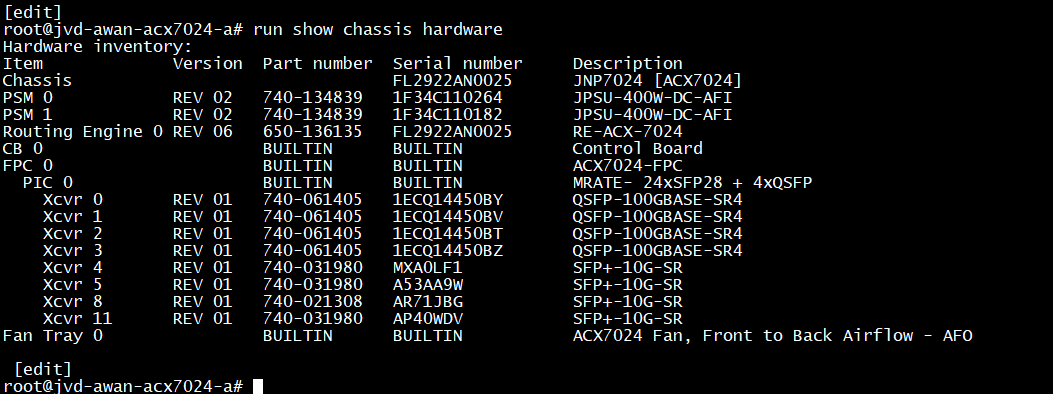
Figure 16 shows a list of the interfaces from the Paragon Automation GUI.
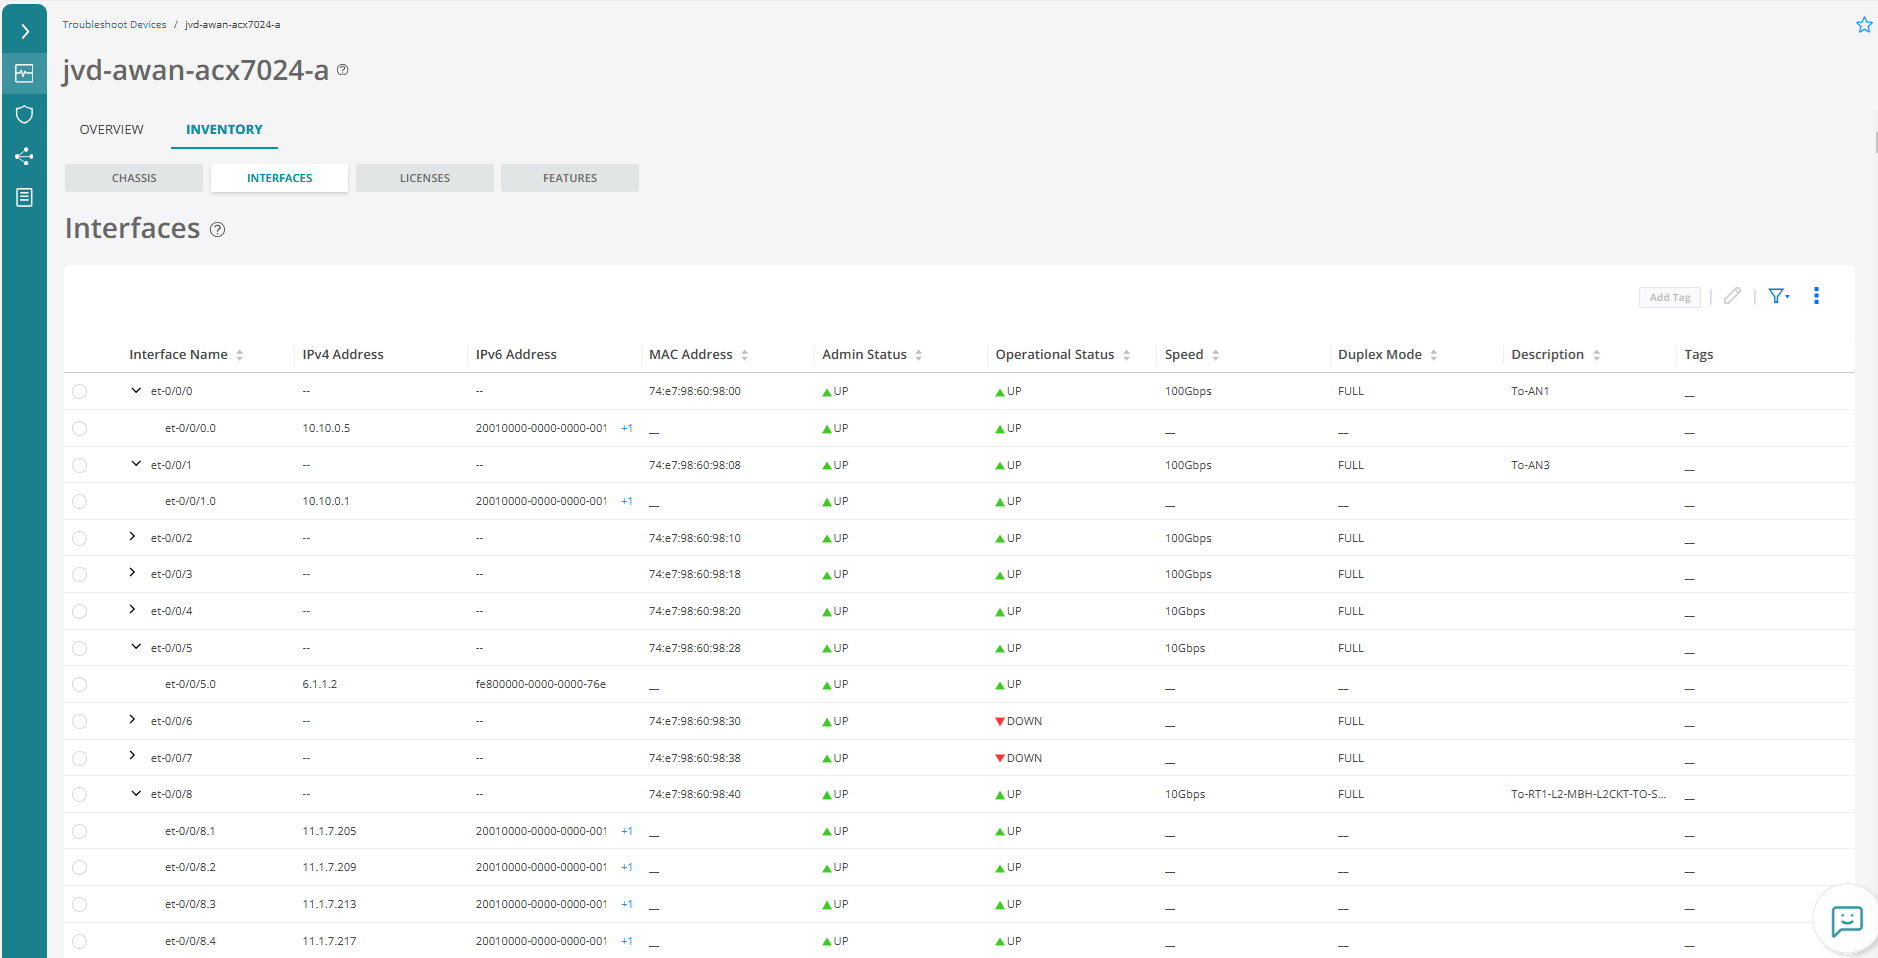
Figure 17 shows same information at the device CLI.
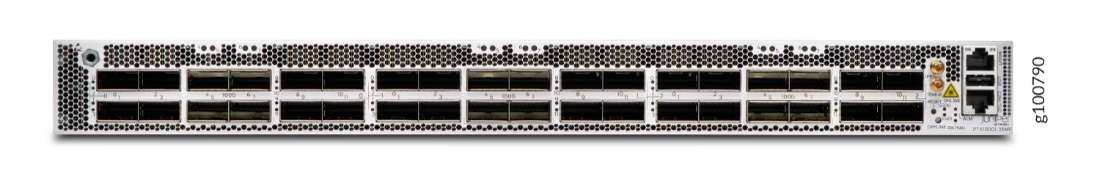
Test Bed
All the figures in this Test Bed section showcase each of the devices that are involved in our test lab (DUT). Each of these DUT underwent rigorous assessments to ensure their reliability and performance in various network conditions, not only for being part of the CoS LLQ JVD infrastructure, but also as being integrated with Paragon Automation.
Test Bed Configuration
Contact your Juniper representative to obtain the complete set of the test bed configuration used for this JVD. Additionally, you can find the configurations in the Juniper GitHub located in the Automation folder. This repository contains detailed configurations and scripts that were instrumental in achieving the test results presented in this section. By accessing these resources, users can replicate the test bed environment and gain a deeper understanding of the setup and methodologies employed.