Results Summary and Analysis
The following figures show different steps and results after execution of the test to validate solution proposed by the Automation JVD.
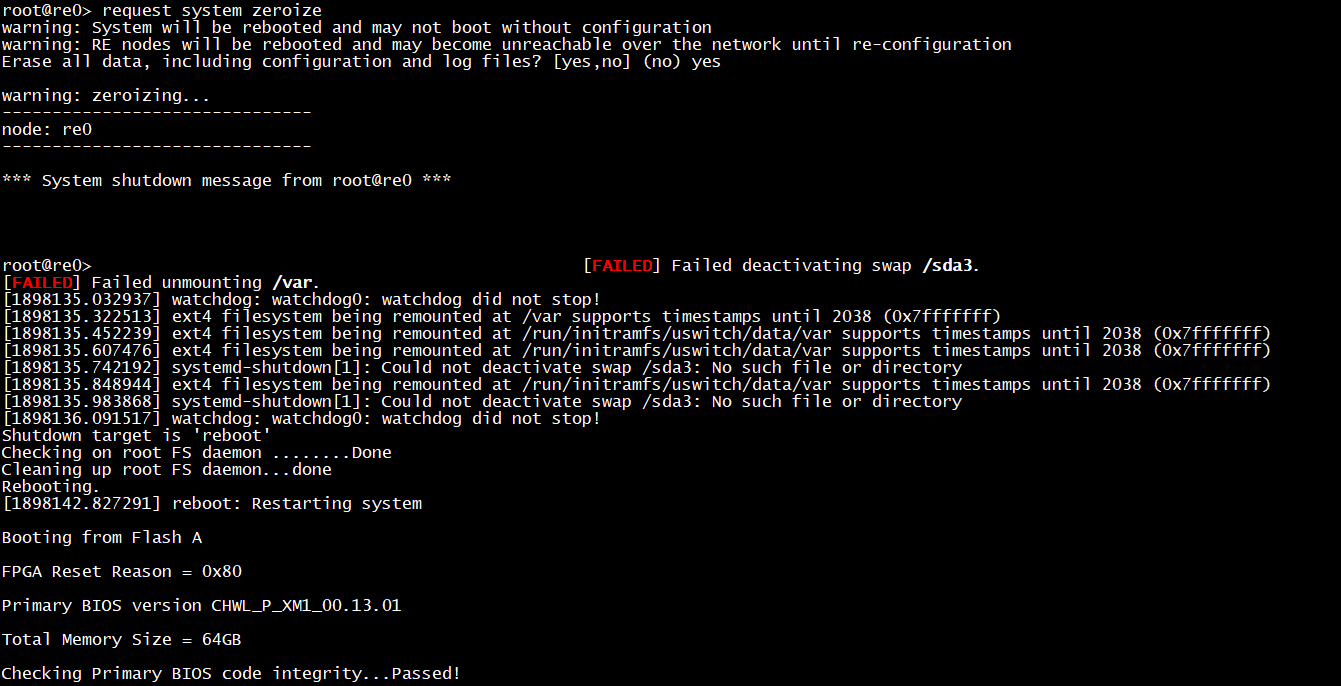
- Onboarding access nodes (AN) via ZTP. ZTP requires that the
device is in a factory default state. The device from the factory
default settings boots with preinstalled software and factory
default configuration. However, a device that does not have the
factory default configuration needs to issue the request system
zeroize command. This is exactly what is being simulated as in
the following figure.
Figure 1: AN Request System Zeroize
When executing the above command from the console, after a few seconds, the ztp.py script is triggered. It runs DHCP over few interfaces.
Figure 2: ZTP Script Executed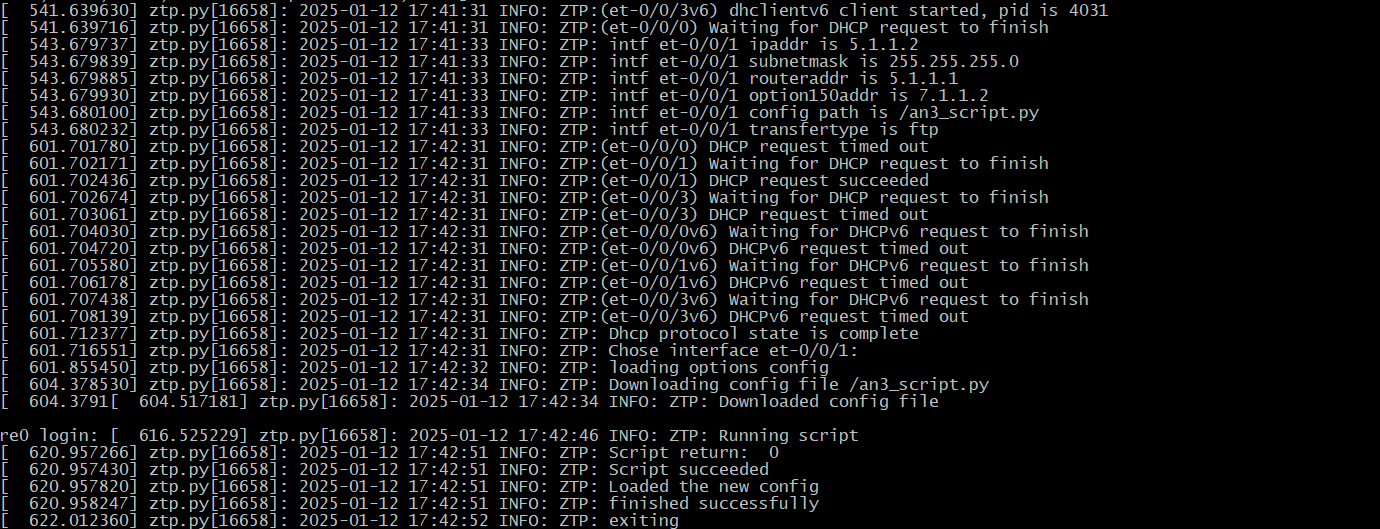
Paragon Automation commits configurations based on the different configuration templates defined in the device and interface profiles, and the network implementation plan on the device during device onboarding. However, at this phase, all configuration required (base config + service config) is provided via configuration files when ZTP. They have all the information required by the device to initiate the outbound SSH connection to Paragon and trigger the onboarding process. After that, only a configuration template is used to load and commit the configuration related to the services.
Figure 3: Access Node Device in Onboarding Status at Paragon Automation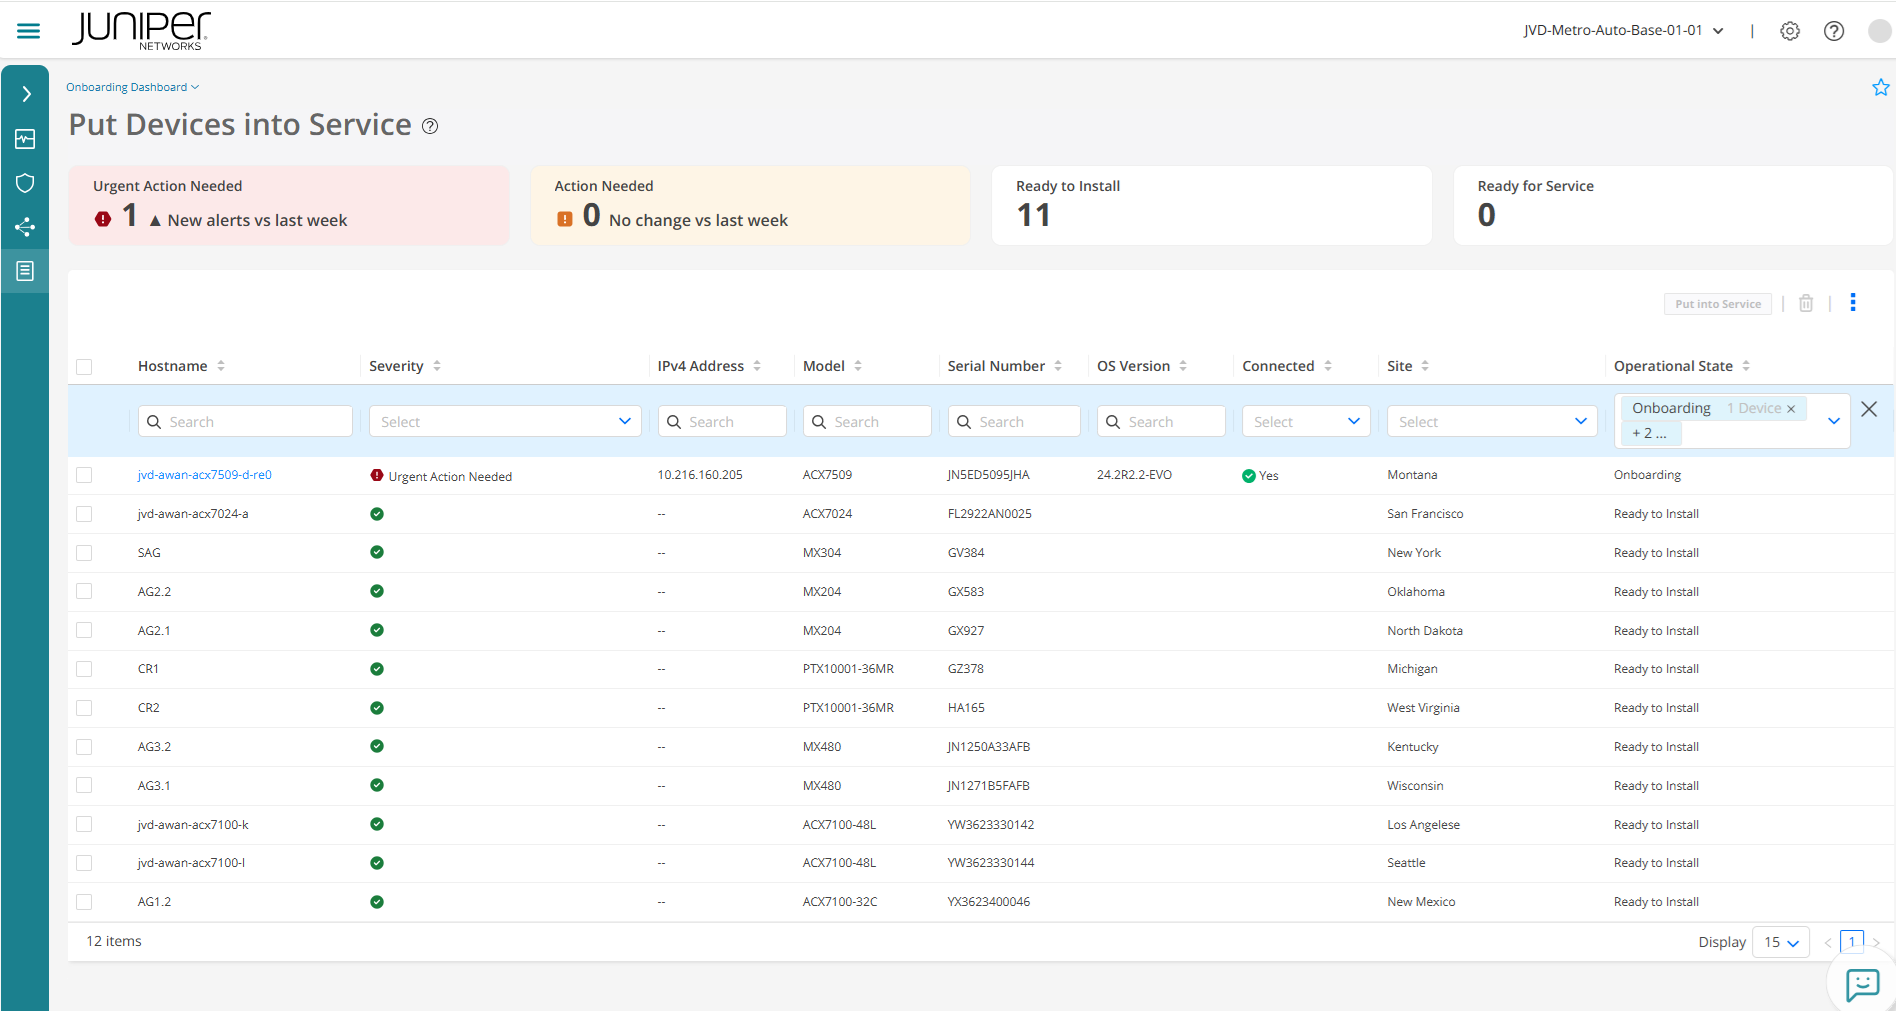
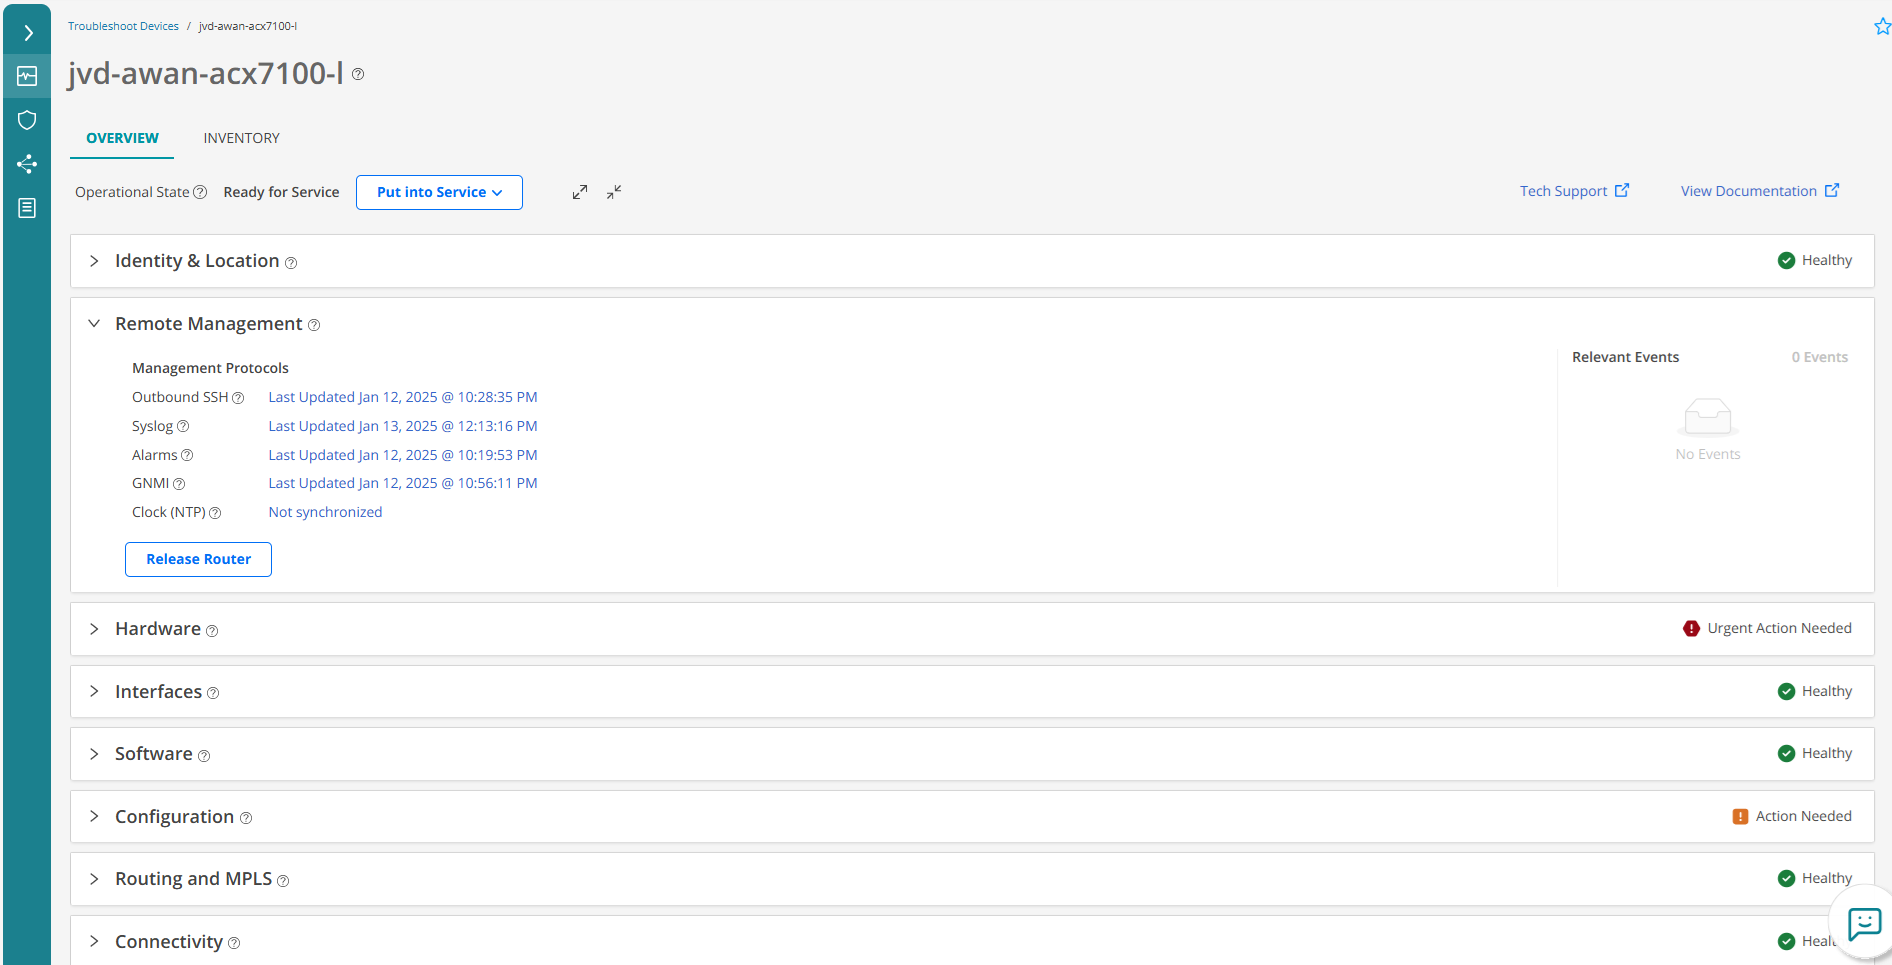
After onboarding, devices are managed by Paragon and are in operational state, ‘Ready for Service’ as shown in the following figure:
Figure 4: All Devices in “Ready for Service” Operational State.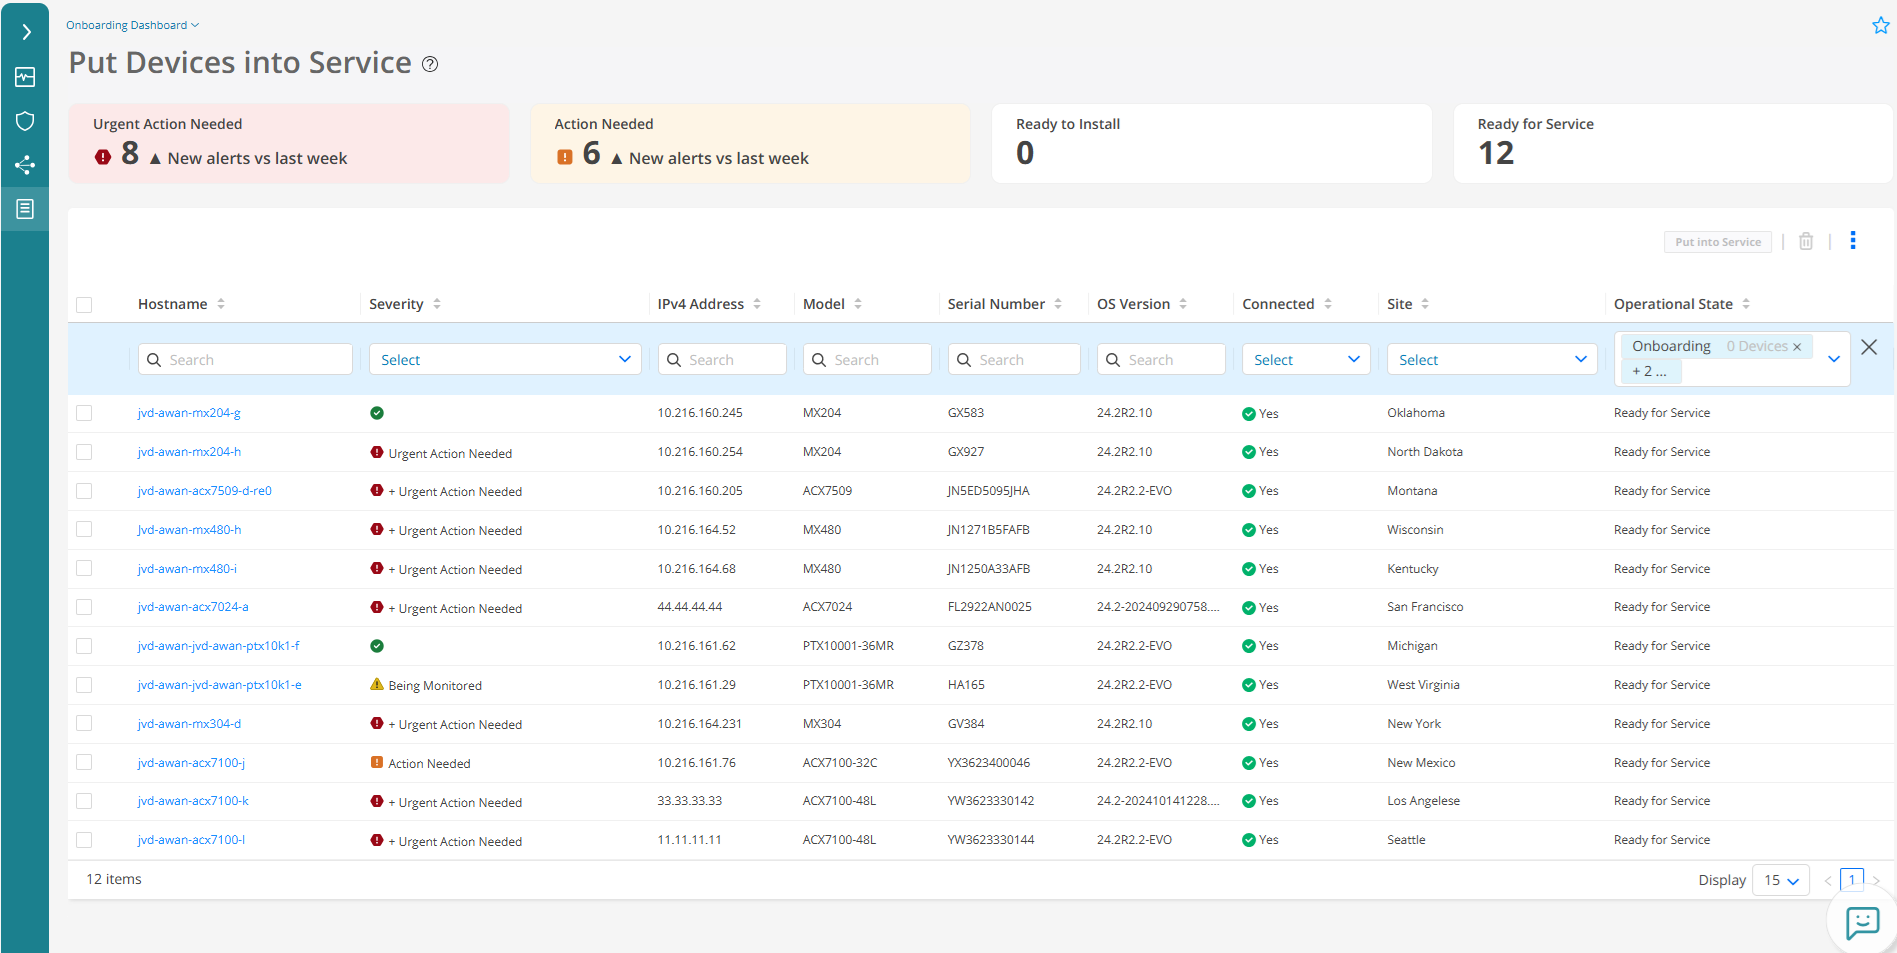
-
Network management traffic QoS: Based on current default configuration, all packets
sourced from router control plane (Routing Engine) are placed by default in the network
control
forwarding class (FC-CONTROL). This ensures in the case of network congestion
management traffic is given forwarding priority over other forwarding classes. It is not the
purpose of this JVD to test any specific QoS scheduler configuration for management traffic
(FC-CONTROL) as this can be any arbitrary configuration that suits network requirements. You
can rely on default configuration present on JUNOS system for most of the management traffic
types. Any specific user configuration is not changing overall solution behavior. For
packets traversing (transit traffic) AG nodes that carry telemetry information (gNMI),
special firewall filter is added to direct these packets to Forwarding Class (FC-CONTROL).
This is to make sure that all telemetry packets from Devices have the same QoS treatment as
other network control traffic. Figure 5: Network Management Traffic Configuration
[edit]
regress@jvd-awan-acx7100-j# show | display set | grep MF_Inband_PA_Traffic
set interfaces et-0/0/24:2 unit 0 family inet filter input MF_Inband_PA_Traffic
set interfaces et-0/0/26:0 unit 0 family inet filter input MF_Inband_PA_Traffic
set interfaces et-0/0/26:1 unit 0 family inet filter input MF_Inband_PA_Traffic
set firewall family inet filter MF_Inband_PA_Traffic interface-specific
set firewall family inet filter MF_Inband_PA_Traffic term 1 from protocol tcp
set firewall family inet filter MF_Inband_PA_Traffic term 1 from destination-port 32767
set firewall family inet filter MF_Inband_PA_Traffic term 1 then count gnmi_count
set firewall family inet filter MF_Inband_PA_Traffic term 1 then forwarding-class FC-CONTROL
set firewall family inet filter MF_Inband_PA_Traffic term 1 then accept
set firewall family inet filter MF_Inband_PA_Traffic term 2 from protocol tcp
set firewall family inet filter MF_Inband_PA_Traffic term 2 from destination-port 2200
set firewall family inet filter MF_Inband_PA_Traffic term 2 then count oc_count
set firewall family inet filter MF_Inband_PA_Traffic term 2 then forwarding-class FC-CONTROL
set firewall family inet filter MF_Inband_PA_Traffic term 2 then accept
set firewall family inet filter MF_Inband_PA_Traffic term 3 then count def_count
set firewall family inet filter MF_Inband_PA_Traffic term 3 then accept

[edit]
regress@jvd-awan-acx7100-j#
- Paragon Automation can communicate with DUT using different
interfaces (SSH/CLI, gNMI, NETCONF/YANG).
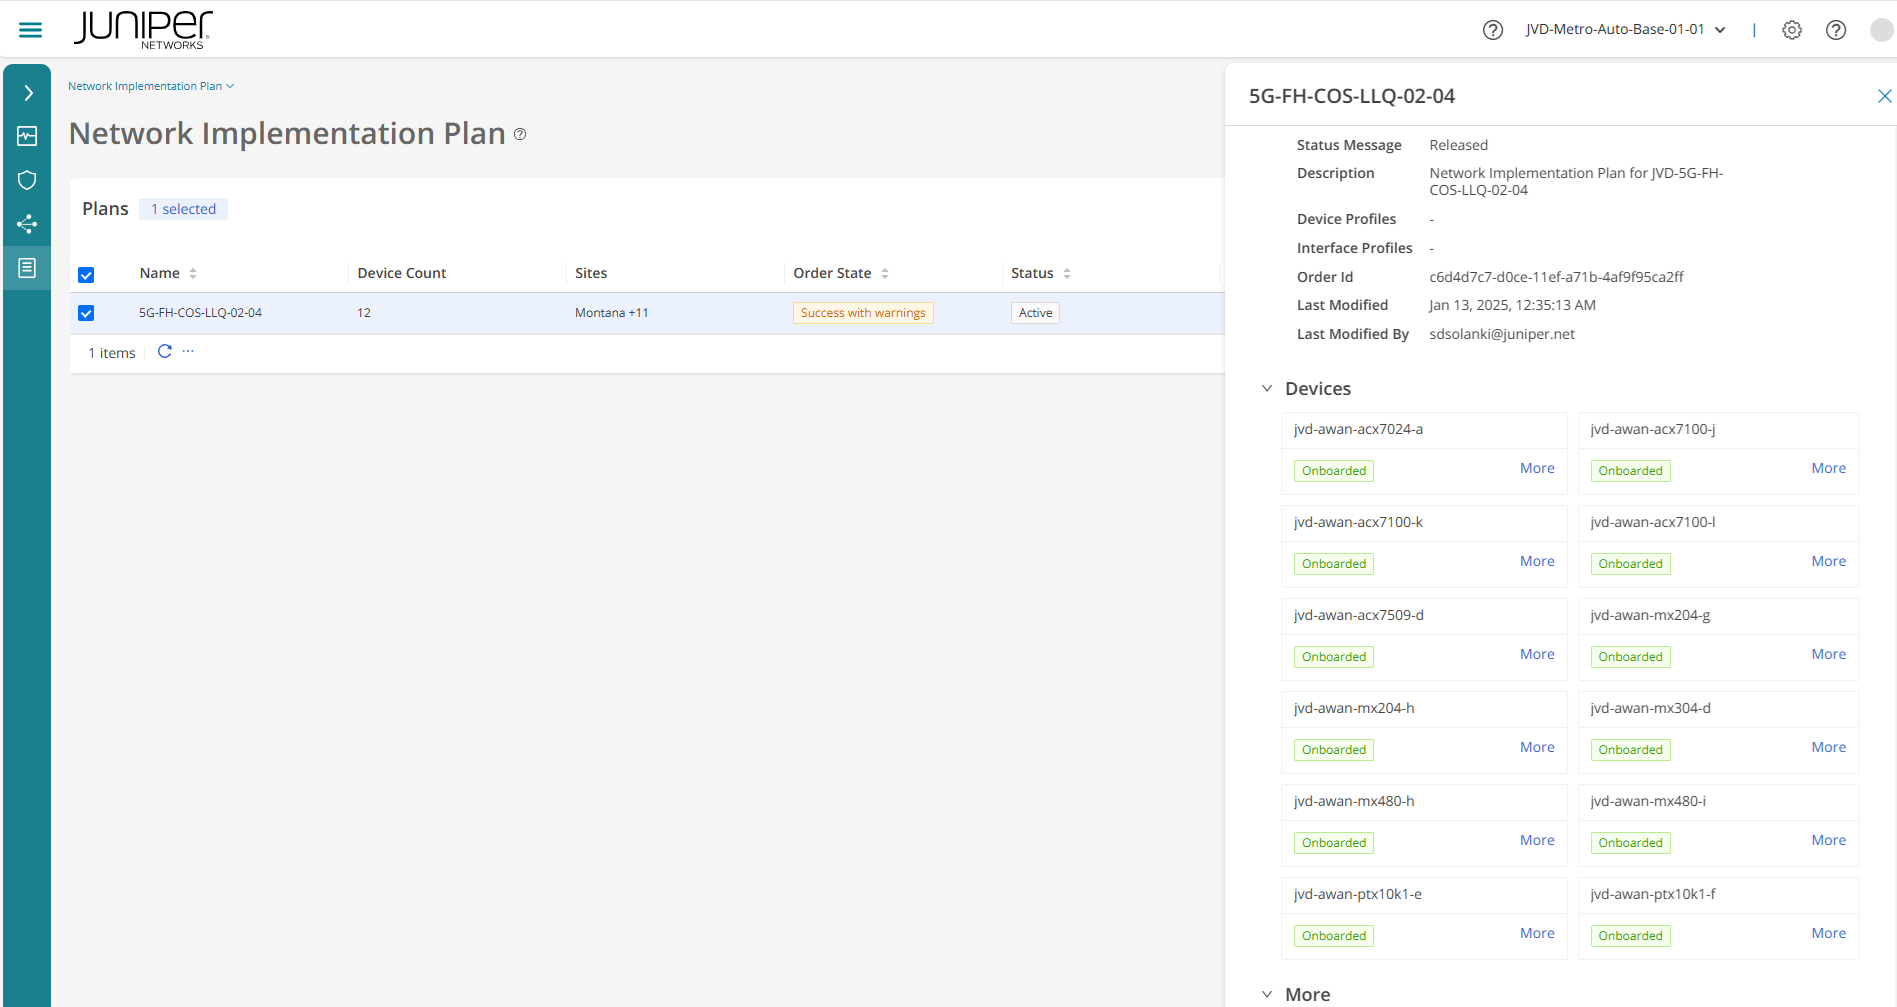
Figure 6: Paragon Inventory with Device Successfully Onboarded
- Paragon Automation has an updated inventory of all devices
onboard.
Figure 7: Paragon Inventory with Device Successfully Onboarded
- Paragon Automation manages the lifecycle of the devices. For
example, software upgrades/downgrades, configuration
backup/restore, configuration template provisioning and so on.
Figure 8 shows how to back up the configuration of a device from Paragon Automation GUI.
Figure 8: Configuration Backup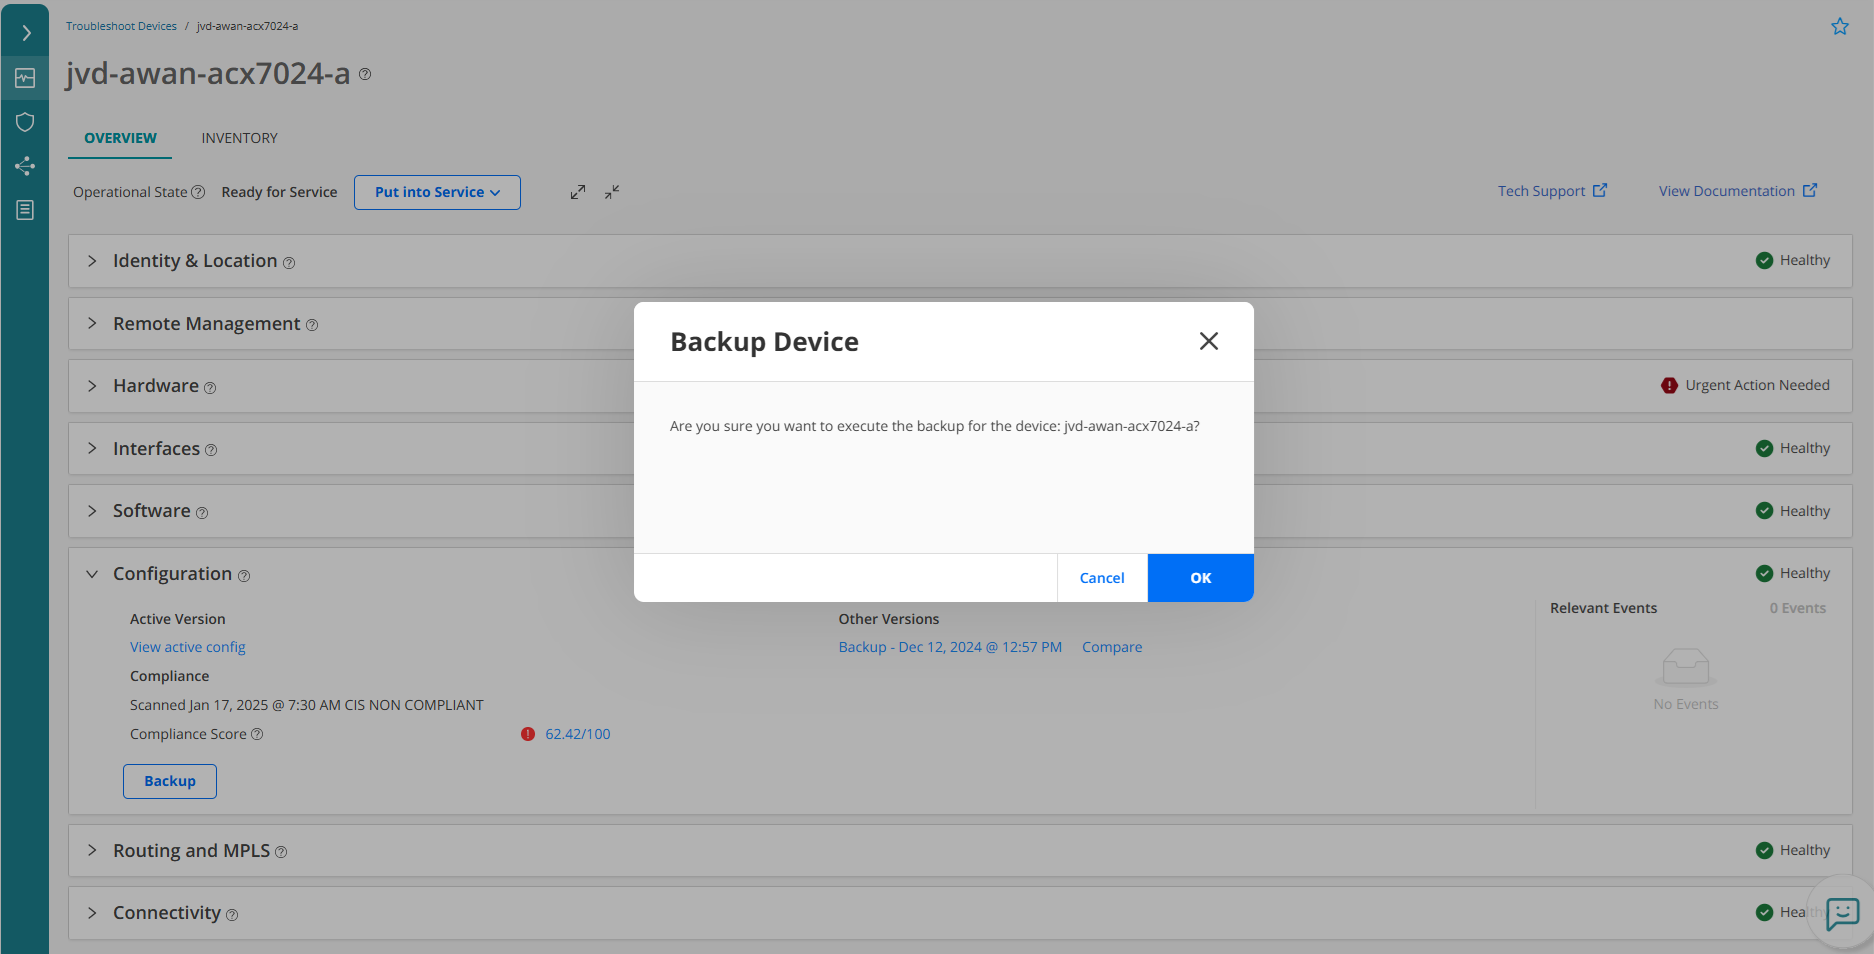
Figure 9 shows a list of configuration files that are backed up and their details.
Figure 9: Configuration Restored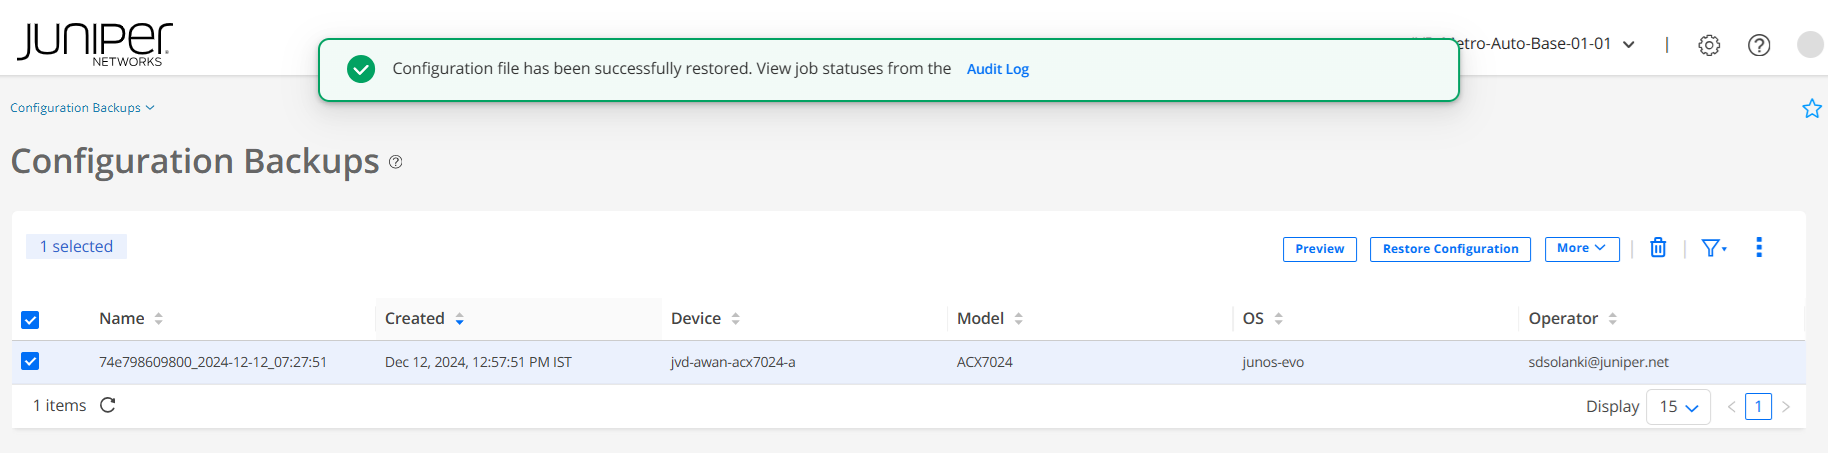
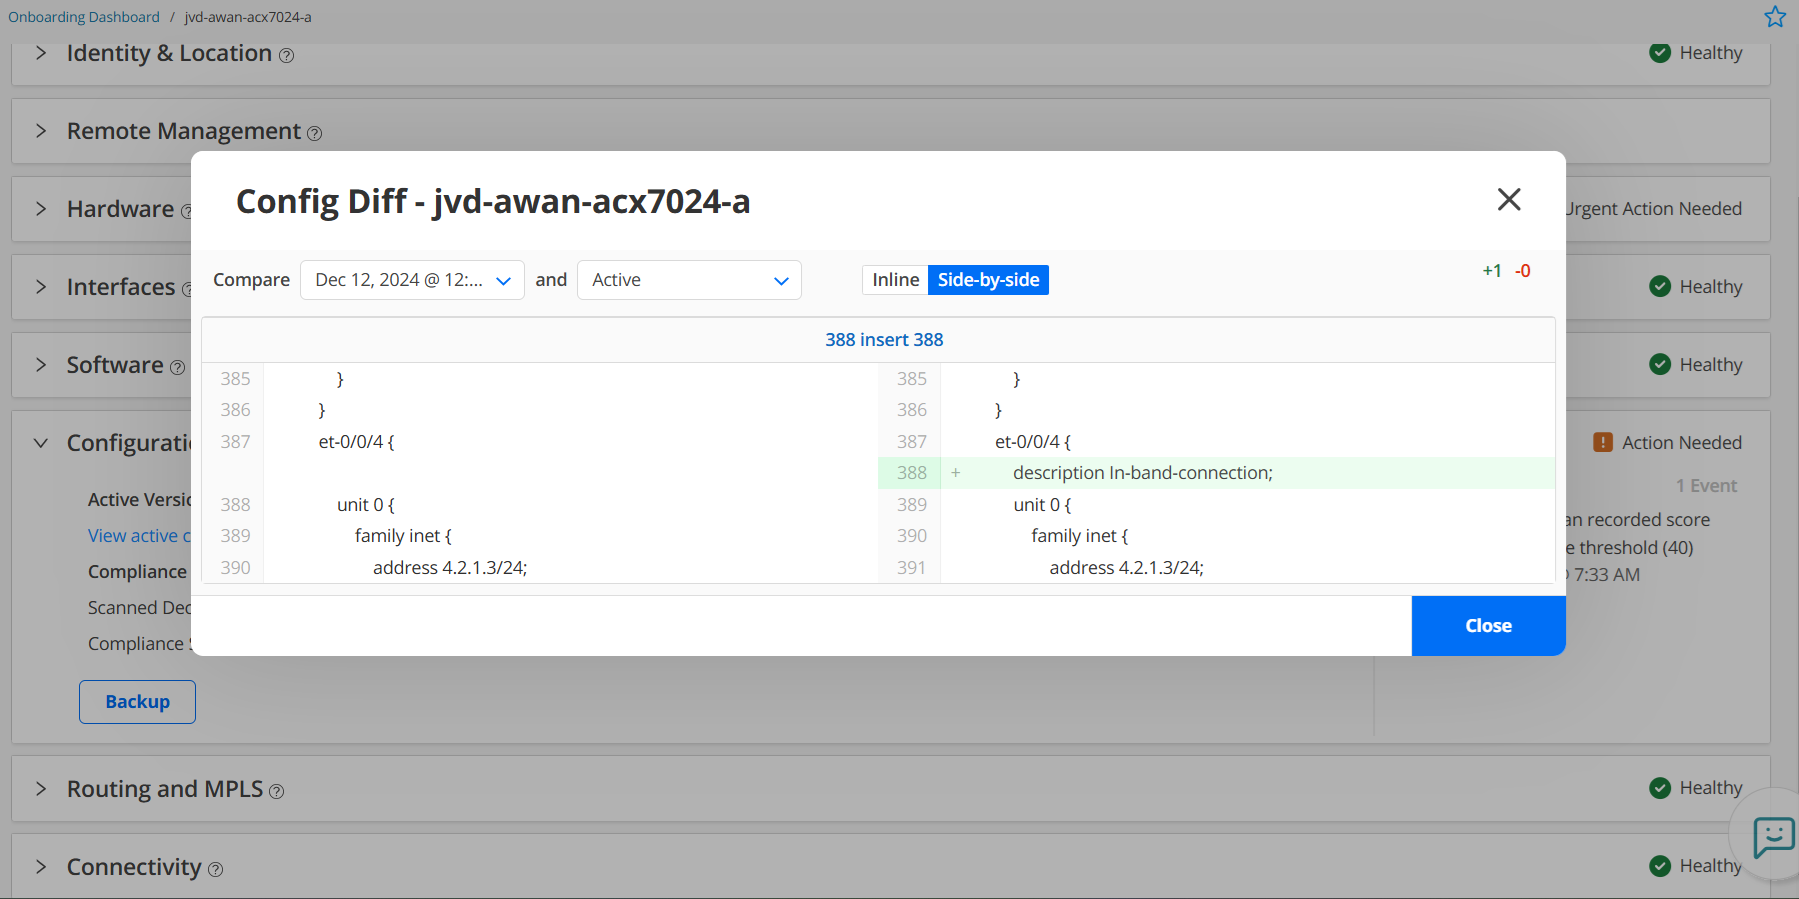
- Using Paragon Automation GUI, you can compare configuration as
shown in
Figure 10
.
Figure 10: Difference of Backup and Active Configuration
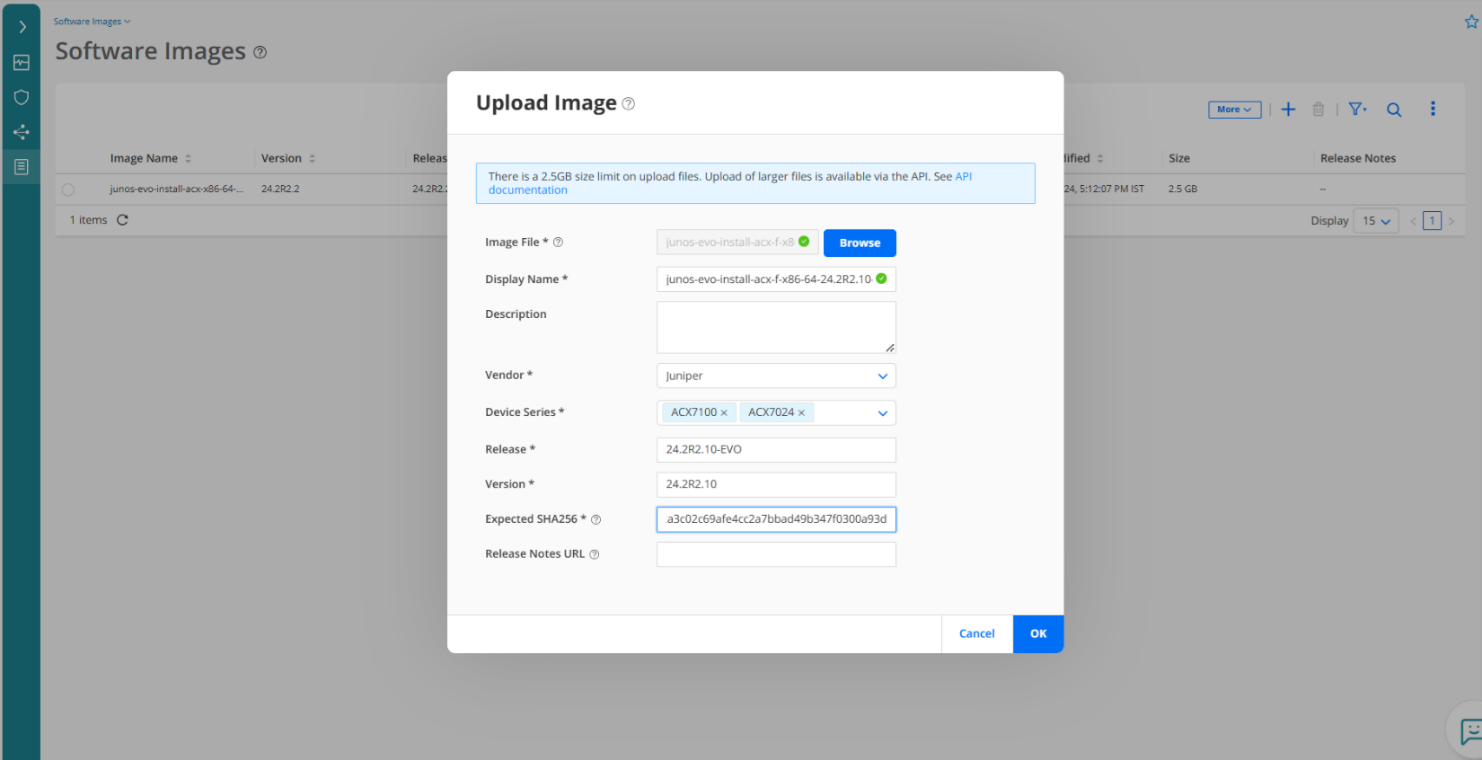
- Using Paragon Automation GUI, you can upload software images
from your local system. To upload files larger than 2.5 GB, use the
Upload Image REST API, instead of the GUI. In the
Paragon
Automation User Guide
, there is a
sample script (see "Sample Script" on page 315) that you can use to
upload a software image using Upload Image REST API.
Figure 11: Software Upgrade/Downgrade
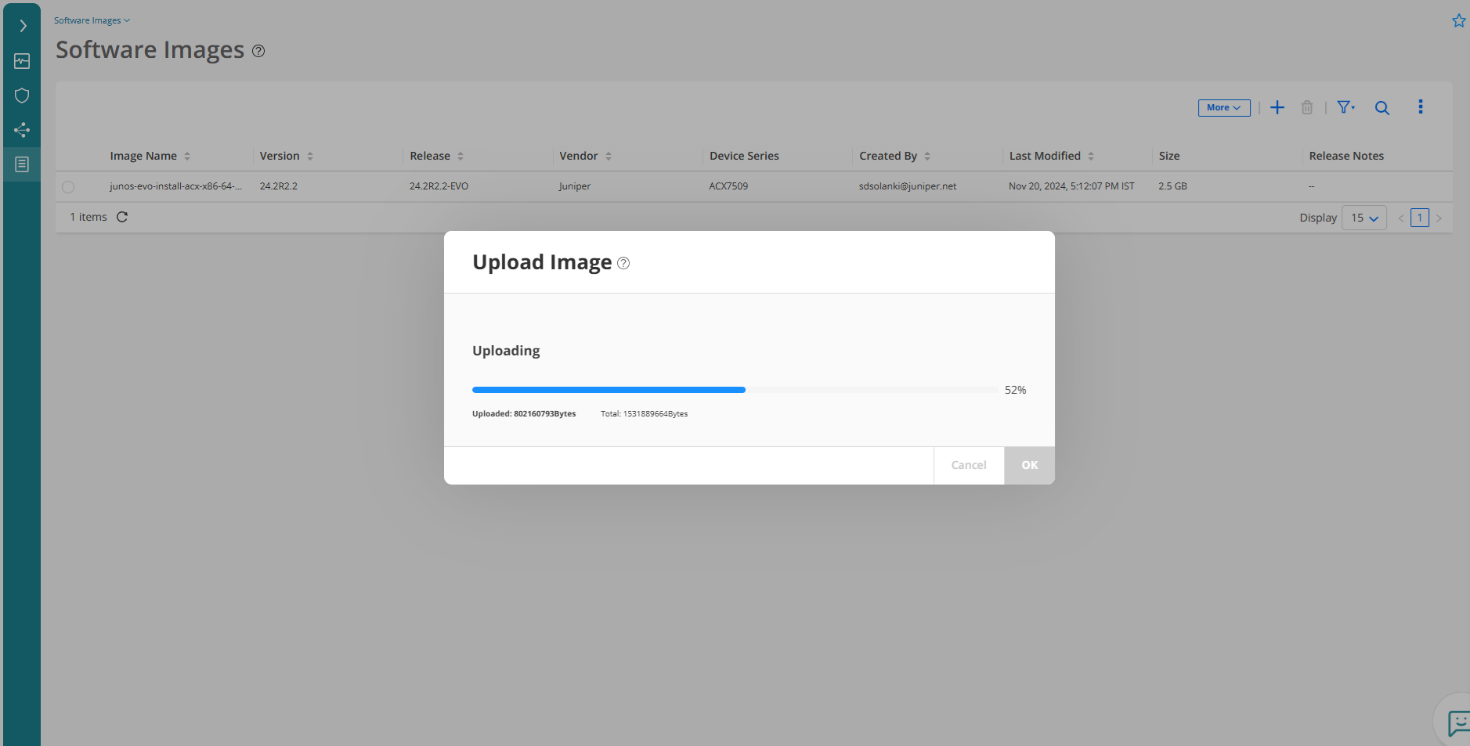
-
Figure 12
shows
progress of the software image being uploaded.
Figure 12: Software Upgrade/Downgrade
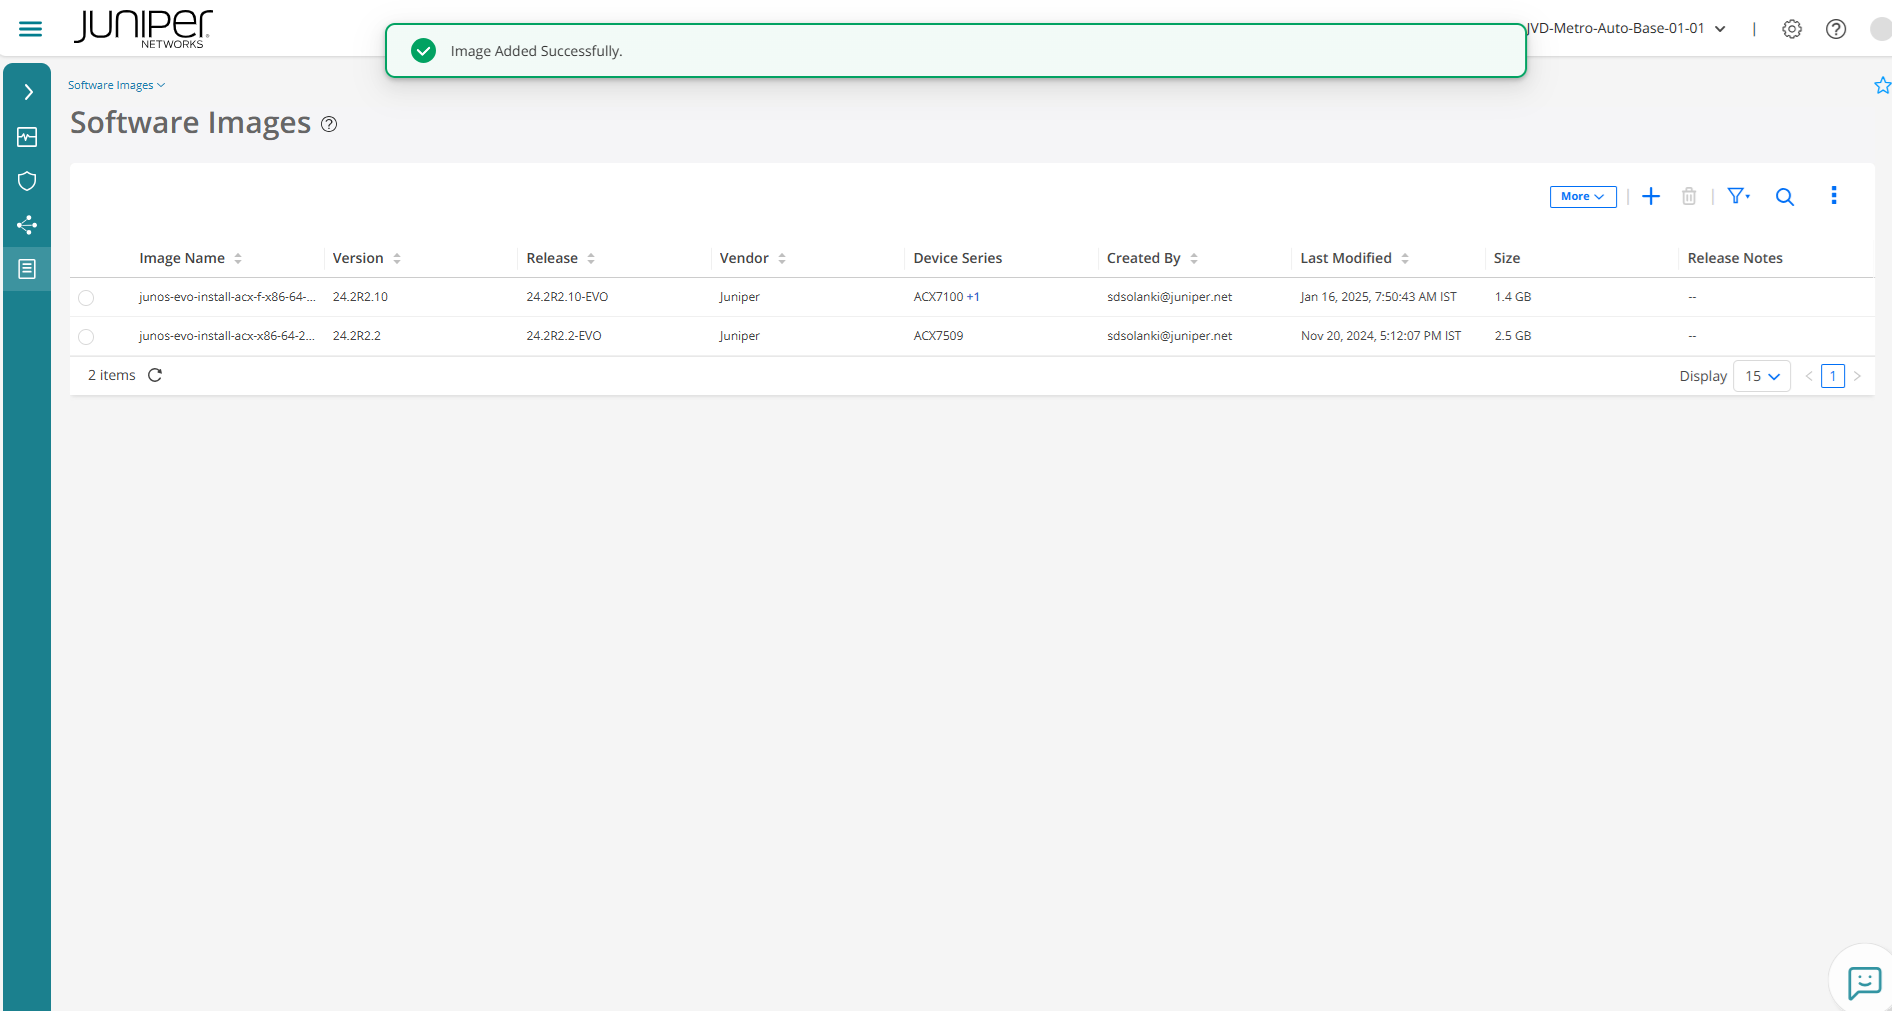
- Once the image is uploaded, you can see the image details such
as image name, version, release number, device family, image size,
and the release notes link.
Figure 13: Software Upgrade/Downgrade
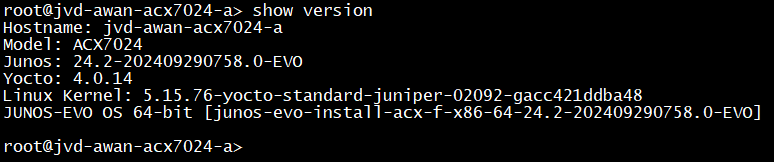
- To test a software image upgrade, you can see a device running
a software version before the upgrade. For example. Junos
24.2-201409290758.0-EVO.
Figure 14: Software Upgrade/Downgrade
That device is selected to be upgraded from the GUI:
Figure 15: Software Upgrade/Downgrade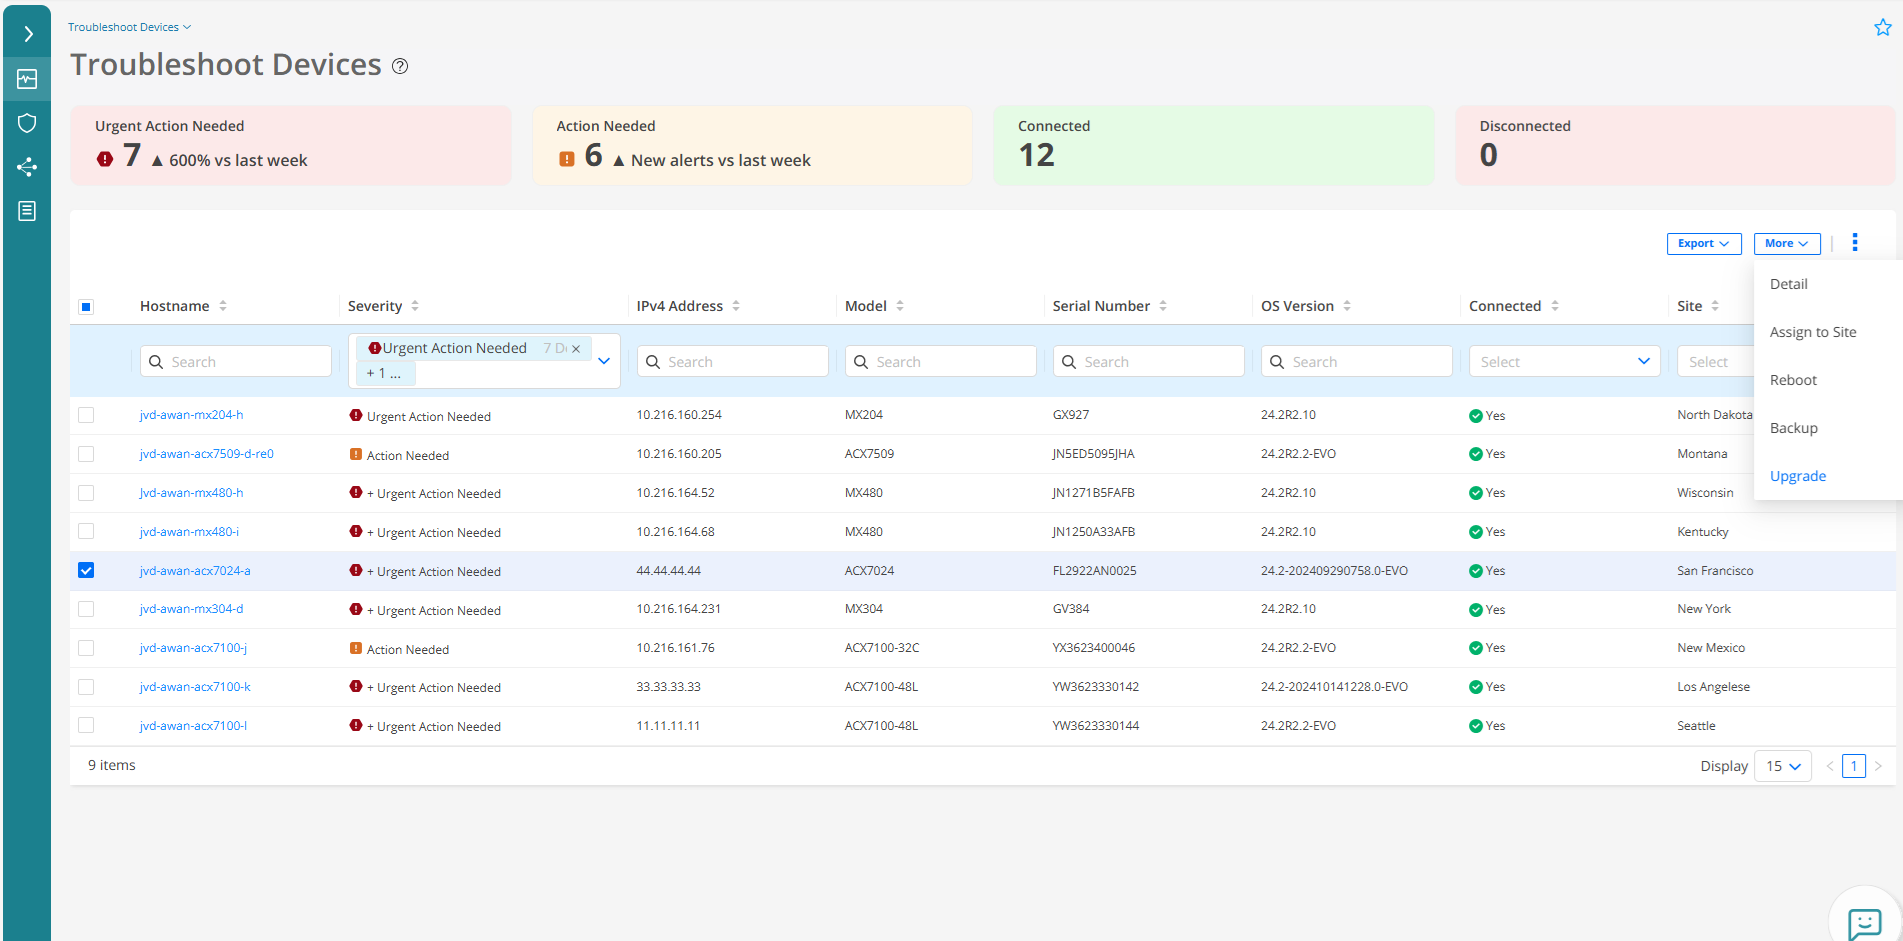
The software upgrade process starts as it can be seen from its console.
Figure 16: Software Upgrade/Downgrade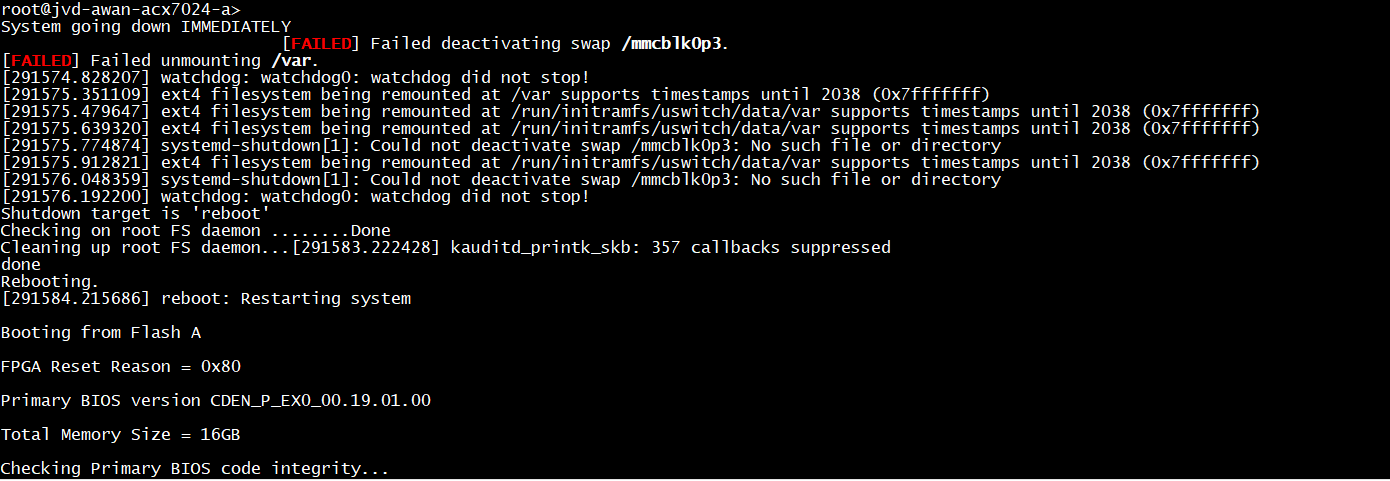 Figure 17: Software Upgrade/Downgrade
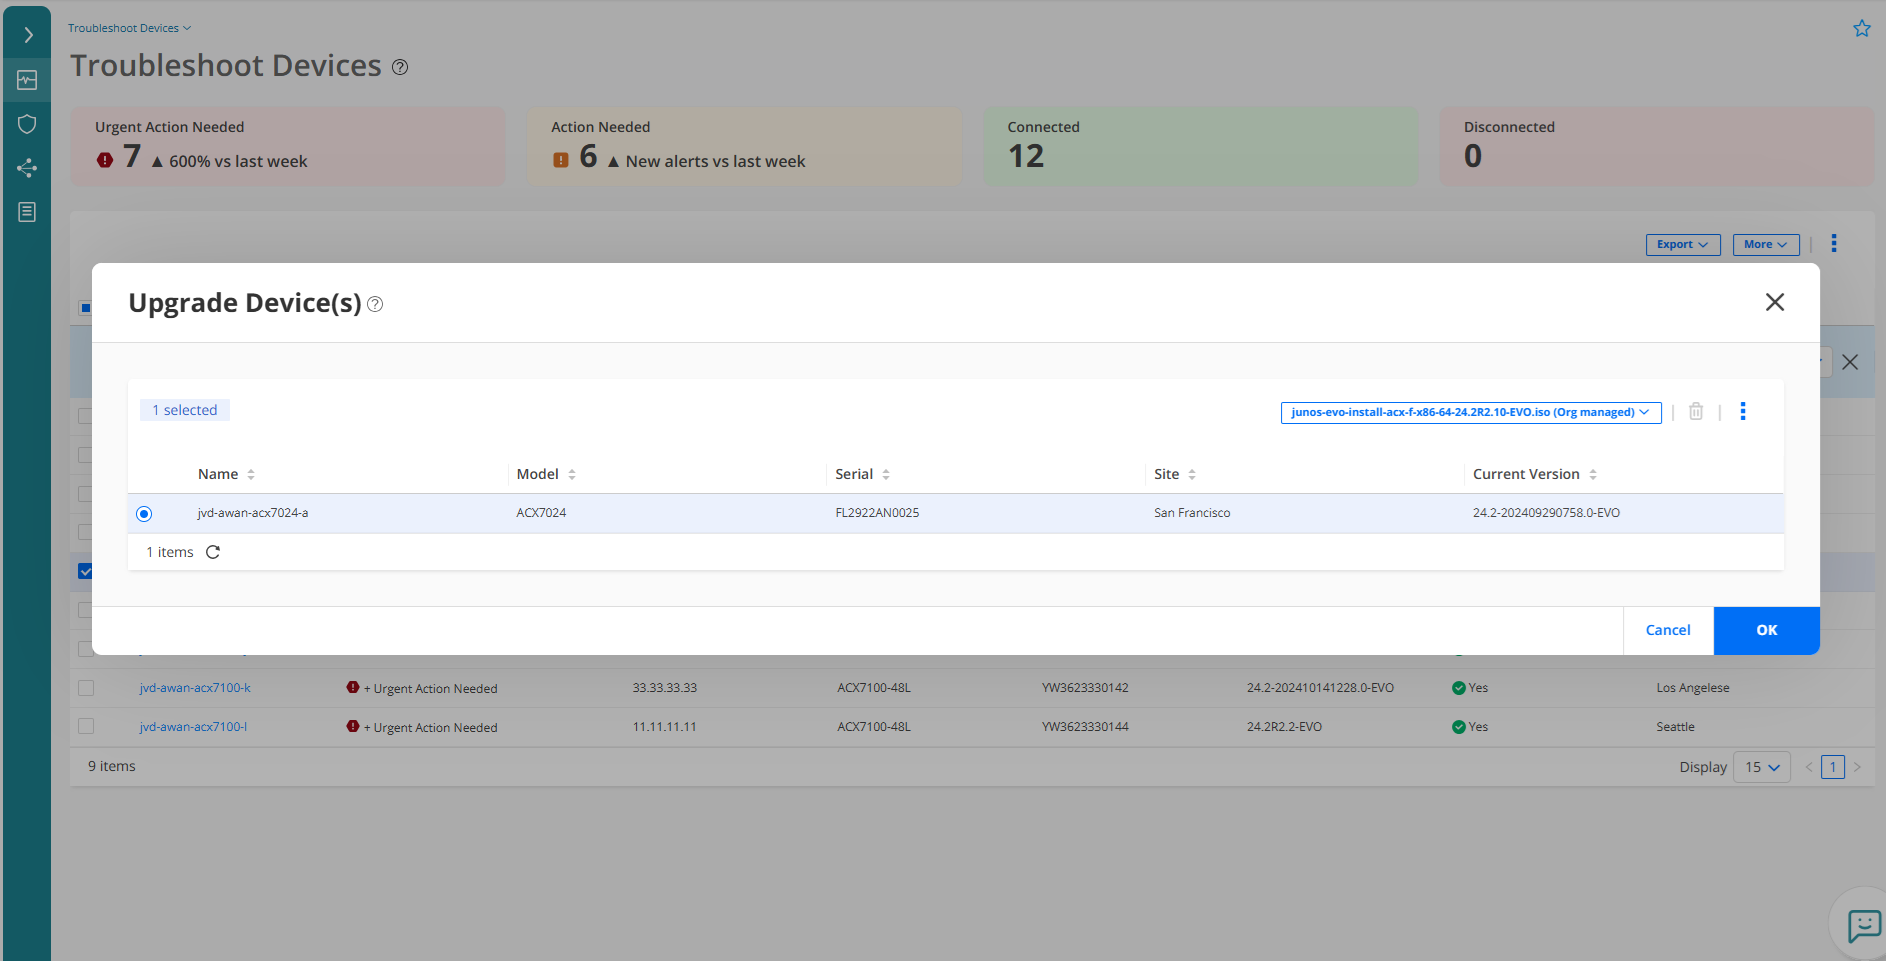
The device has been successfully upgraded to the new release. For example, Junos 24.2R2.10-EVO.
Figure 18: Software Upgrade/Downgrade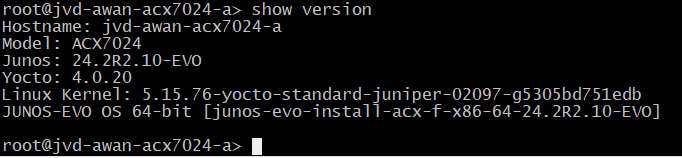
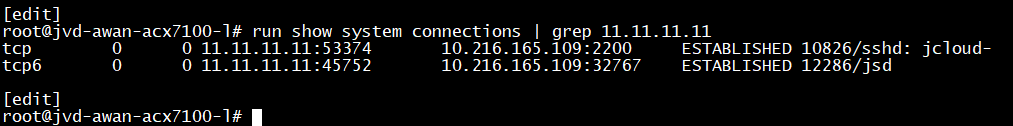
- DUT stream telemetry to Paragon Automation. In the following
screenshot a connection to gRPC Network Management Interface port
is shown.
Figure 19: Paragon Inventory with Device Successfully Onboarded
- Paragon Automation collects telemetry from DUT. It uses telemetry obtained from the
network devices, network, and network services to monitor and understand what is happening
across the network (in this initial phase only from network devices. Nothing related to
network or service level). Paragon Automation then detects and helps resolve real-time
issues to keep the network and its components healthy, delivering an easily sustainable
high-quality experience for network operators. Observability is a critical use case of
Paragon Automation.
The current solution focuses on receiving limited telemetry, since configuration applied to the devices is not created by Paragon Automation but provisioned via configuration files automatically. That means, the network and service-related telemetry is not being configured on the devices to be streamed. Therefore, only device level (hardware components) is received.
Figure 20: Paragon Inventory with Device Successfully Onboarded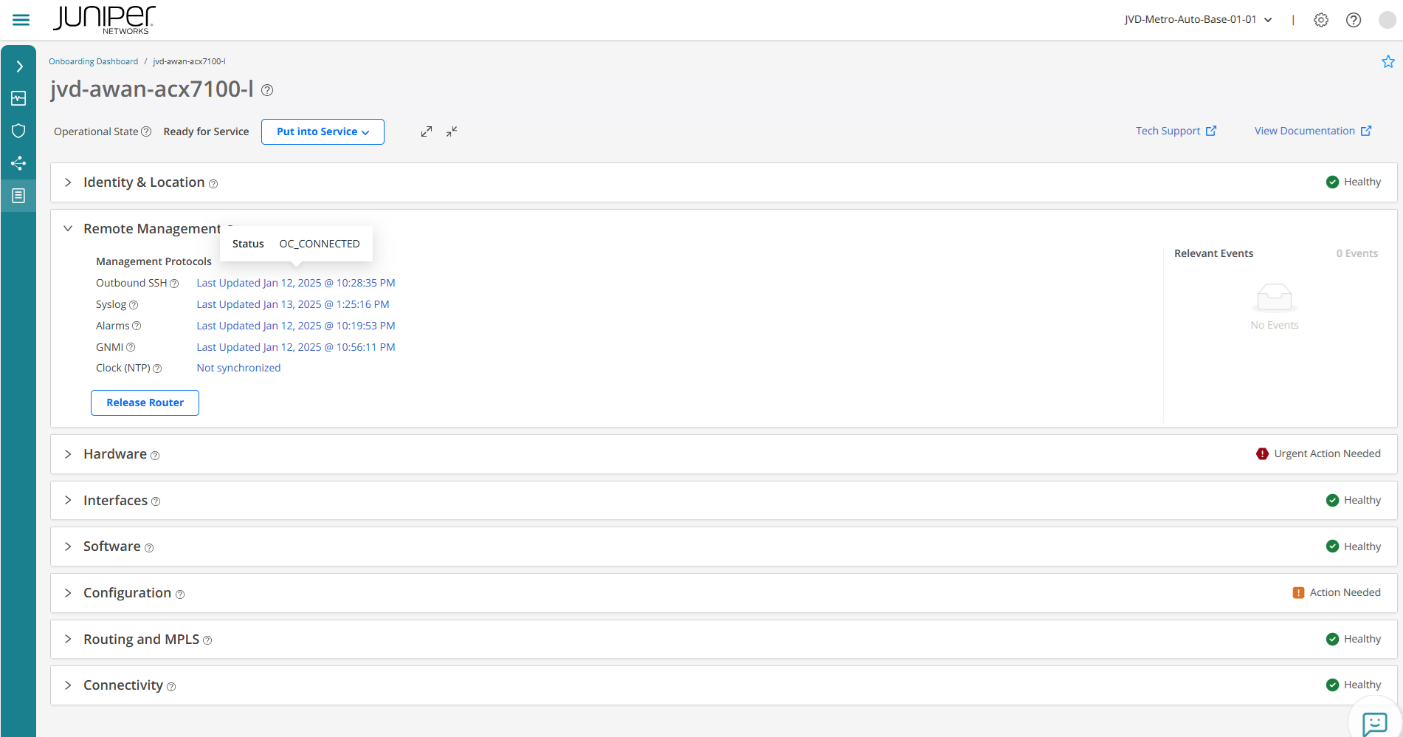
Paragon Automation displays hardware telemetry received from DUT at device level:
Figure 21: Paragon Inventory with Device Successfully Onboarded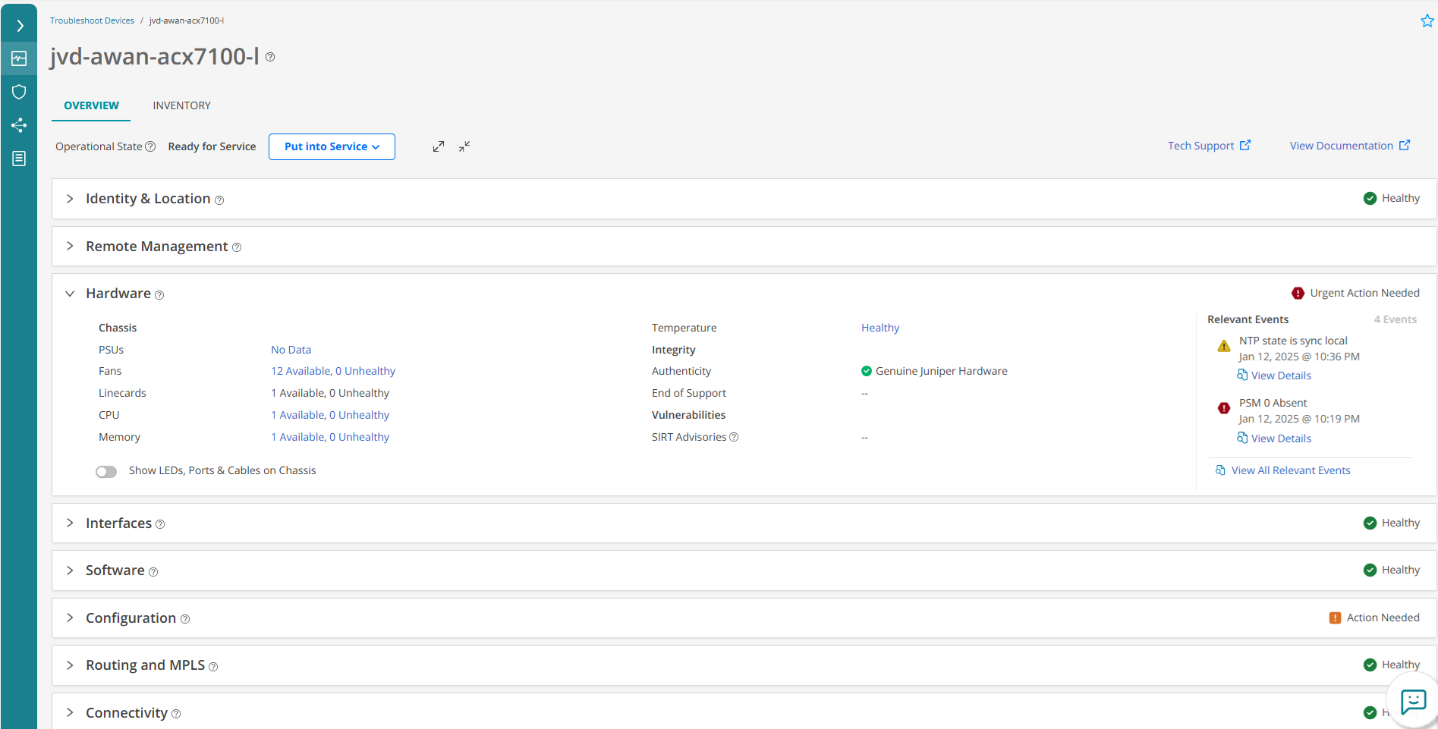
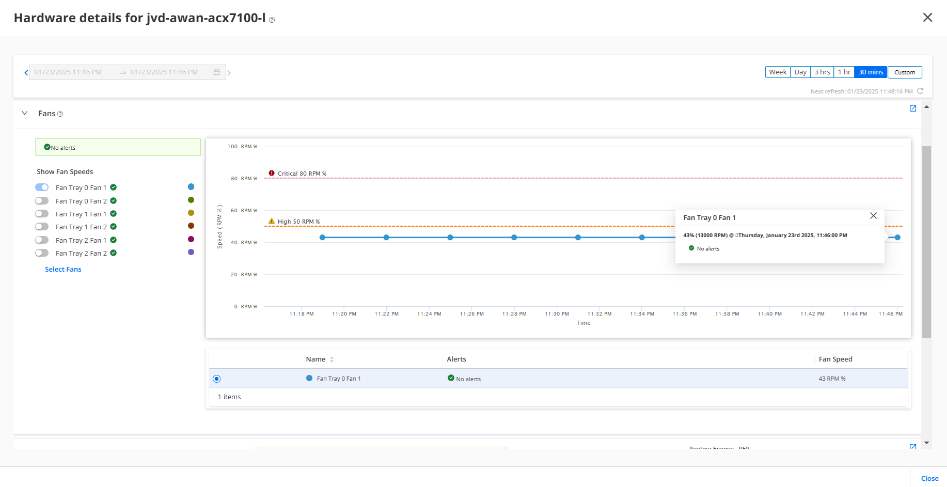
From this CLI output, a few KPIs related to DUT hardware can be seen.
Figure 22: DUT CLI Related to CPU, Memory, and Temperature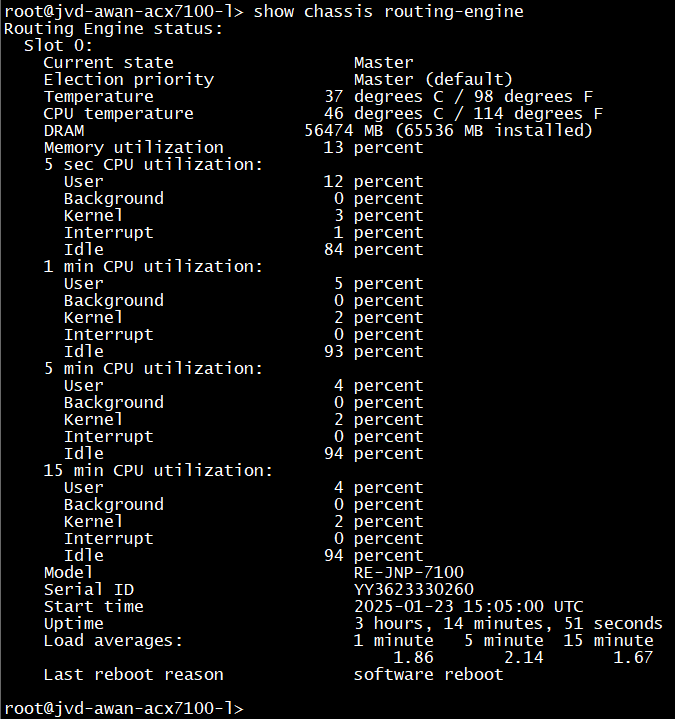
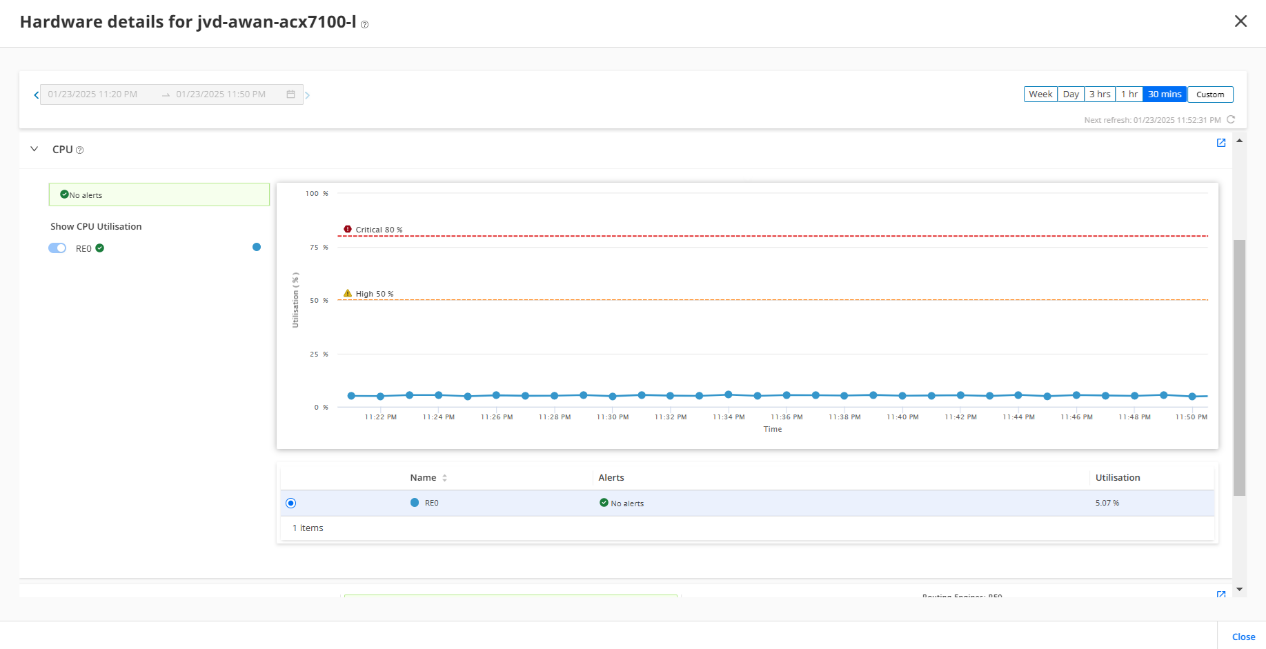
- CPUFigure 23: Paragon Displaying Telemetry Received from DUT CPU Utilization
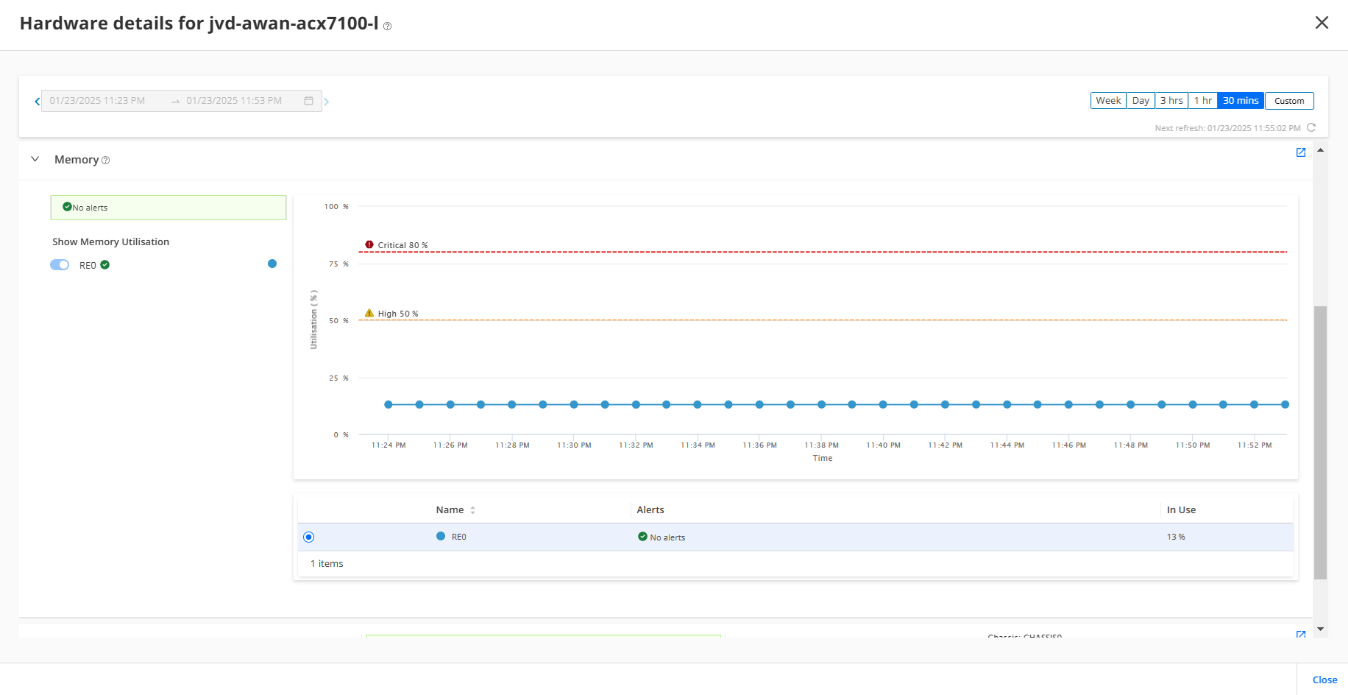
- MemoryFigure 24: Paragon Displaying Telemetry Received from DUT Memory Utilization
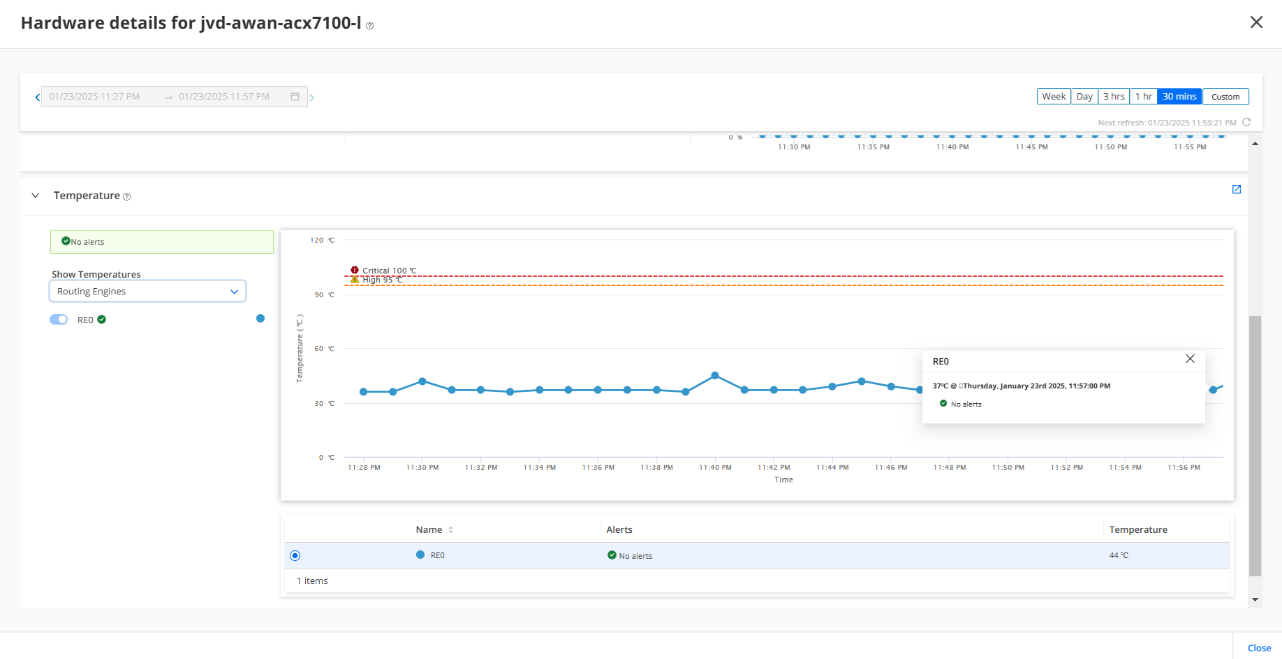
- TemperatureFigure 25: Paragon Displaying Telemetry Received from DUT CPU Temperature
- FansFigure 26: DUT Fans Utilization
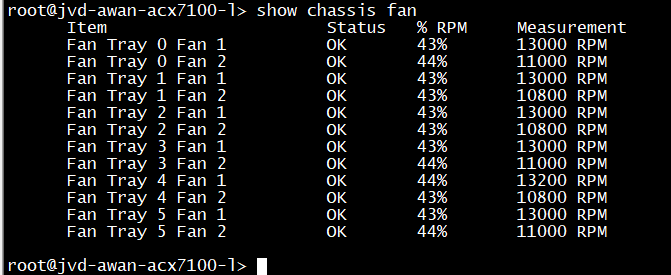
-
Figure 27: Paragon Displaying Telemetry Received from DUT Fans Utilization
- CPU
- Telemetry is in-band and classified as network control traffic. Since telemetry is being
streamed from RE, it is considered as NC traffic as it can be seen on the counters of the
firewall filter configured in the AG nodes. For example, MF_Inband_PA_Traffic. Figure 28: Telemetry Configuration
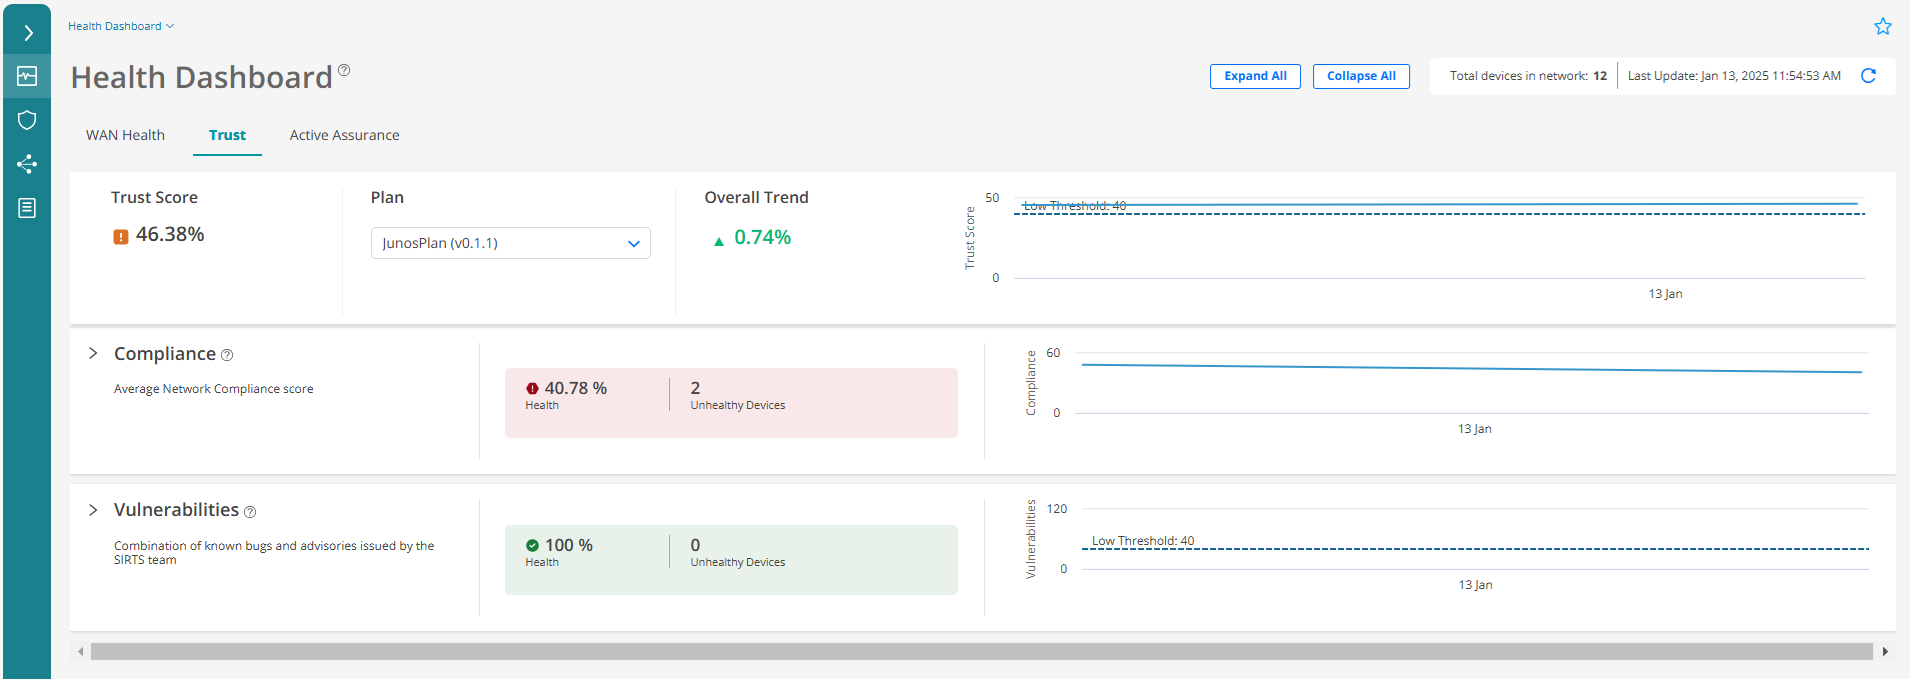
- Paragon Automation displays information about network trustworthiness.Figure 29: Paragon Trust at Health Dashboard
These results underscore the effectiveness of network automation and use of Paragon Automation solution.