Appendix: Paragon UI Implementation for Automation JVD
This appendix outlines the steps and procedures for using the Paragon UI to onboard devices, collect statistics on network nodes, and present configuration and operational states. Each step and expected outcome are documented based on the validation workflow conducted for this JVD.
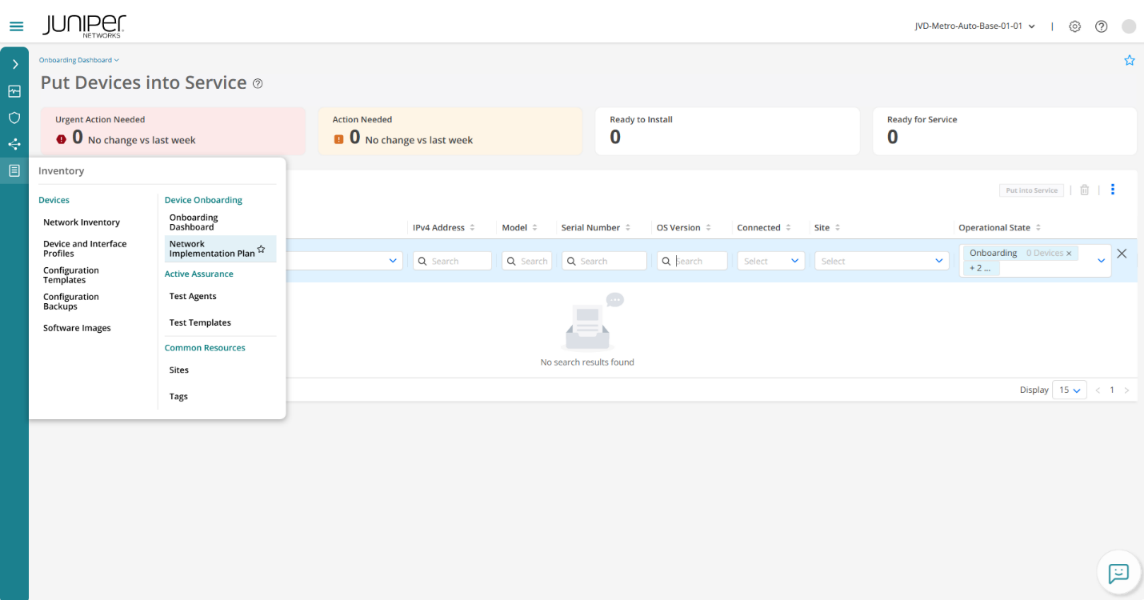
To onboard devices in Paragon Automation GUI, you need to follow a series of steps that involve creating sites, configuration templates, device profiles, network implementation plans, and configuring onboarding commands and service configurations. Let’s see them one by one:
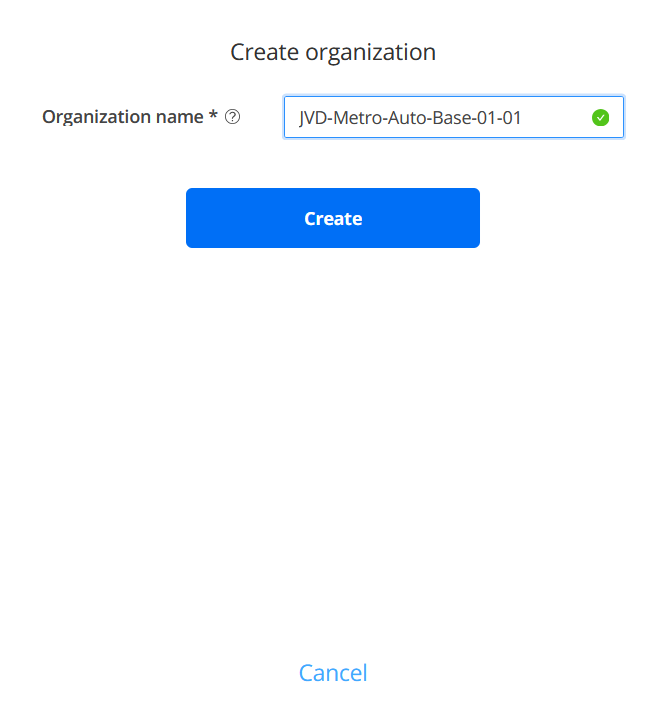
Create Organization
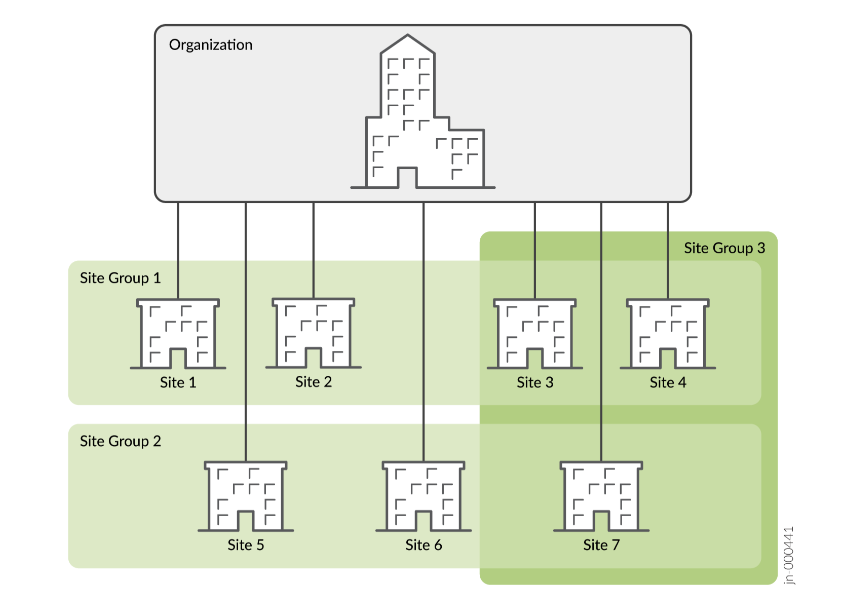
In Paragon Automation, an organization represents a customer. An organization can have multiple sites representing the locations where routers, switches, and firewalls are installed. While a site can have more than one device, a device can be associated with only one site. To apply Life-Cycle Management (LCM) functions on a device, it must be assigned to a specific site. Sites can be grouped based on regions, functions, or other parameters for efficient management of the devices.
An organization can be added from the New Account page when logging in as a superuser or from the organization list (next to the Help icon) on the top right-corner of the Paragon Automation GUI.

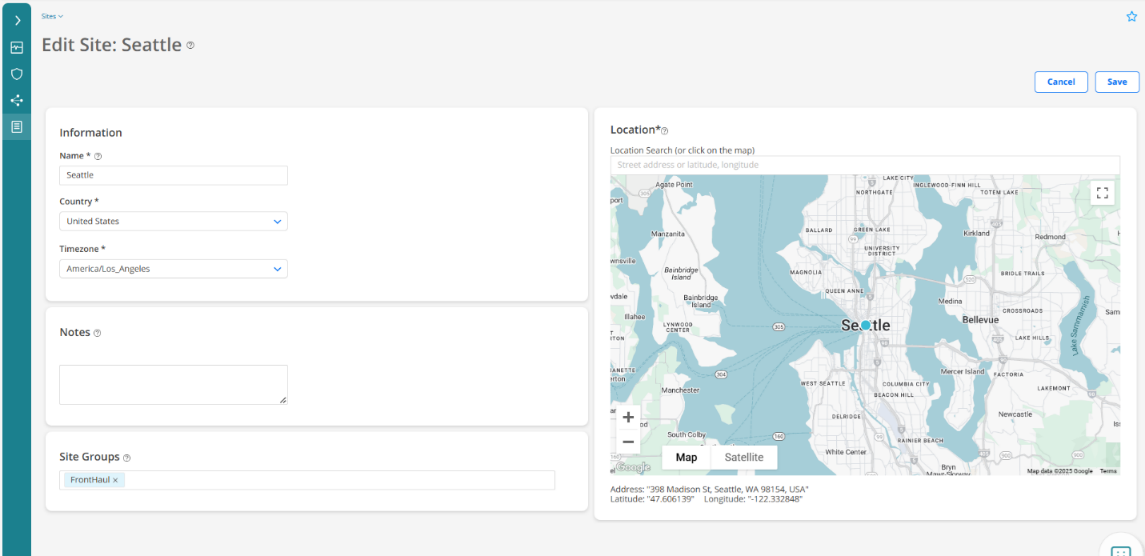
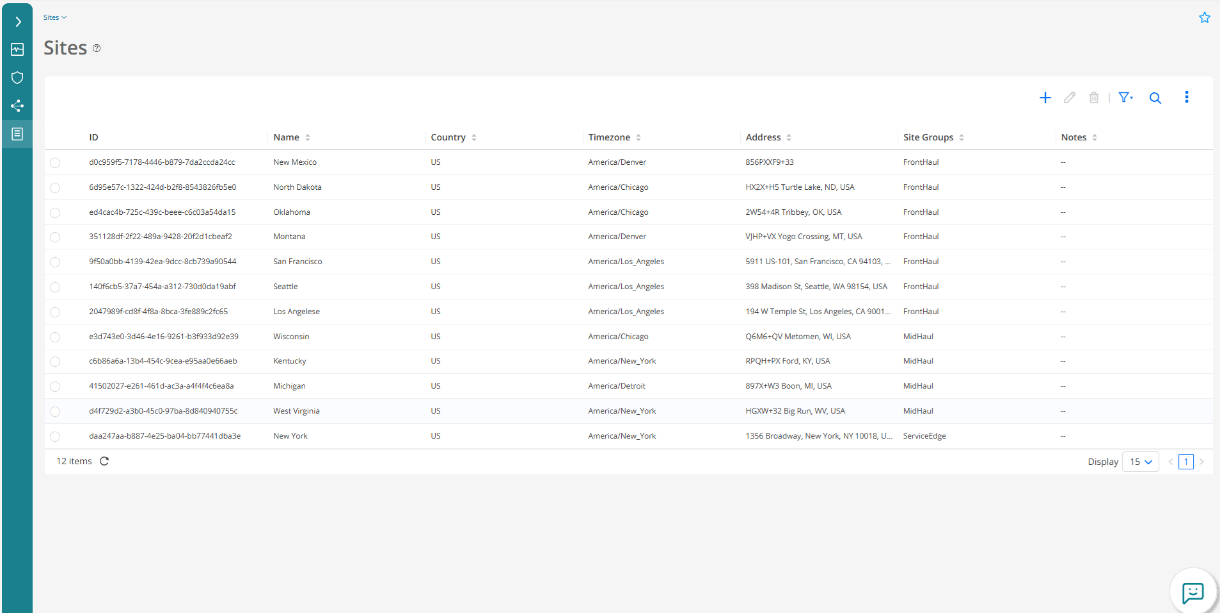
Create Sites
Create sites that mention the geographical location of the devices to be onboarded. The following figures show all the sites configured in the lab topology and the configuration of a site in detail (for example, Seattle):
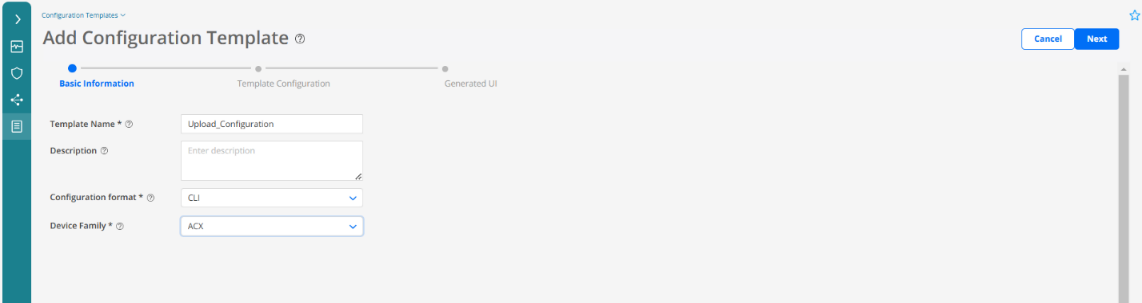
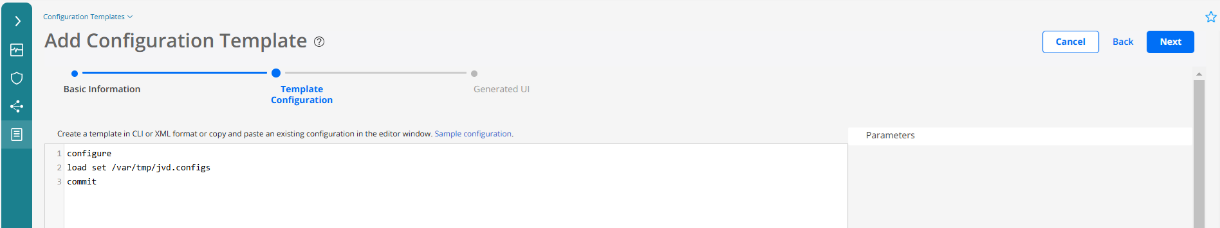
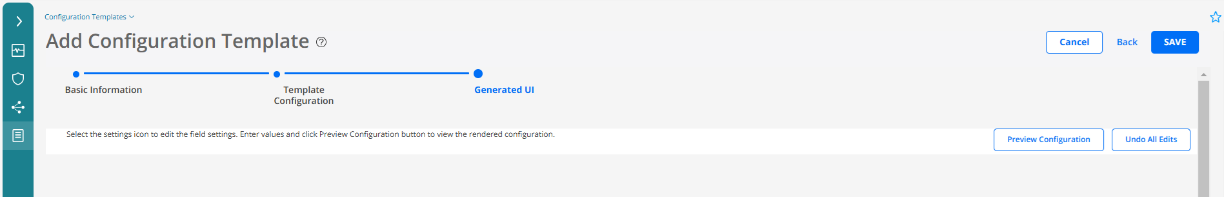
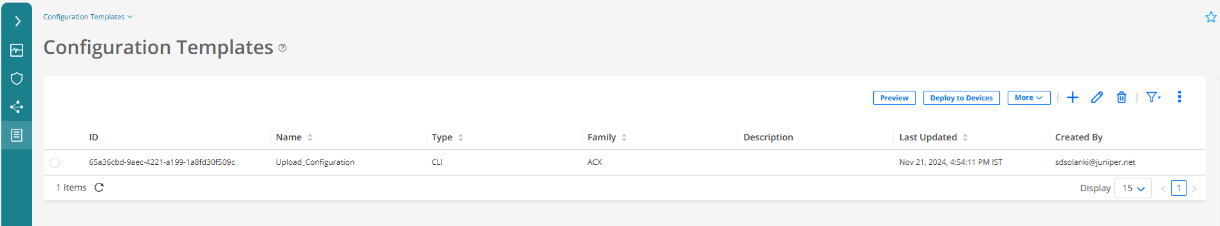
Create Configuration Templates
Create a configuration template to configure service configuration of access nodes from Paragon Automation application. The following figures display how to create a configuration template.
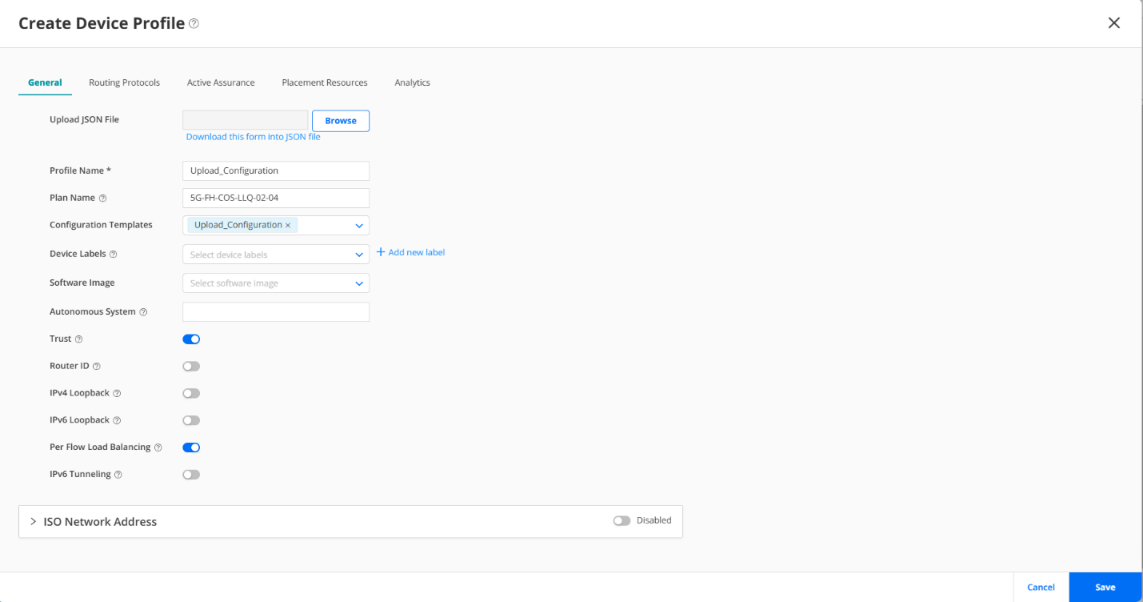
Create Device Profiles and Map Configuration Template
Create device profile and map the configuration template to the access node’s device profile. The following figures explain how to associate a configuration template with a device profile.
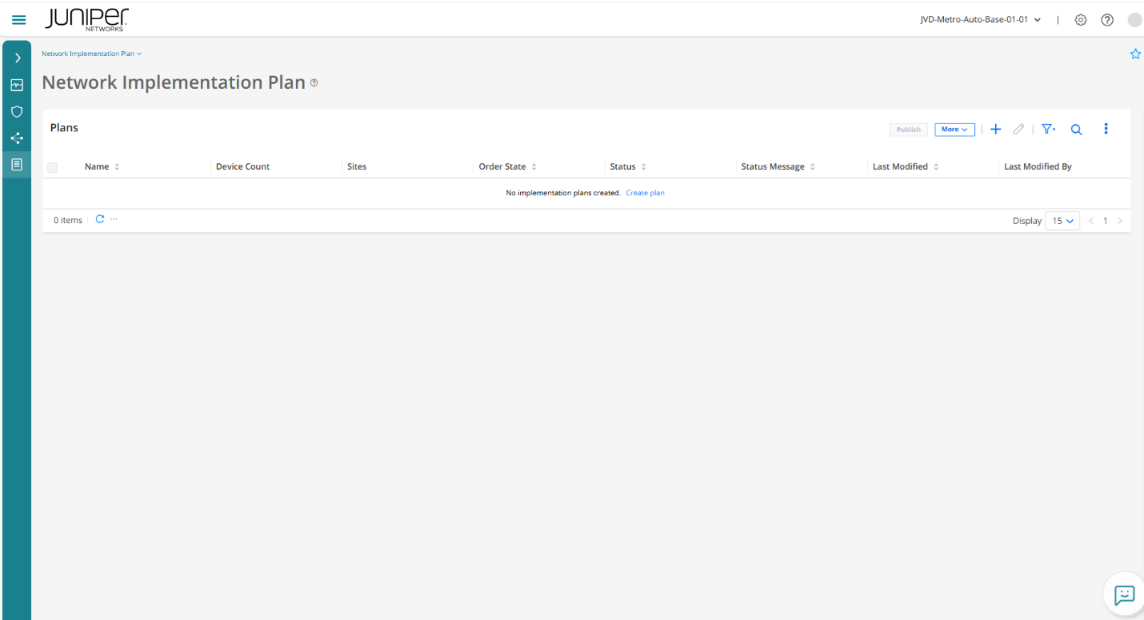
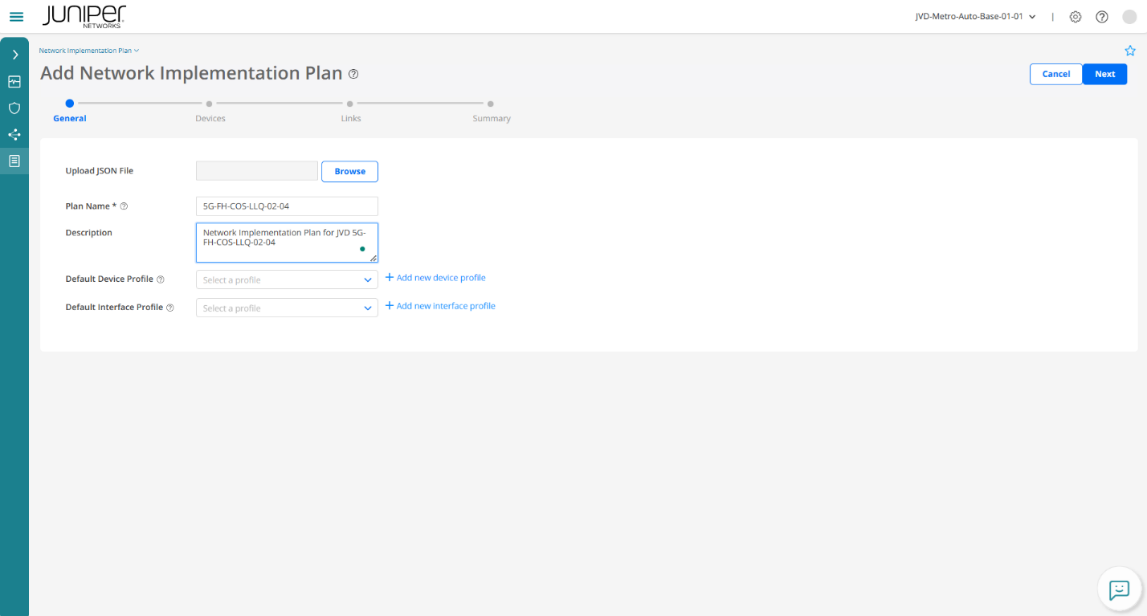
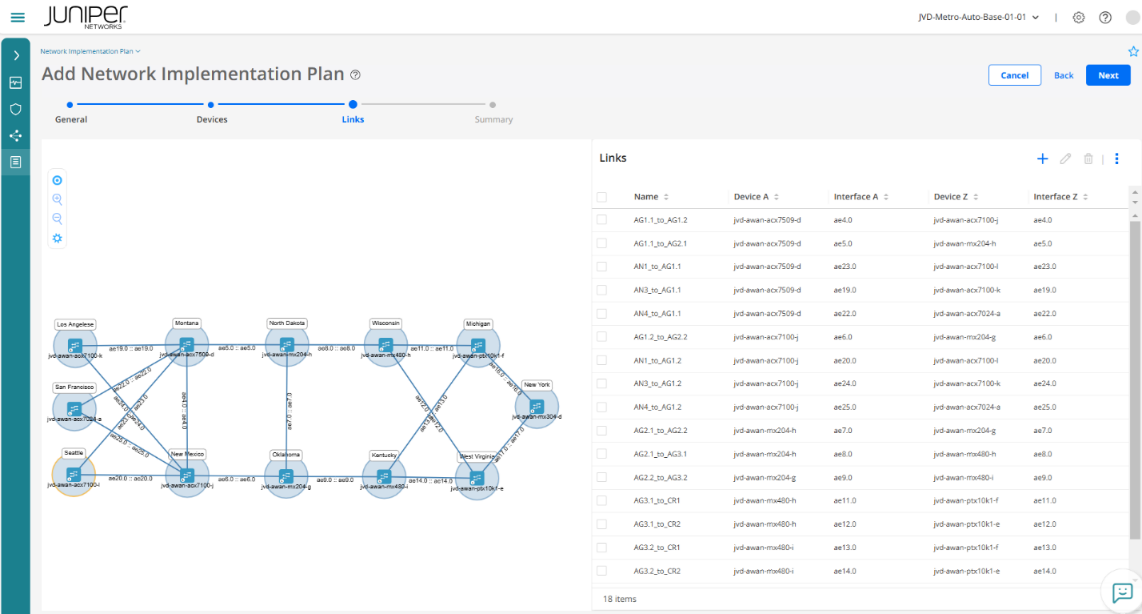
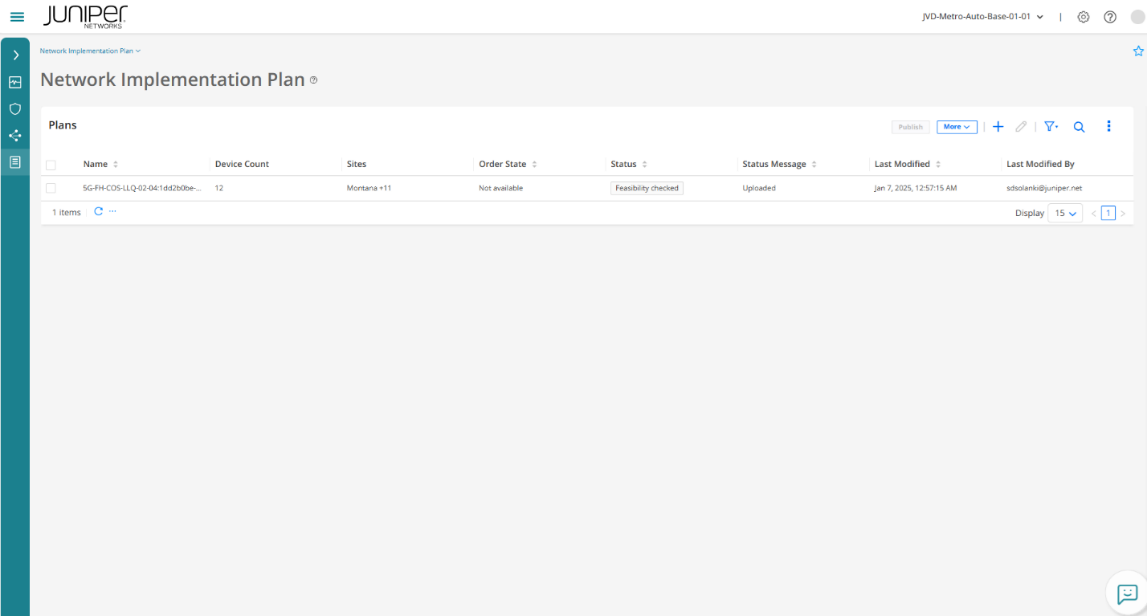
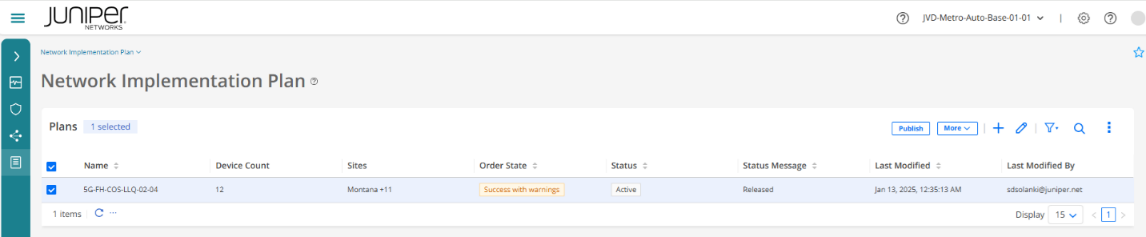
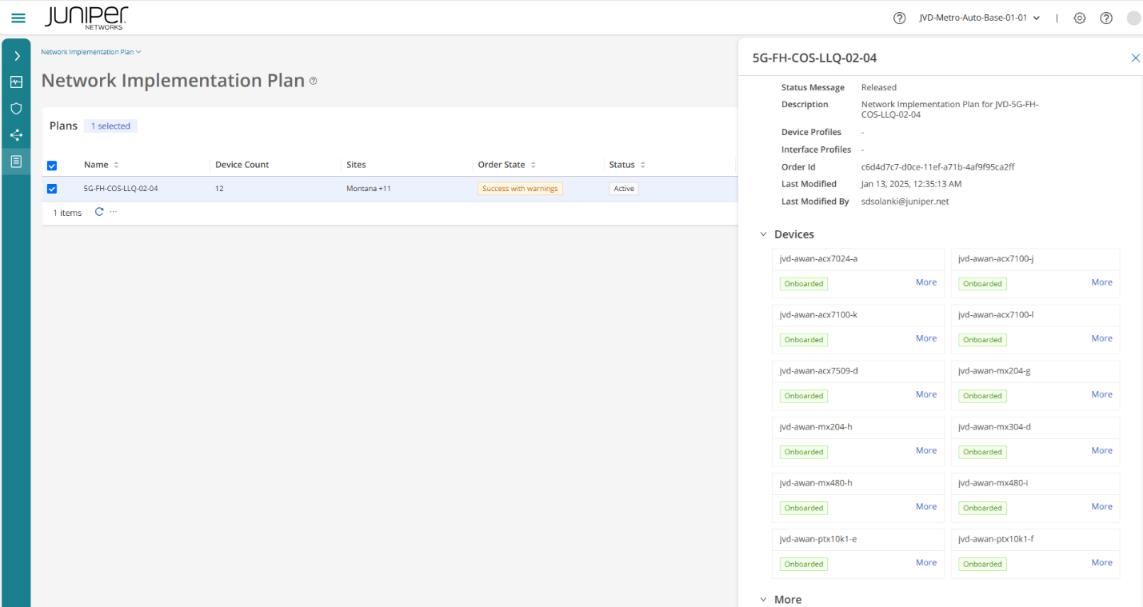
Create Network Implementation Plan
Network Implementation Plan (NIP) defines which device profile and interface profile should be applied to a device or a group of devices during onboarding. The profiles define which interfaces to configure, which protocols to enable, which IP addresses to assign, and so on.
Paragon Automation maps the serial number of a device during onboarding with the serial number that is included in a particular network implementation plan, corresponding device and interface profiles are then applied to the device.
A plan is created by adding devices, assigning device and interface profiles to the devices, and defining links from the devices to neighboring devices.
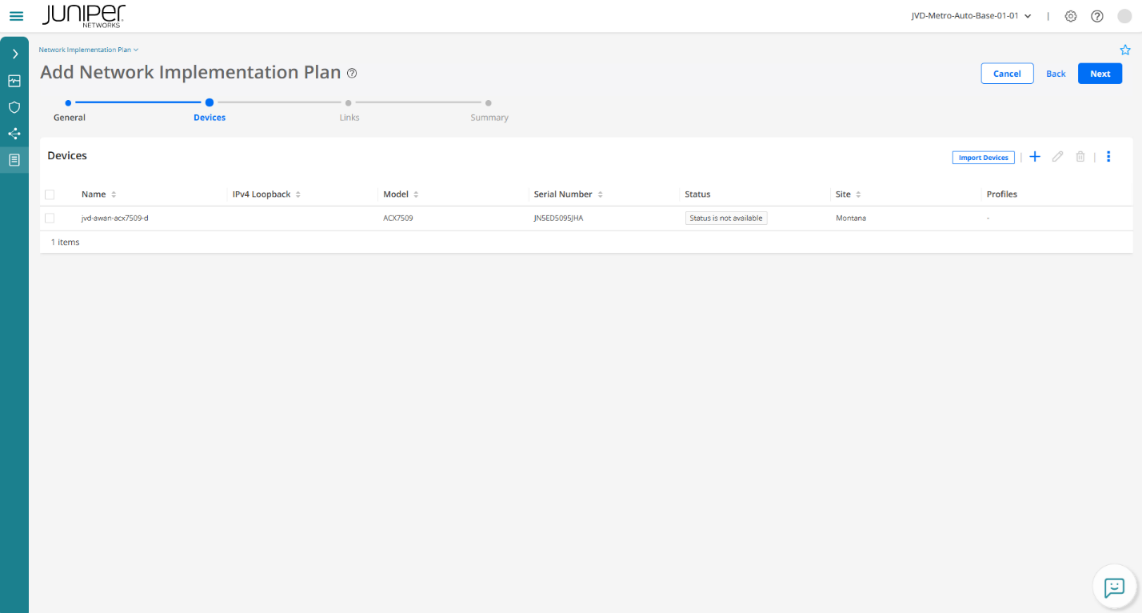
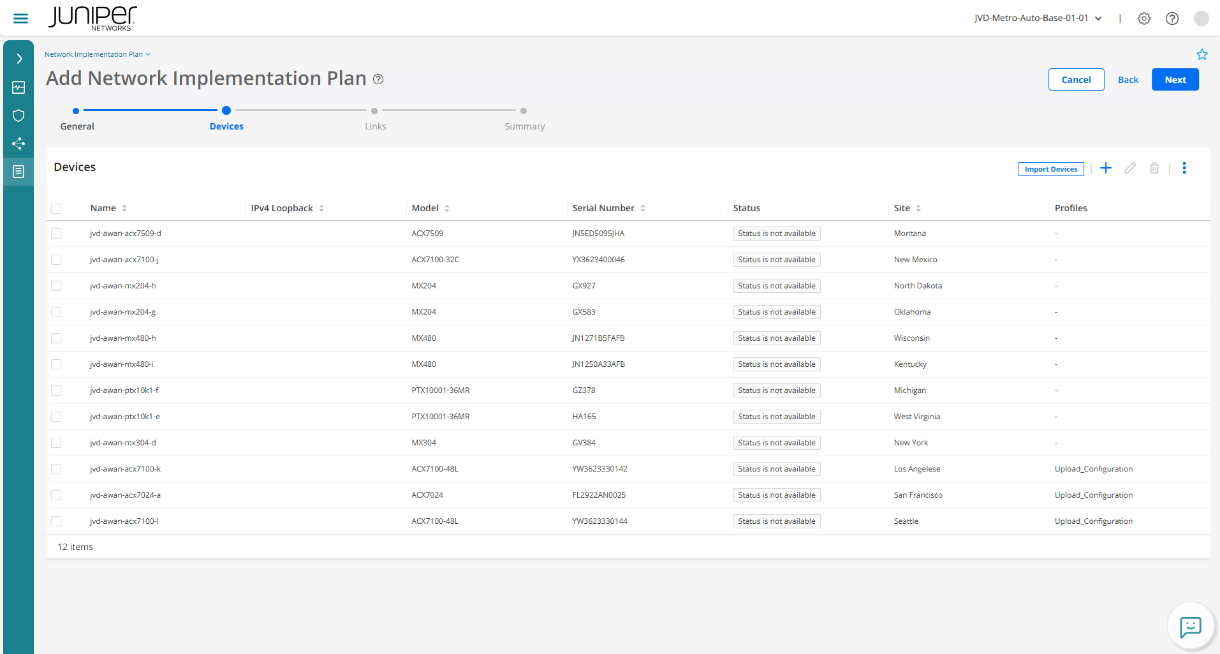
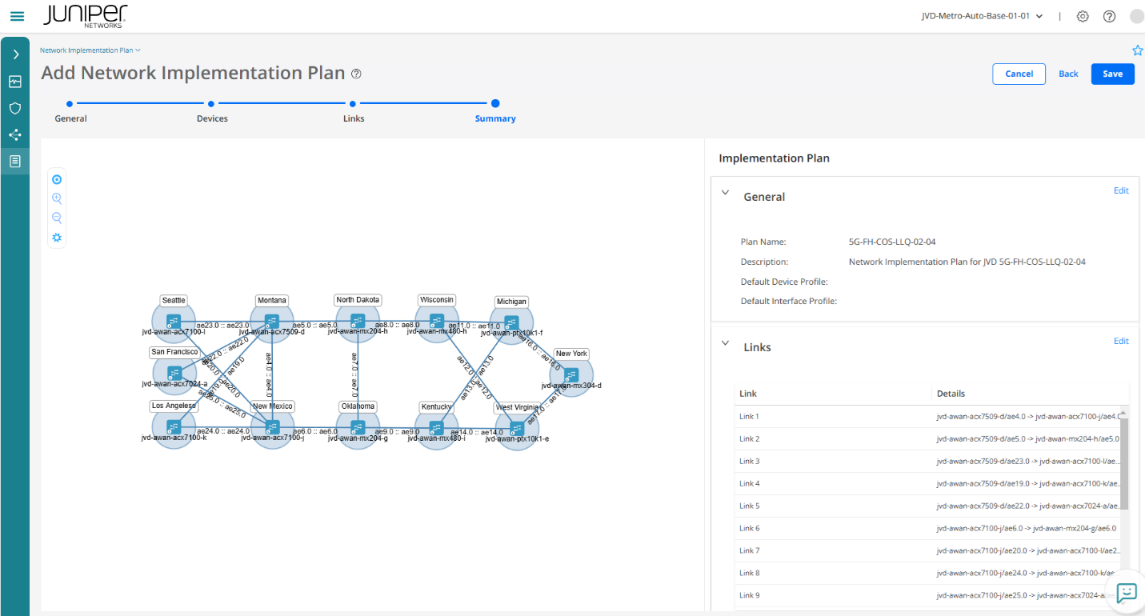
Paragon Automation provides an Add Network Implementation page (in a wizard format) that guides you to create the plan. The following figures show how to create a NIP from onboarding dashboard and add all the devices, which are part of the topology.
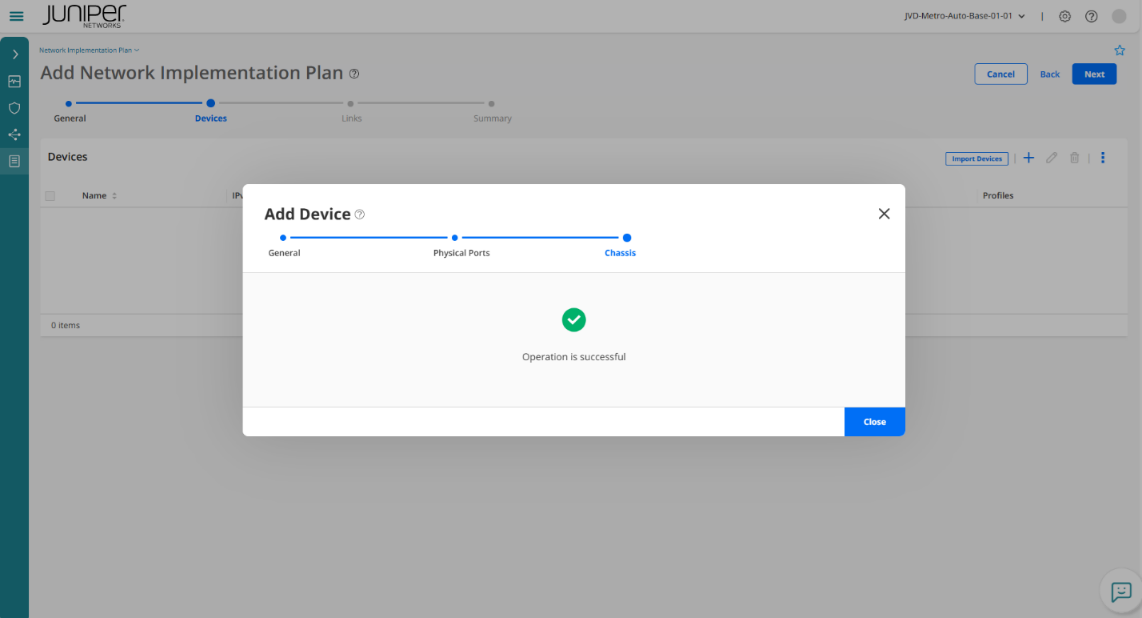
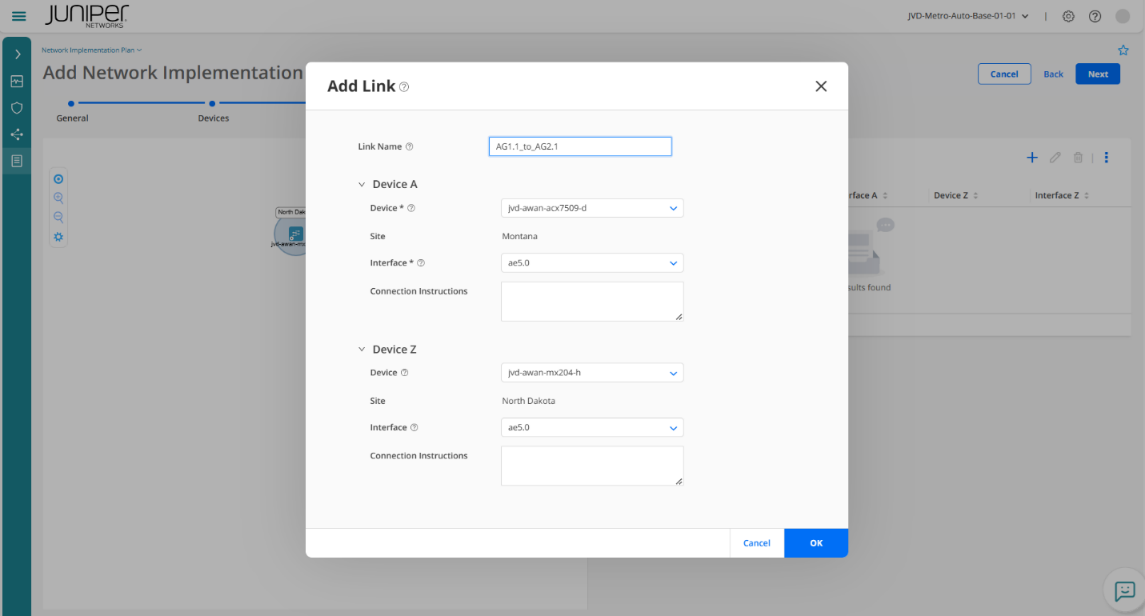
Create a Device under NIP
To create a device under NIP, add device's details like host name, site name (previously created), serial number of the device, and device profile (previously created).
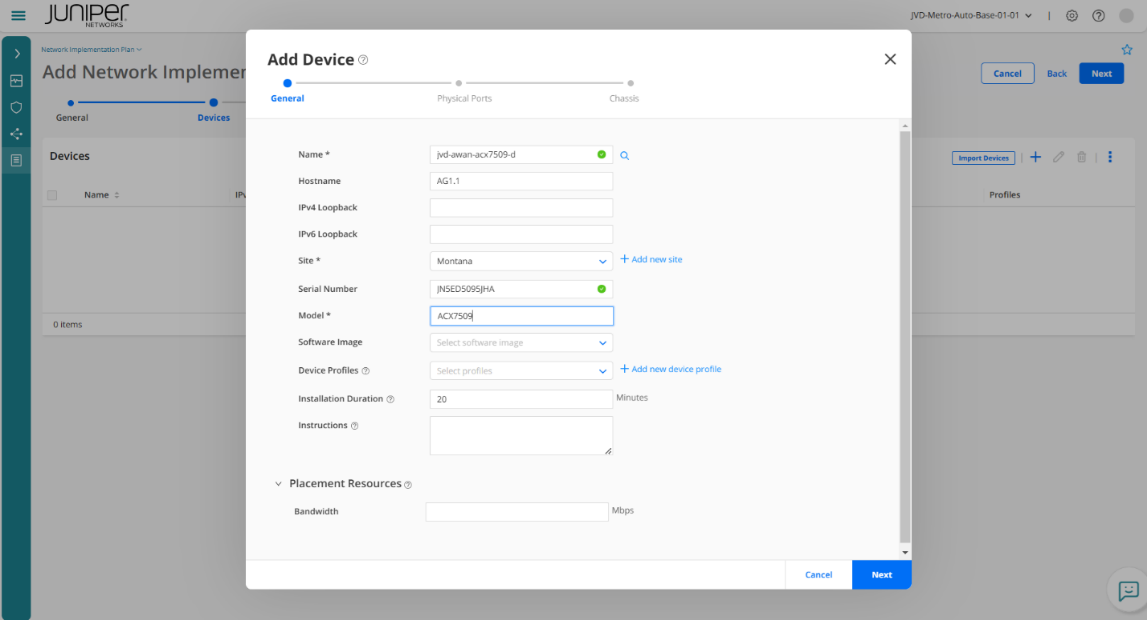
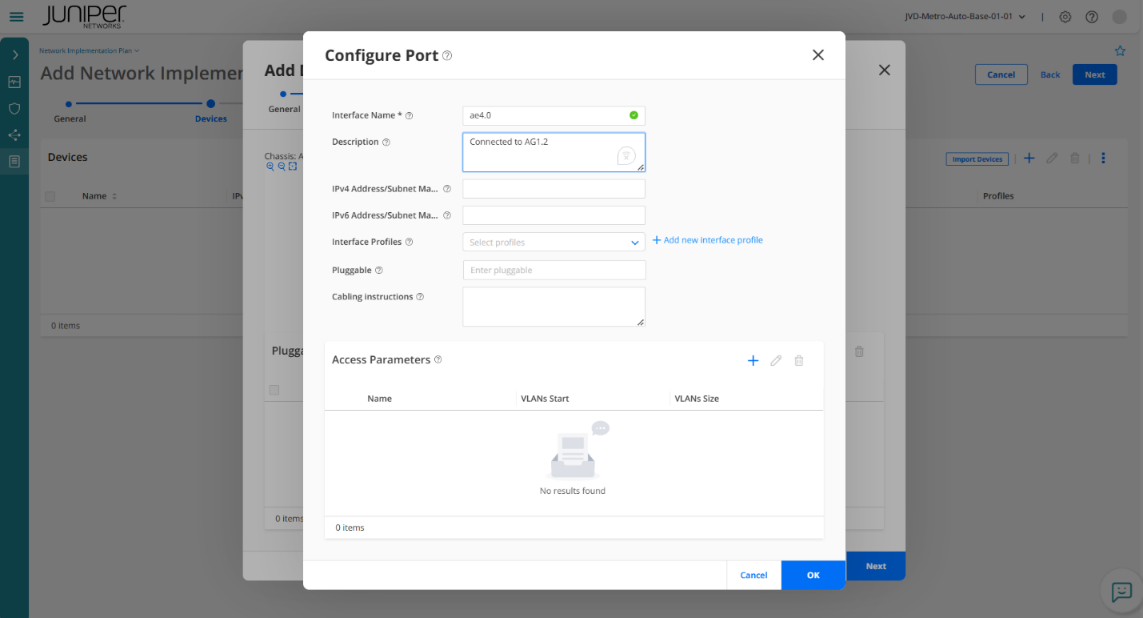
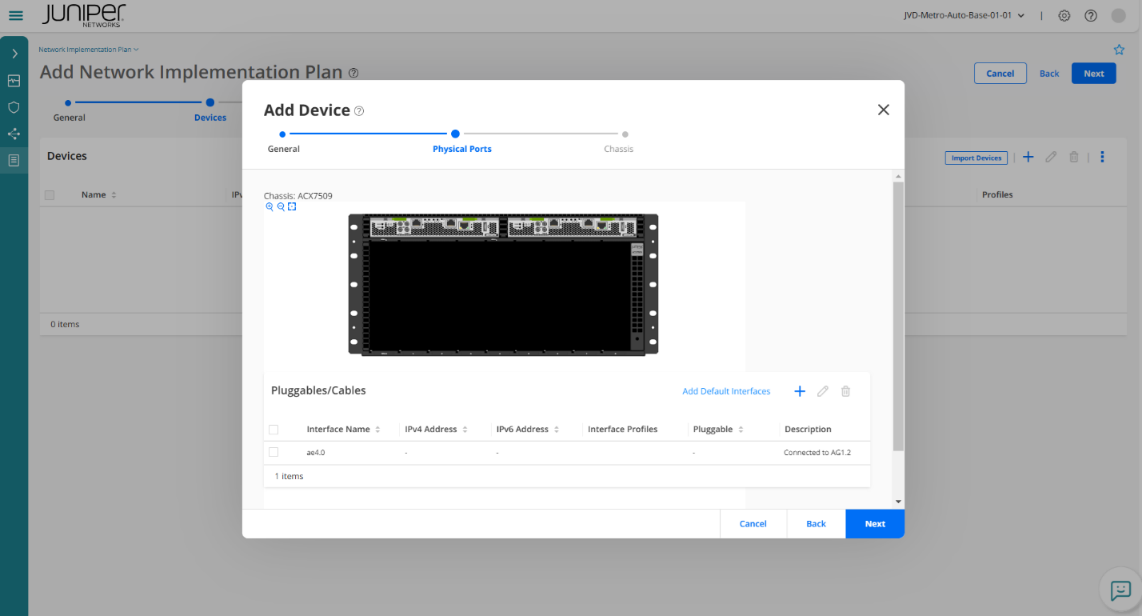
Click + to add the device's ports details.
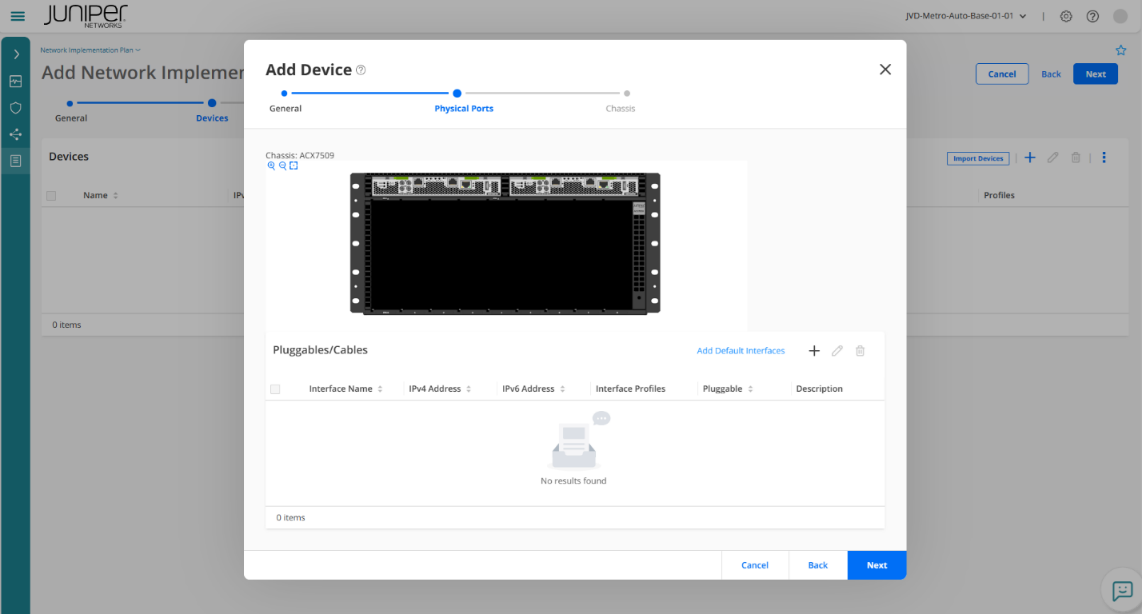
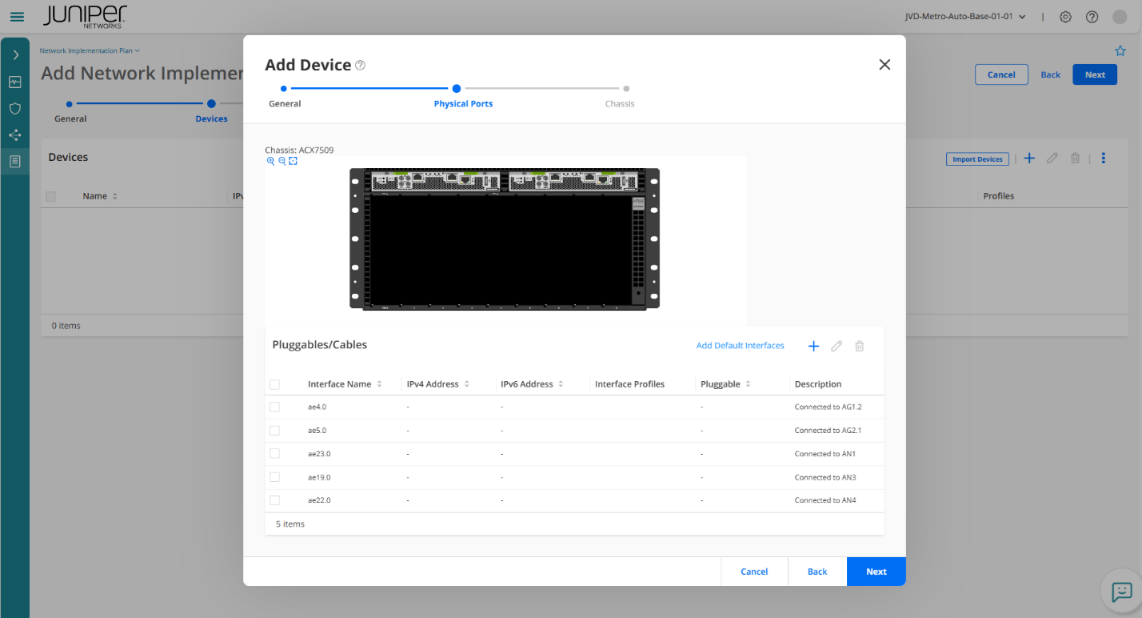
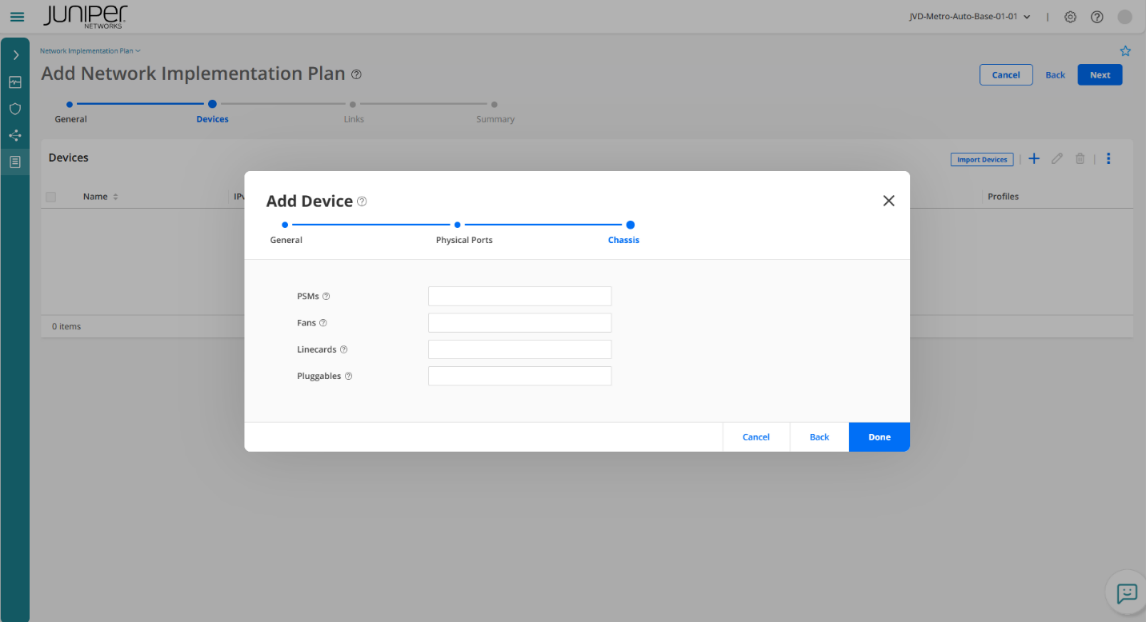
After adding all device details, add link details that describe the connection between two devices.
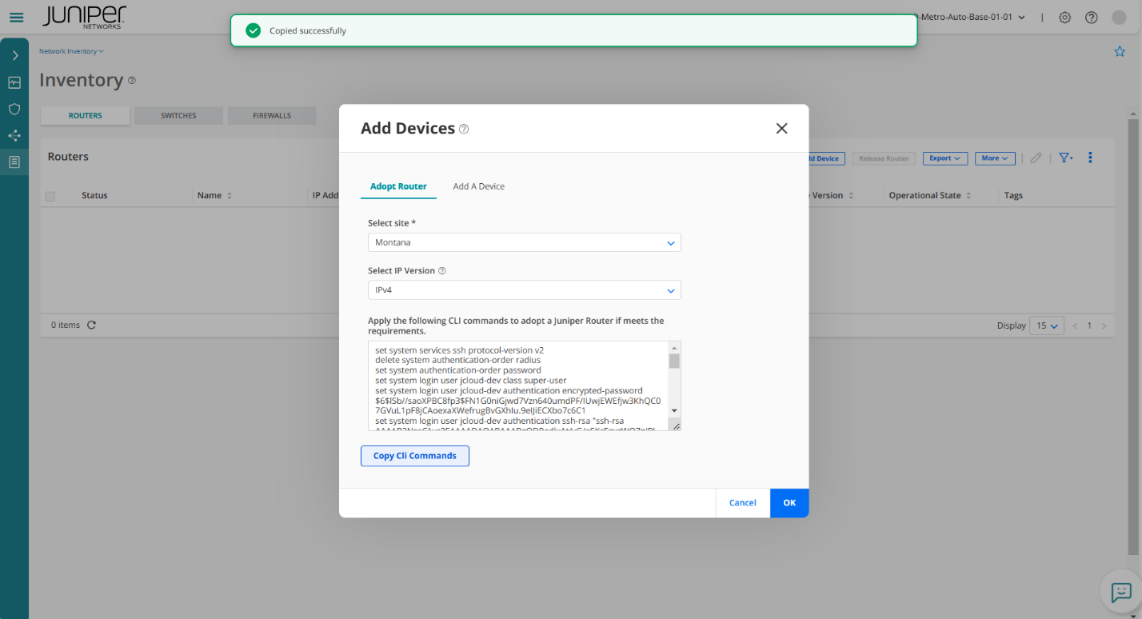
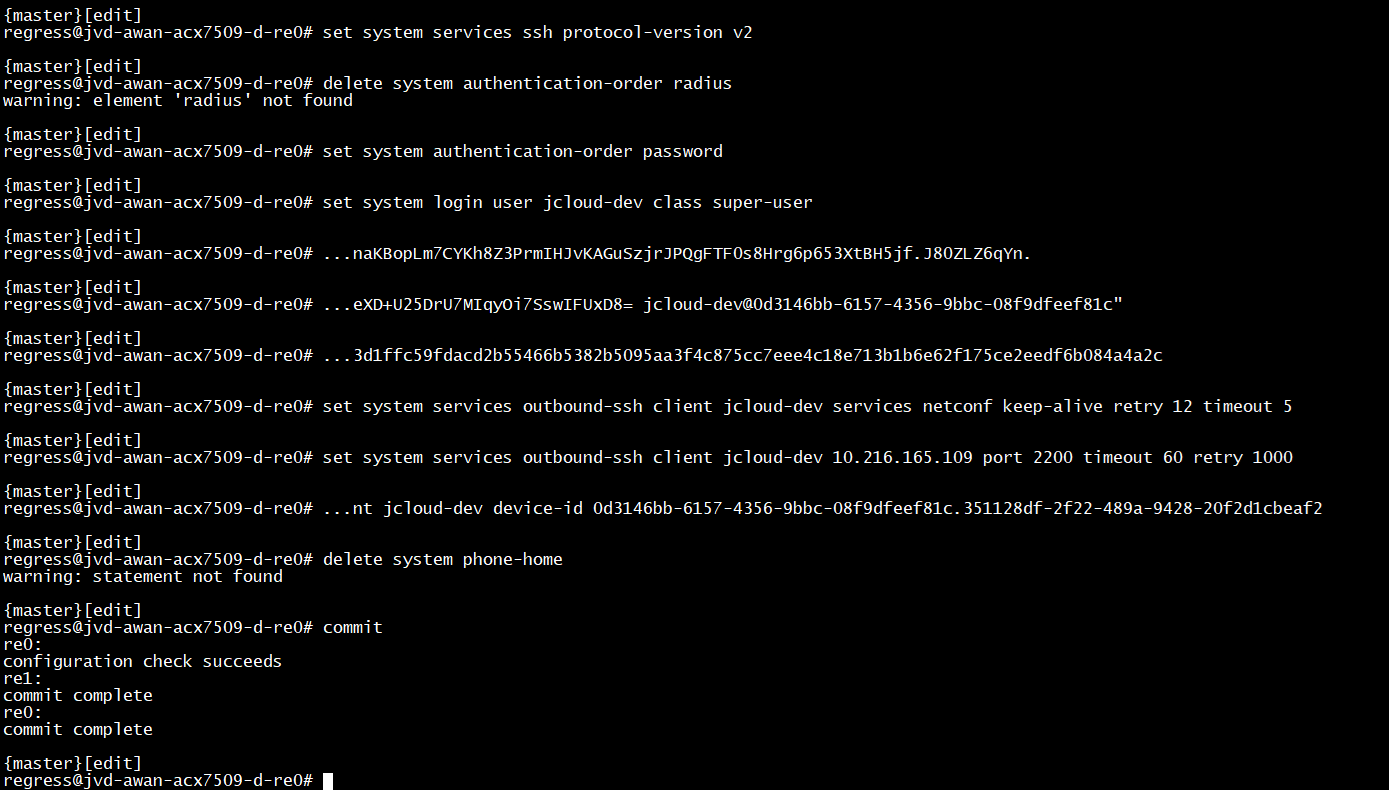
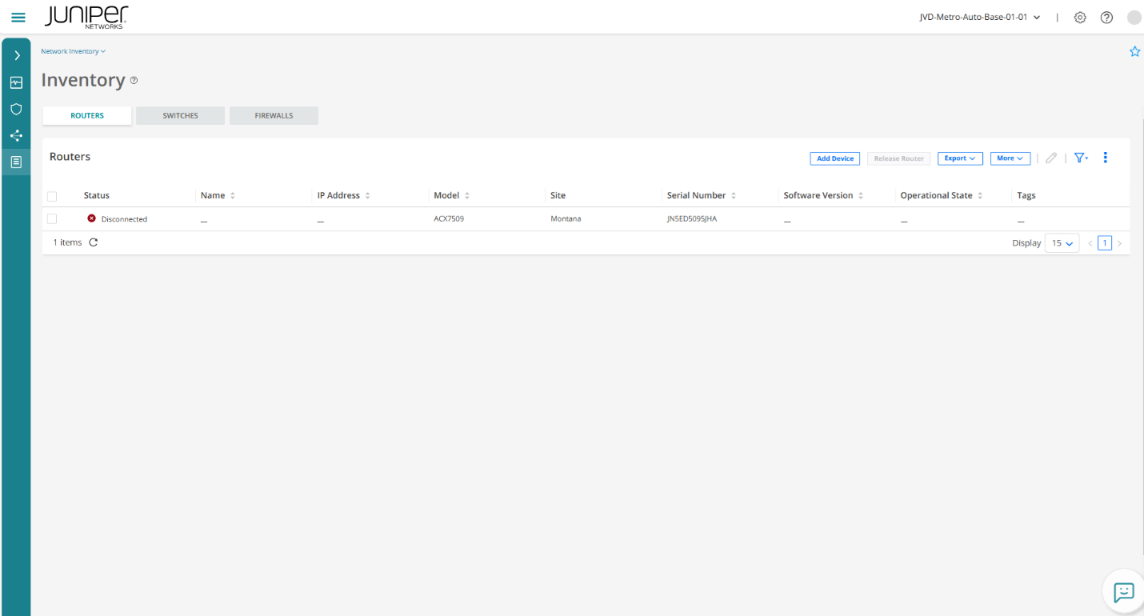
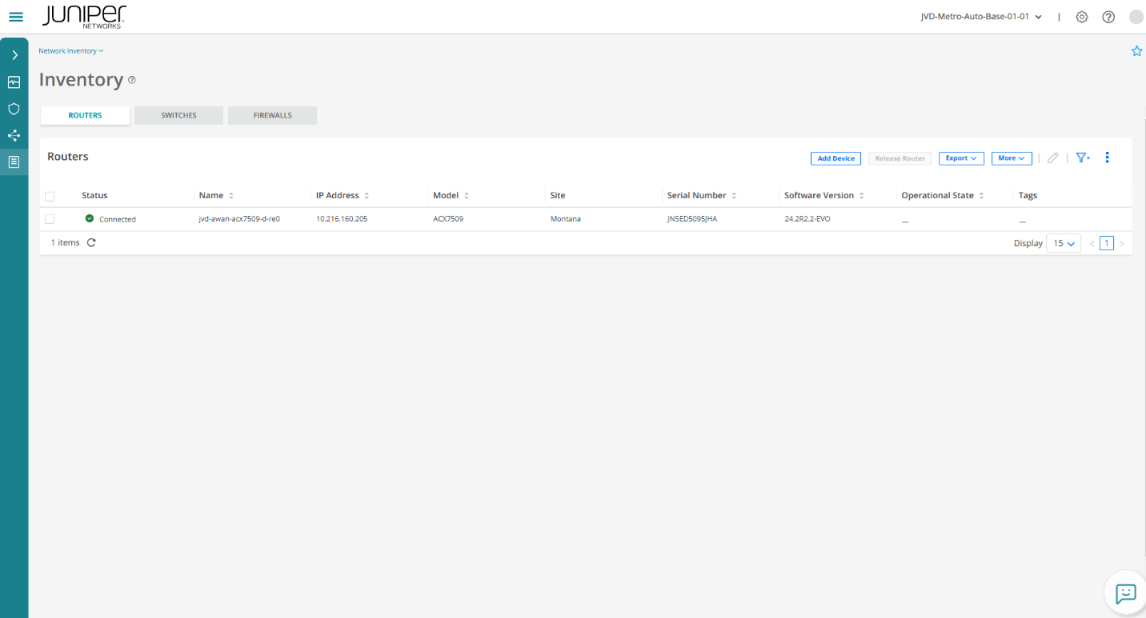
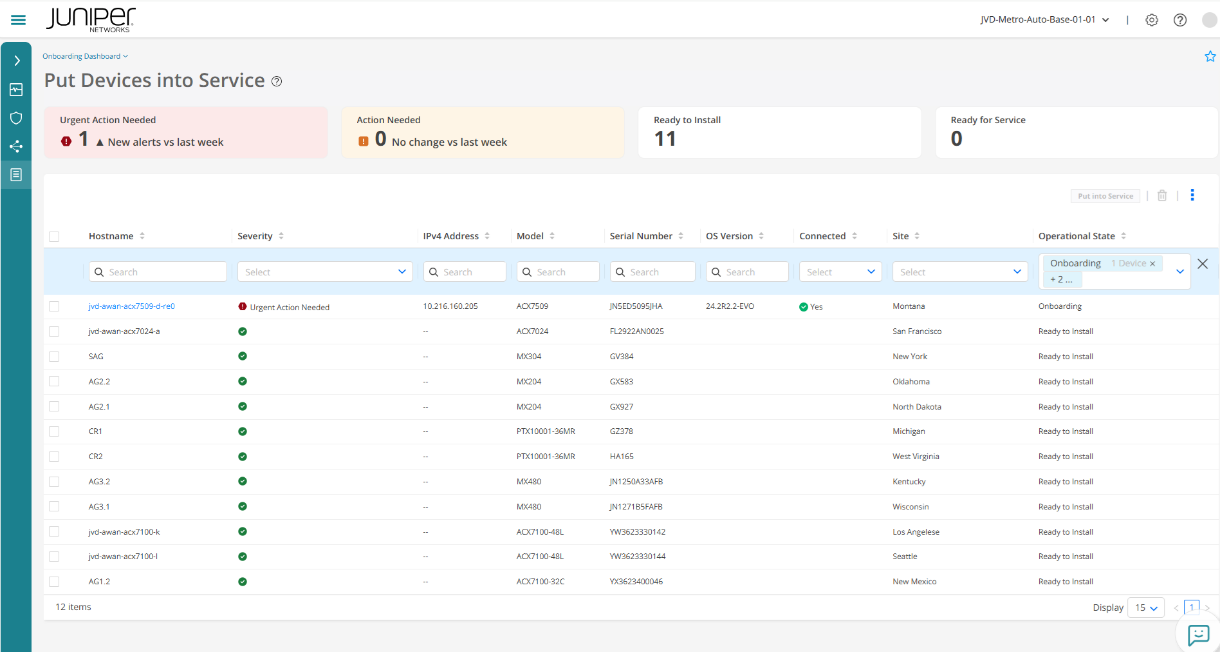
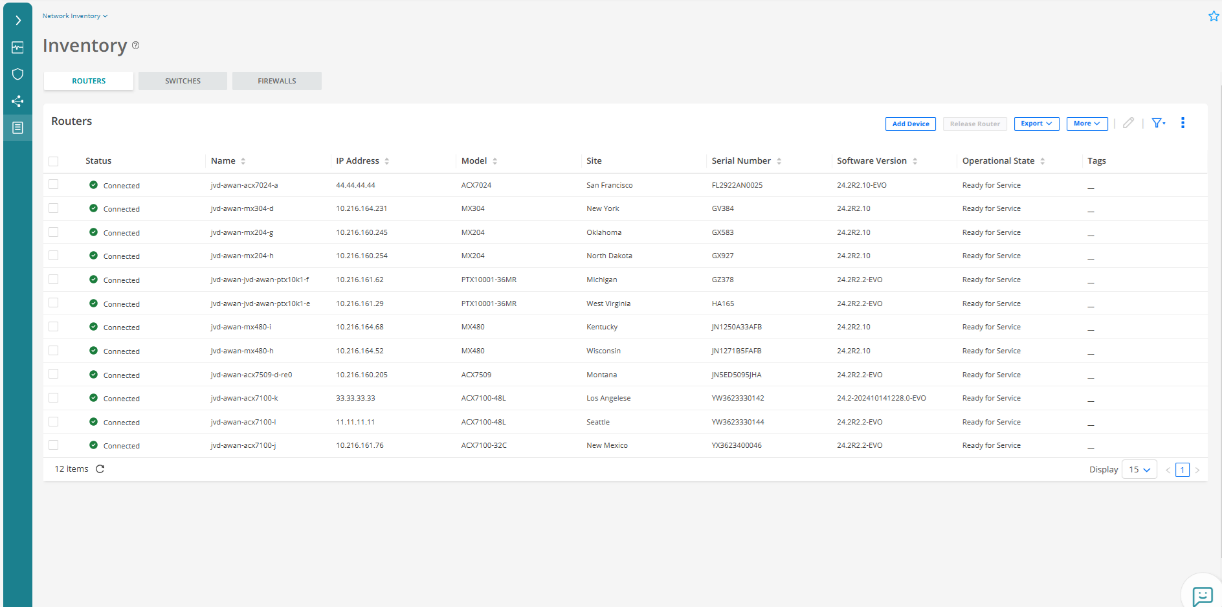
Onboard Devices
Once NIP is created, onboard all the aggregate, core, and SAG devices manually (remember in this solution, ZTP is limited to access nodes only) by configuring the onboarding commands, selecting the "Add devices" option present on the inventory section for the appropriate sites and pushing their service configurations using Python script from the server. The following figures explain step-by-step procedure to onboard these devices.
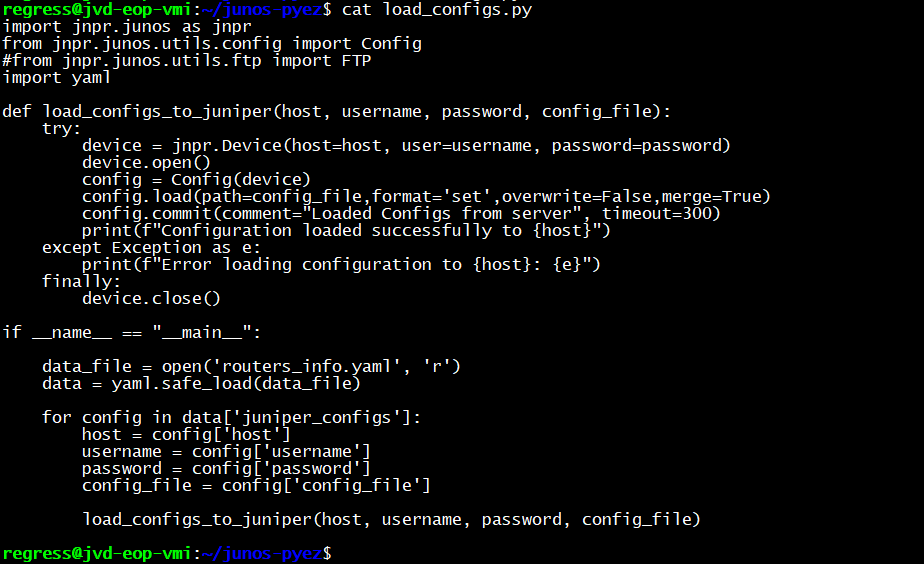
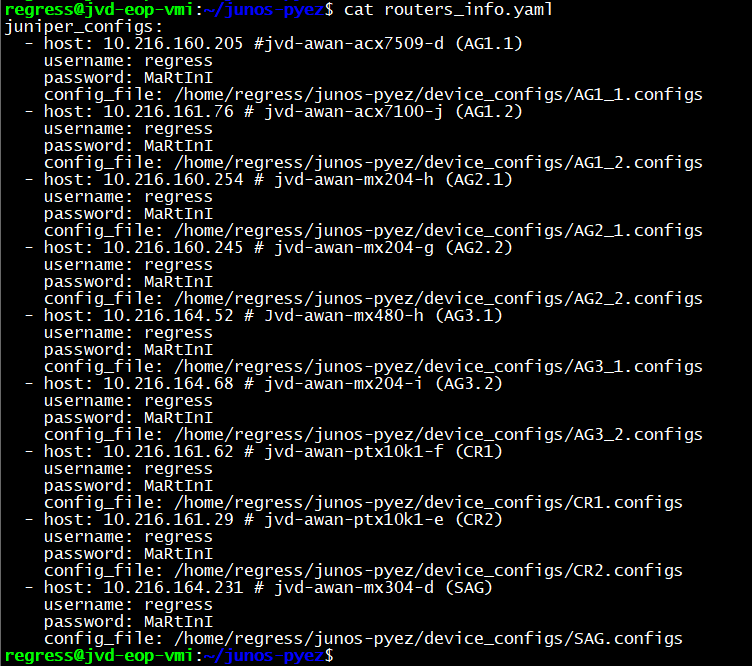
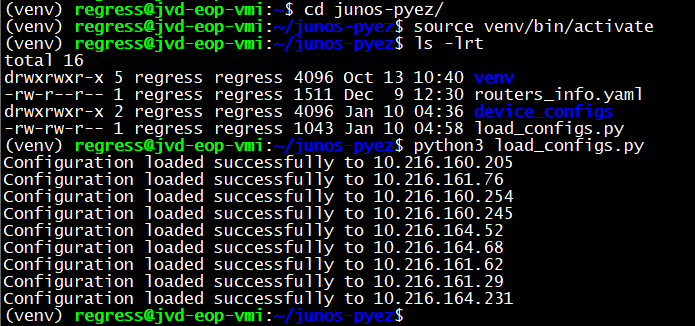
Configurate Underlay and Overlay for Aggregate, Core and SAG Devices using Python Script
Once aggregate, core, and SAG devices are onboarded, a python script (for example, load_configs.py) is used to push the service configurations saved in the junos-pyez/device_configs/ server directory to all those devices:
Onboard Access Node Devices
Once aggregate, core, and SAG devices are configured, initiate ZTP process from access nodes to onboard.
Initiate ZTP from access nodes (Acquire IP address and copy a python script from VM to access nodes)
For access nodes, initiate ZTP (Zero Touch Provisioning) to acquire an IP address for reachability and transferring the Python script base configuration, and service configuration from the DHCP server to the access node. Transferring Python script from the DHCP server to the access nodes and executing it as part of the ZTP process configures onboarding commands on all the access nodes. During the access node onboarding process, service configuration of the device is configured by executing the configuration template associated with the access node profile.
During the ZTP process, an IP address is assigned to each access node so they can be reached. The DHCP options trigger the transfer of a Python script from /tftpboot/ on the DHCP server to the access nodes and execute it on-device. The script initiates FTP transfers of stored base configuration and service configuration files from the server to /var/tmp/ on the access nodes, configures the base configuration, and initiates the onboarding process. The onboard configuration is part of the base configuration stored on the server.
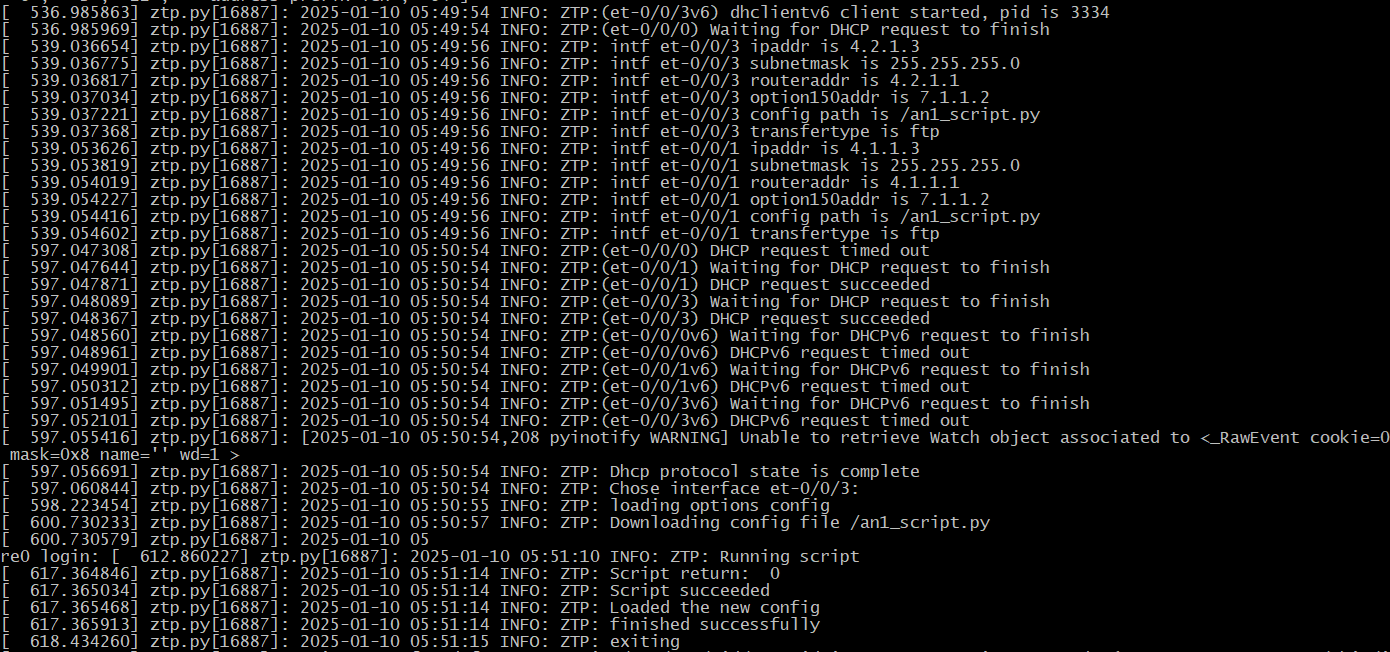
After completing ZTP, the access node acquired IP address for reachability and executed python script to transfer the configuration files and configure the onboarding commands on the access nodes.
Telemetry Traffic Classification
Observability
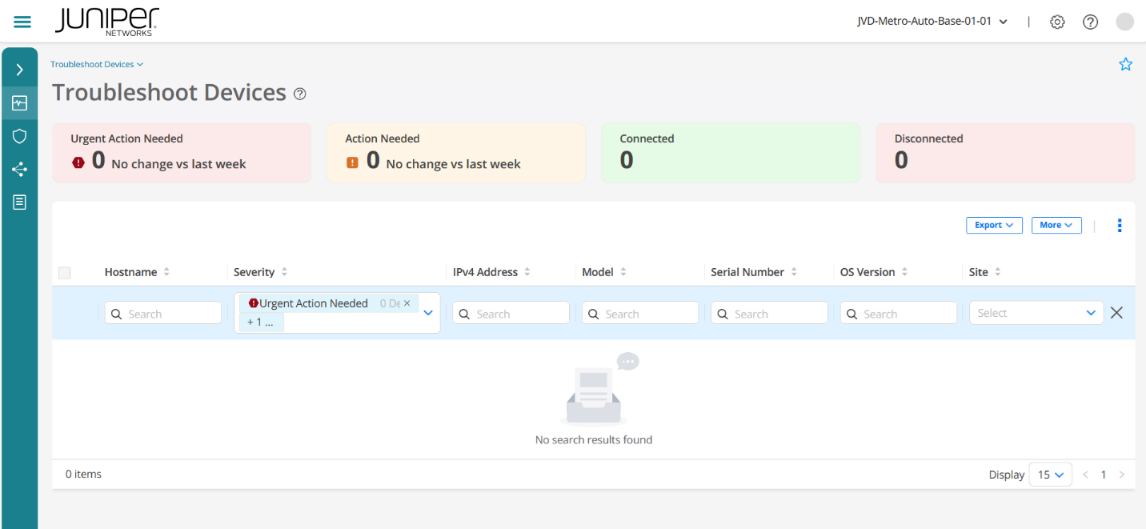
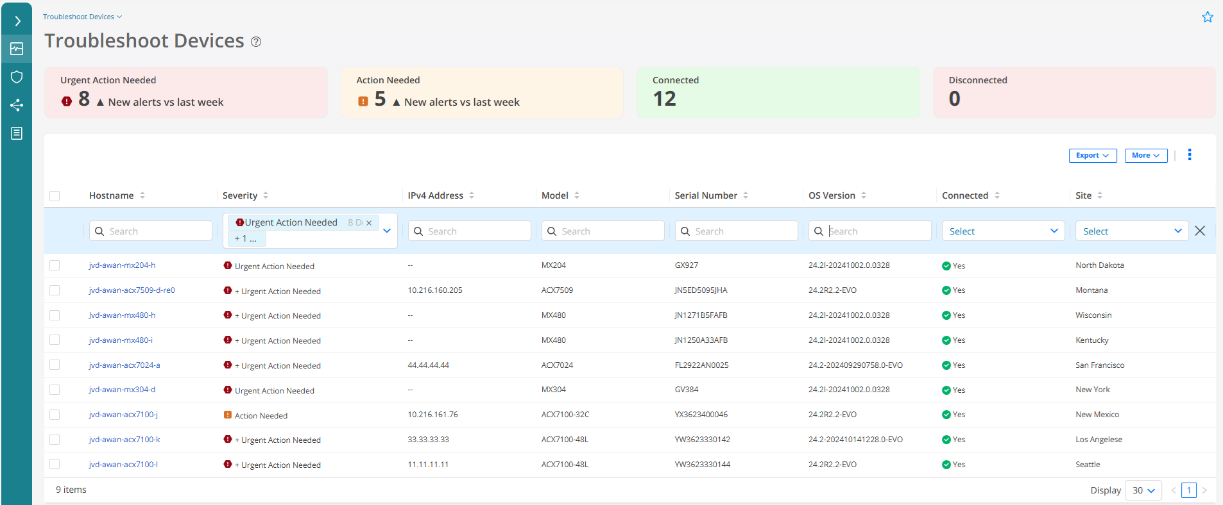
Paragon Automation enables comprehensive network observability by collecting telemetry data from devices and systems. This real-time monitoring provides actionable insights into device health, allowing early issue detection.
You can monitor device health and behavior in real-time, gain detailed insights into the individual device components such as hardware and software, and receive alerts and notifications for potential issues before they become major incidents.
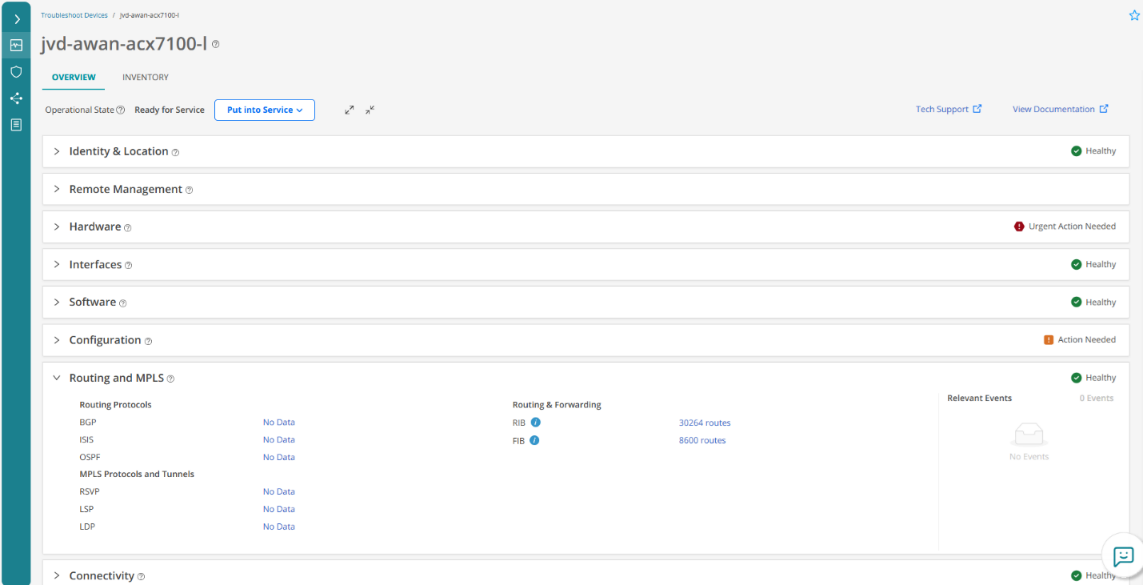
Paragon Automation provides a comprehensive overview of various aspects of a device, including its identity and location, remote management details, hardware and interface health, software configuration, and routing information.
This comprehensive overview allows users to quickly assess device details, device location, hardware utilization, interface statistics and errors, software upgrade needs, configuration backups, routing information, and connectivity status, among other key metrics – providing a complete picture of the device's state.
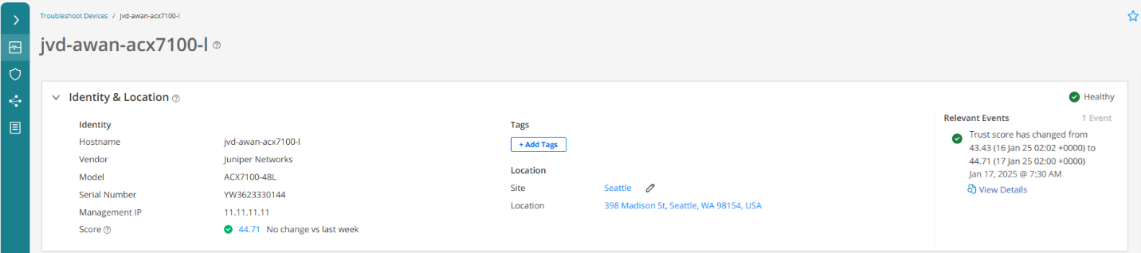
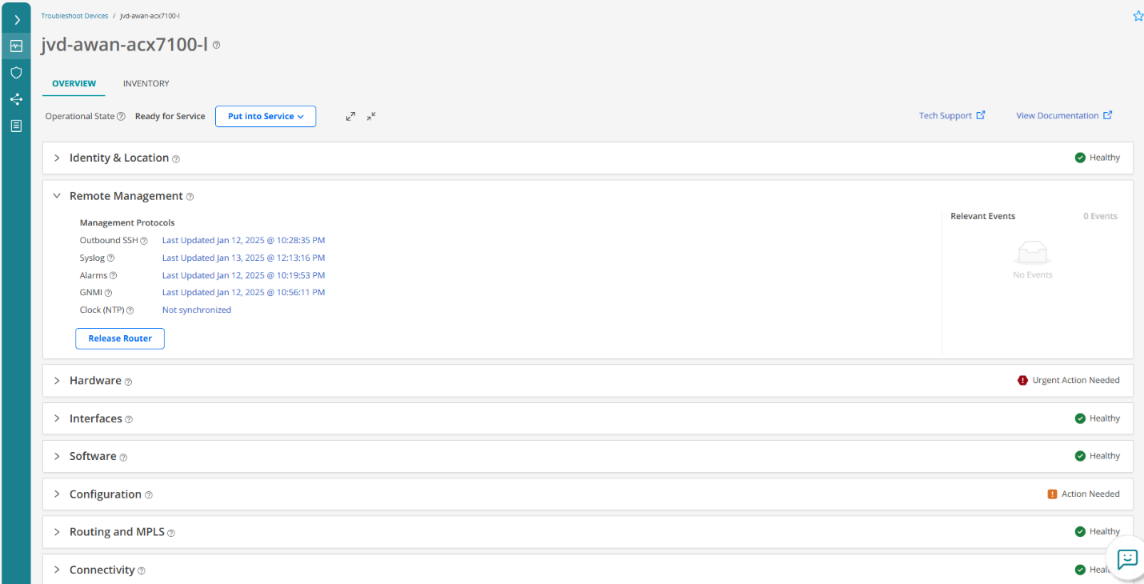
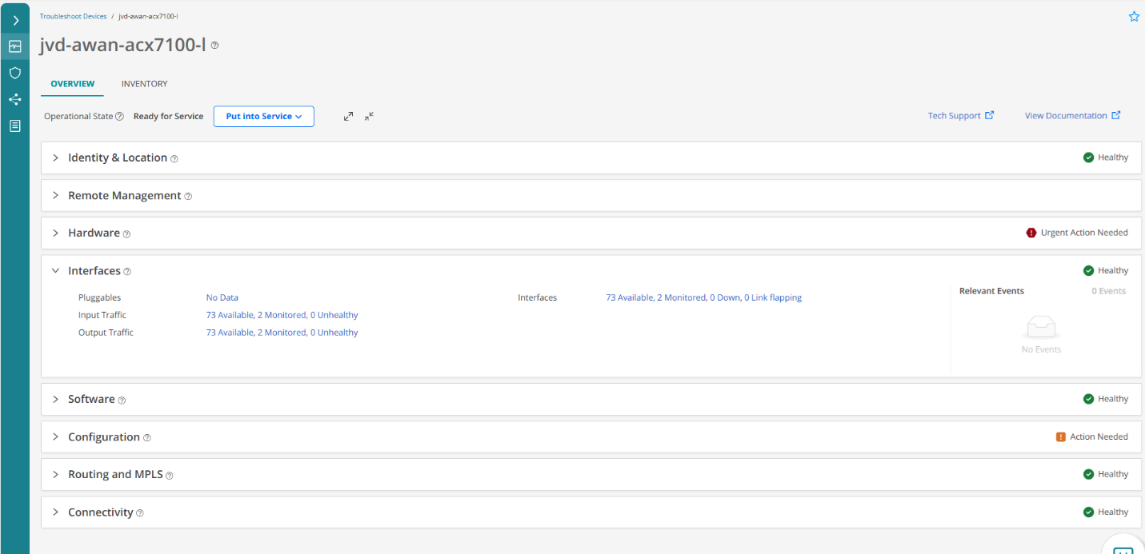
Click the device’s name on the Troubleshoot Devices page to view different accordions as shown in the following figure.
Device Identity and Location Details
Use this accordion to view details such as vendor, hostname, and serial number of a device and the name and location of the site where the device is installed. You can add tags to the device and also view the most recent trust score recorded for the device, and alerts and alarms related to the trust score.
Remote Connectivity
Use this accordion to view details of the last outbound SSH and gNMI sessions established or terminated between the device and Paragon Automation as a Service. You can view details about the latest system log and latest alarm that the device generated, and the status of the synchronization between the device’s clock and the NTP server.
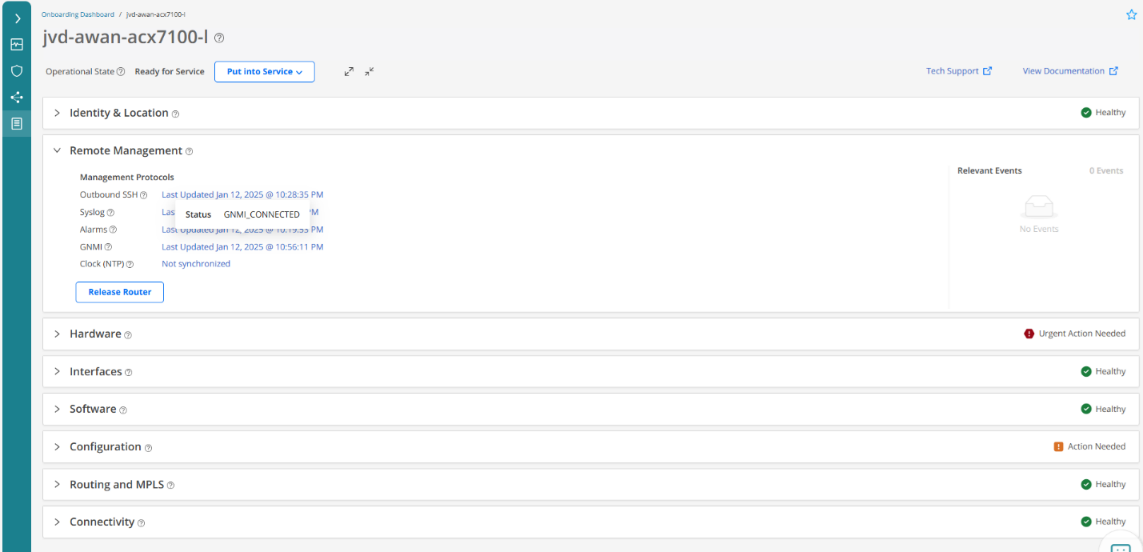
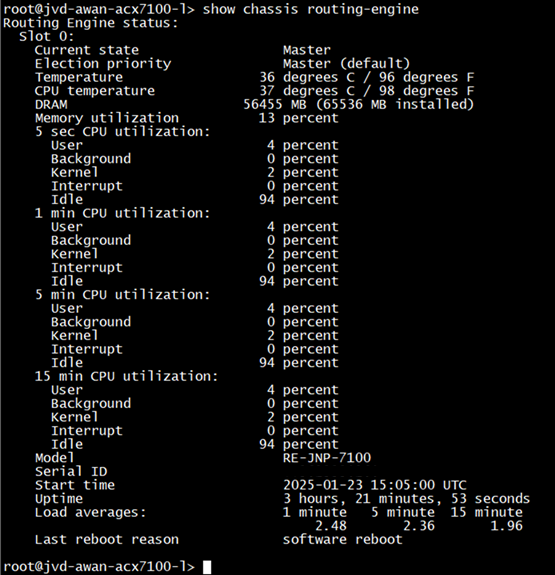
gNMI and Outbound SSH connectivity output for each of the access nodes CLI.
.png)


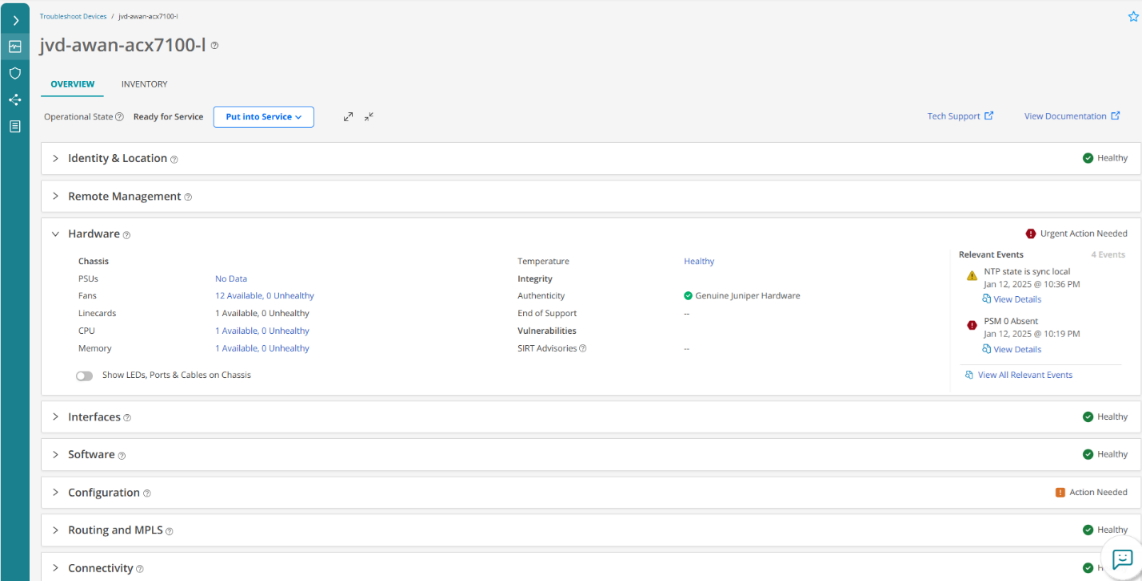
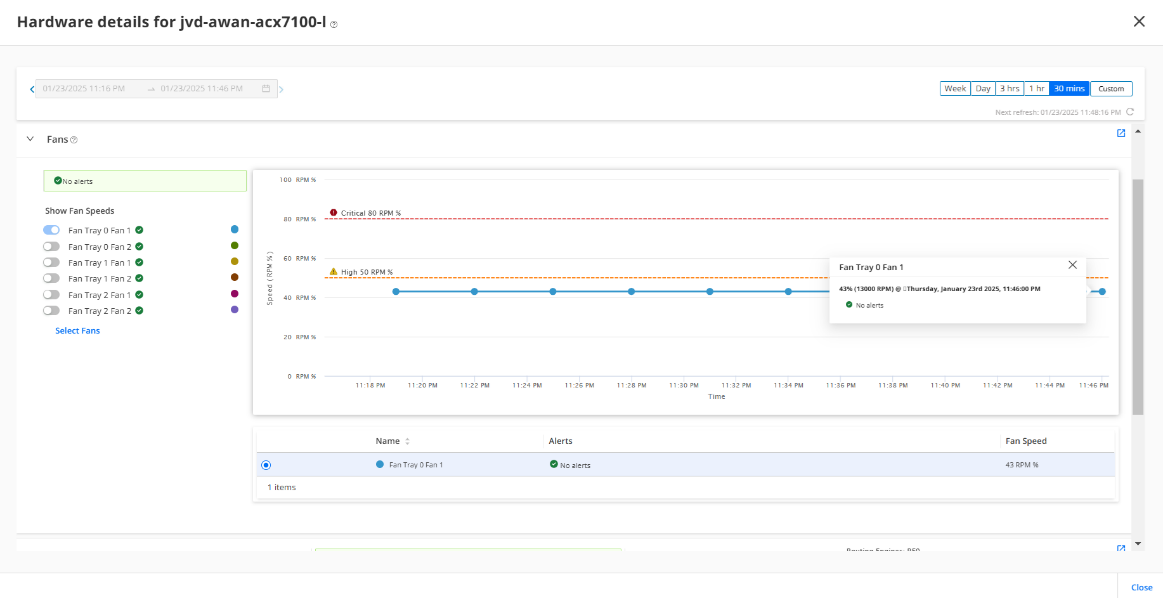
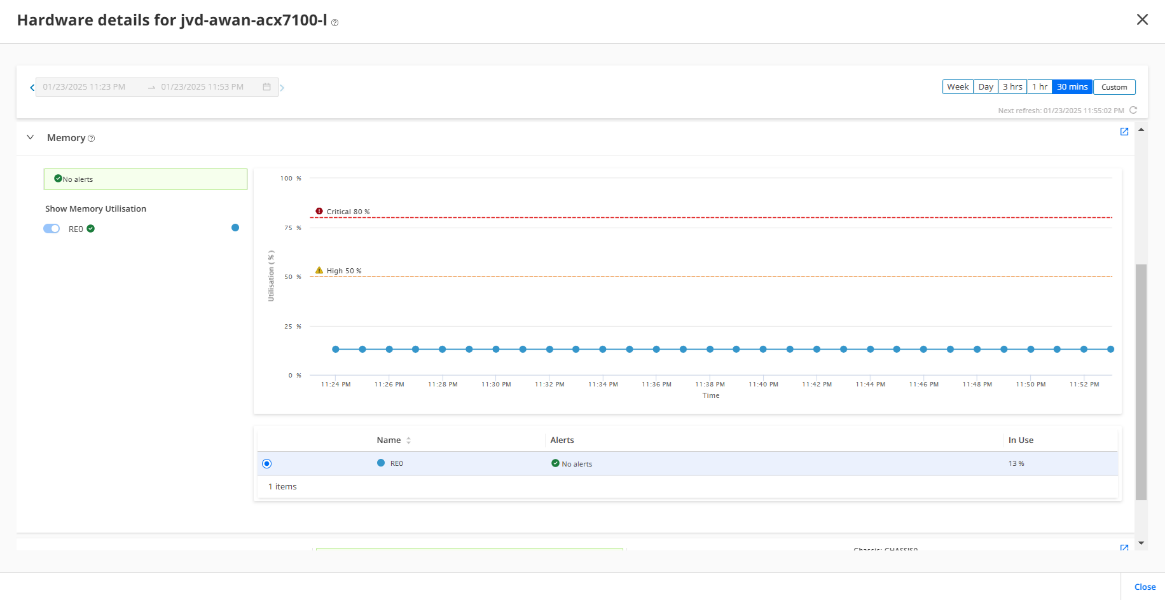
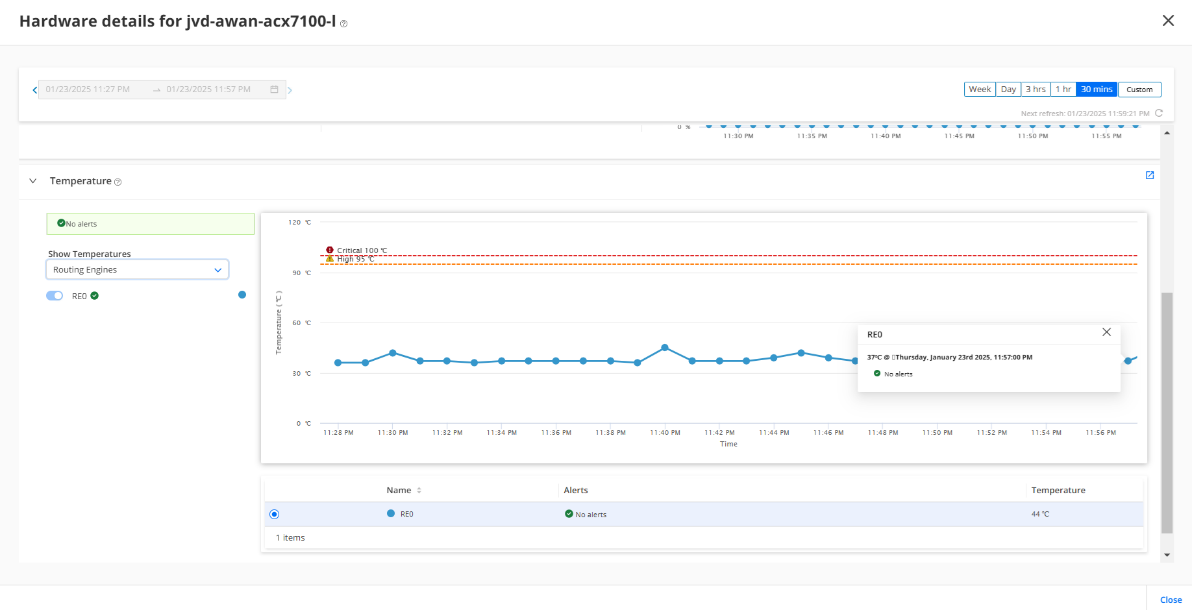
Hardware Health
Use this accordion to view data about the number of available and unhealthy chassis components, the KPIs for the components, and the details of temperature sensors. The top-right of the accordion displays the overall health of the device’s hardware components and temperature. Latest events related to hardware performance appear under the Relevant Events section in the order of severity.
.png)
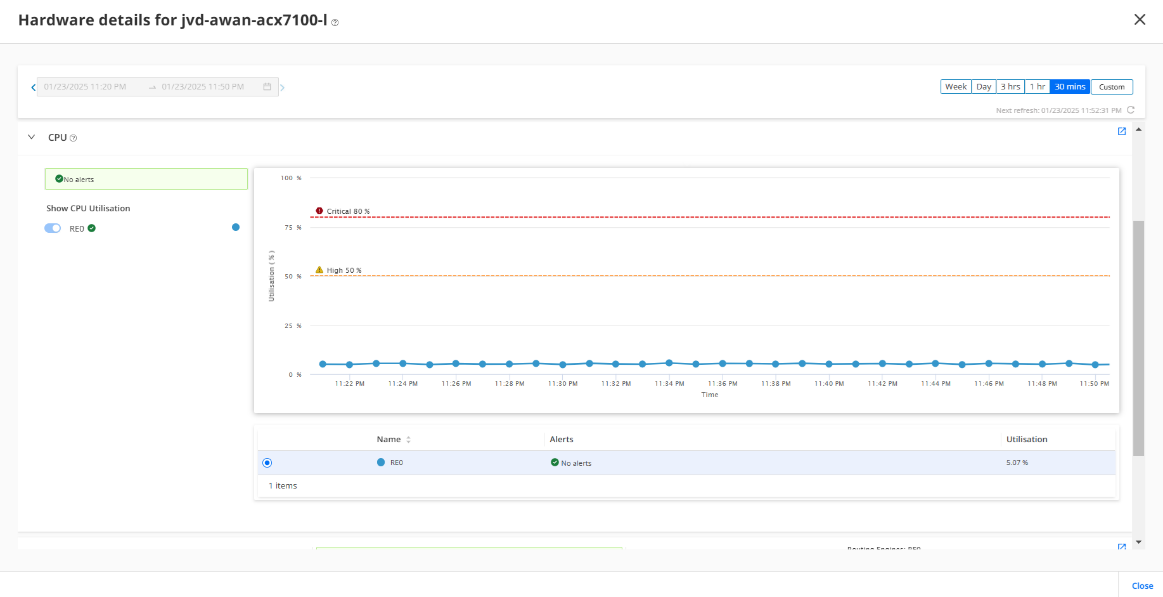
.png)
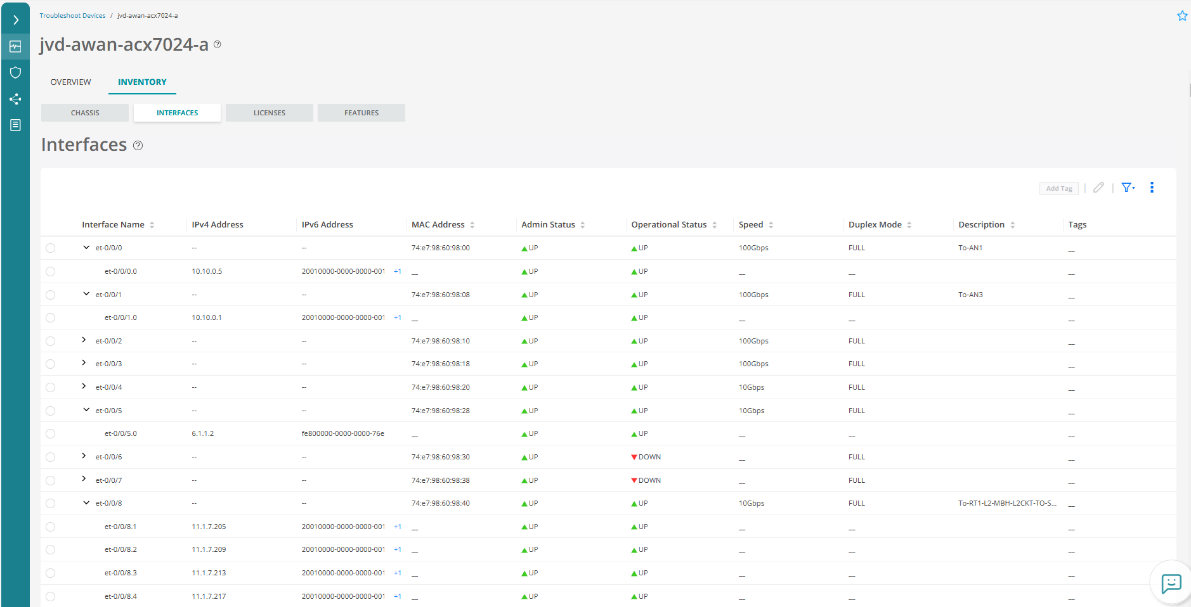
Interfaces Health
View the health of the device interfaces monitored by Paragon Automation.
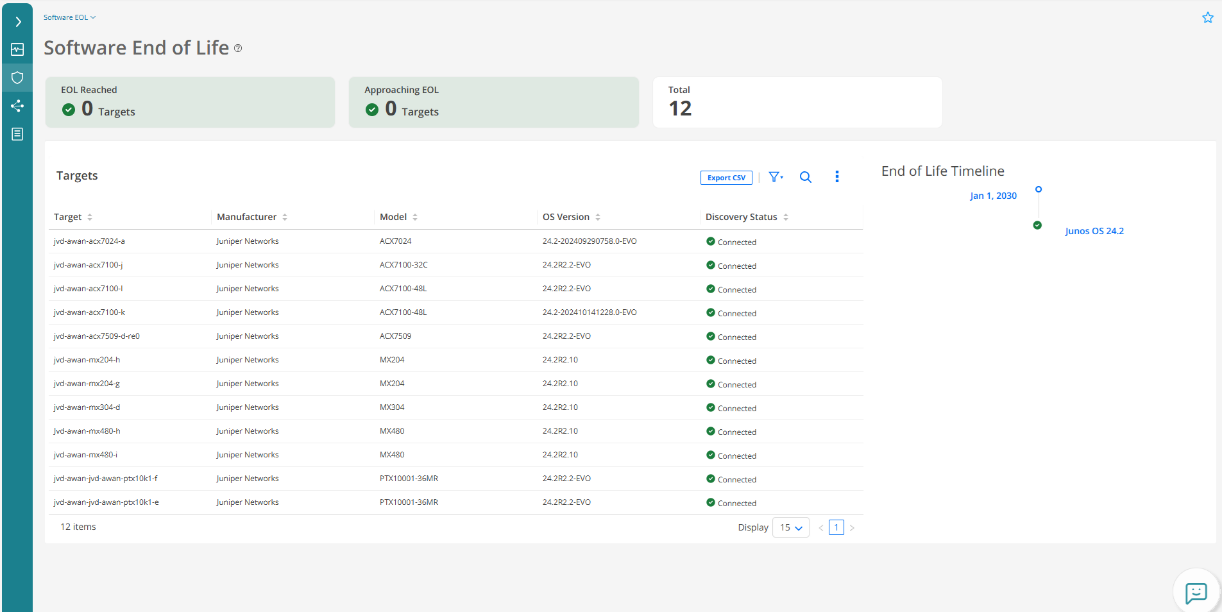
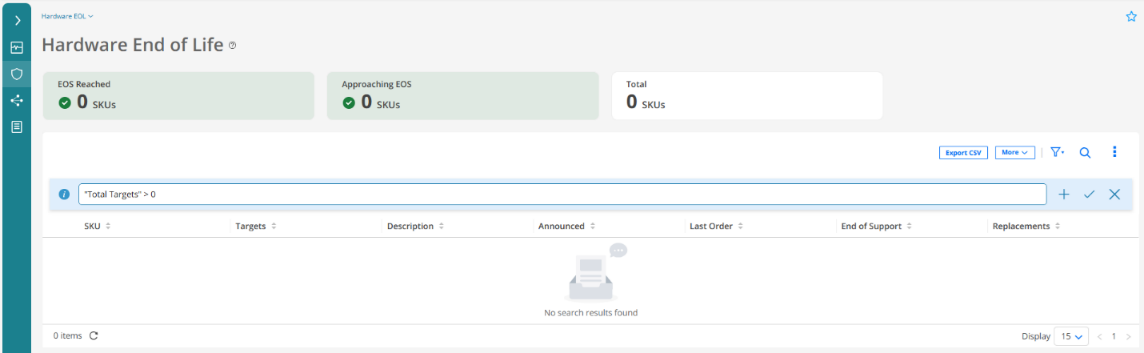
Software Life Cycle Management (Upgrades, EOL, Vulnerabilities)
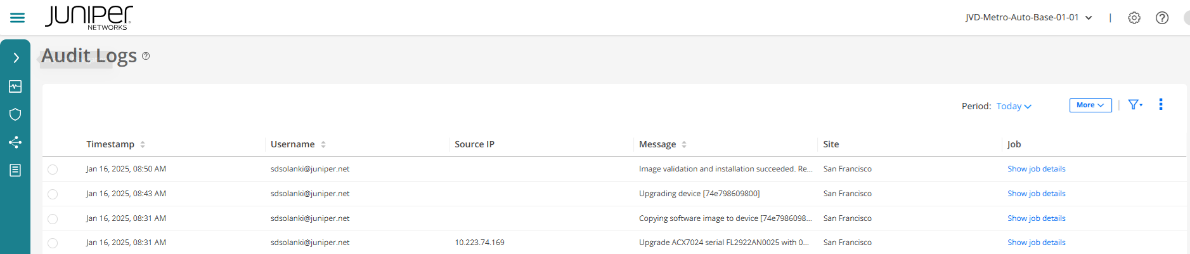
Paragon Automation manages software upgrades/downgrades. It displays the details of the OS installed on the device, a link to the OS documentation, and an option to upgrade the OS. The OS details include the OS version installed on the device, end-of-life information, active licenses, and the number of OS-related SIRT advisories. Software Images can be uploaded from local system via the Paragon application. To upload files larger than 2.5 GB, use the Upload Image REST API, instead of the GUI. In the Paragon Automation User Guide , there is a sample script (see "Sample Script" on page 315) that you can use to upload a software image using the Upload Image REST API.
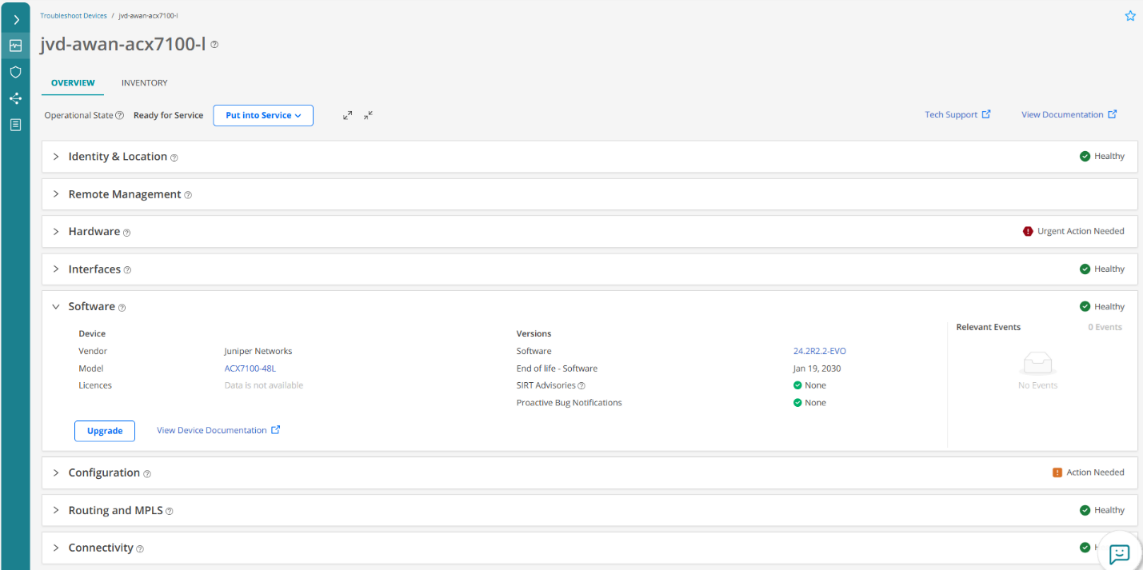
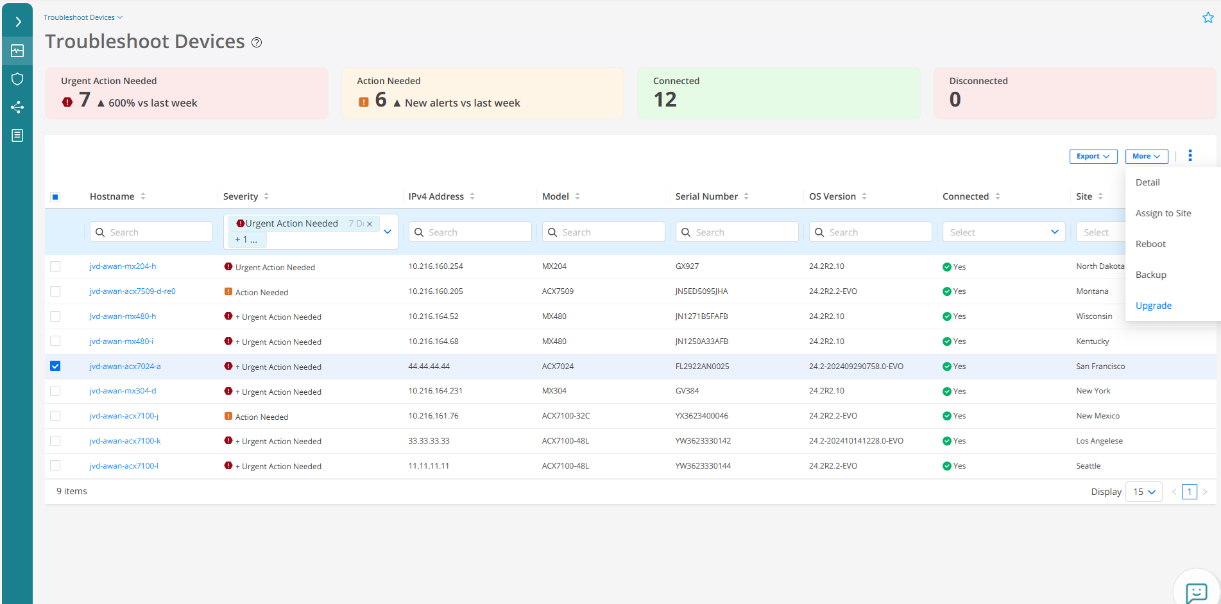
The following figures show a step-by-step guide for a software upgrade. Figure 60 shows a release installed in one of the Access nodes.
.png)
The following figures show how the image is uploaded to Paragon.
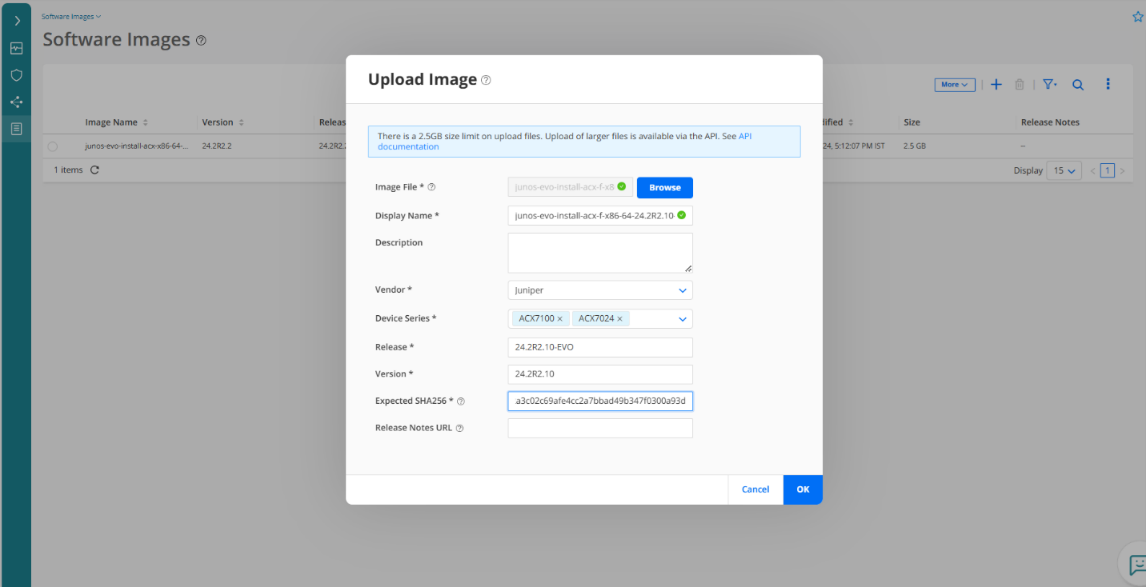
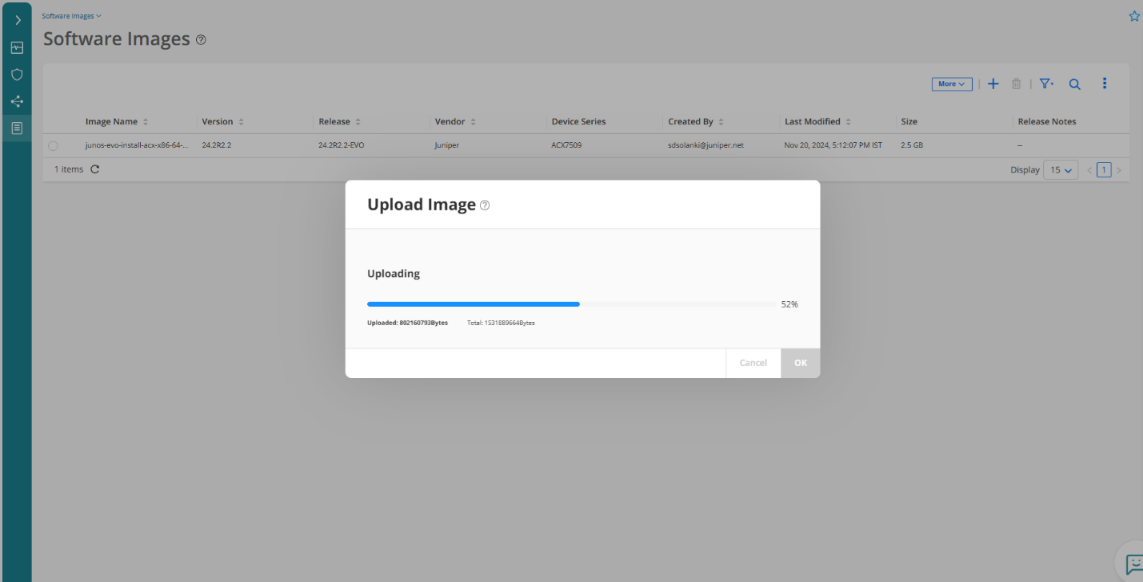
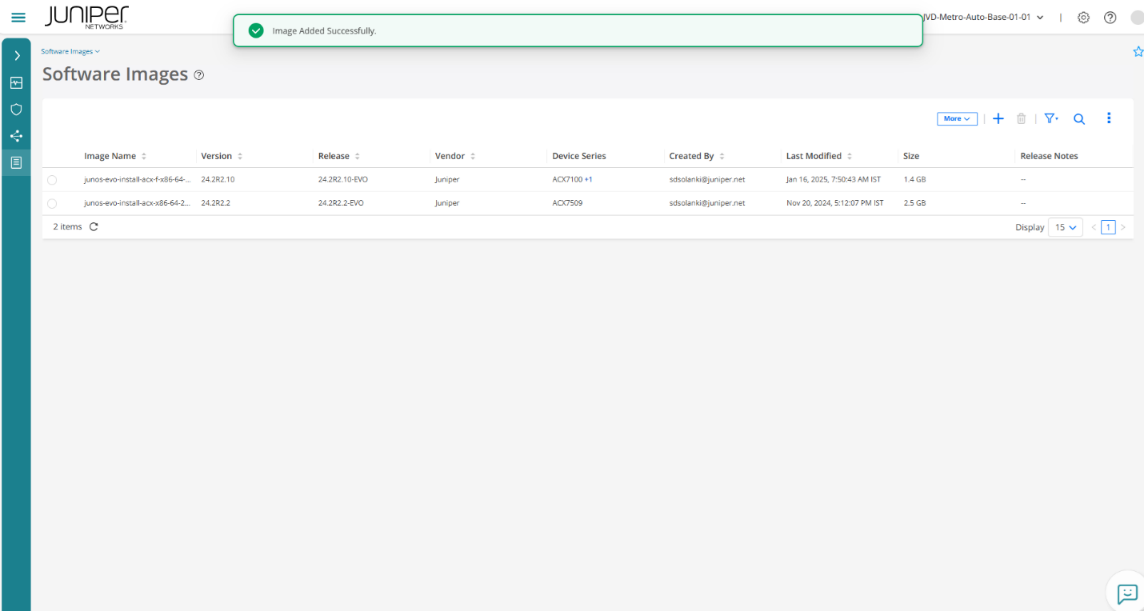
Figure 63 shows how the image is successfully uploaded to Paragon.
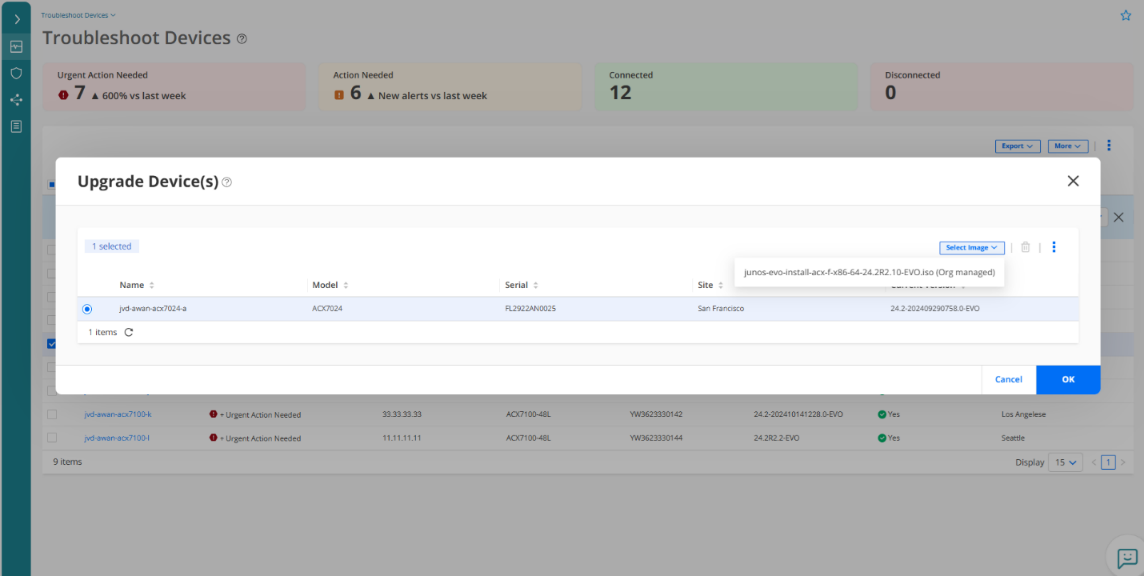
The following couple of figures show a selection of a device to perform an upgrade.
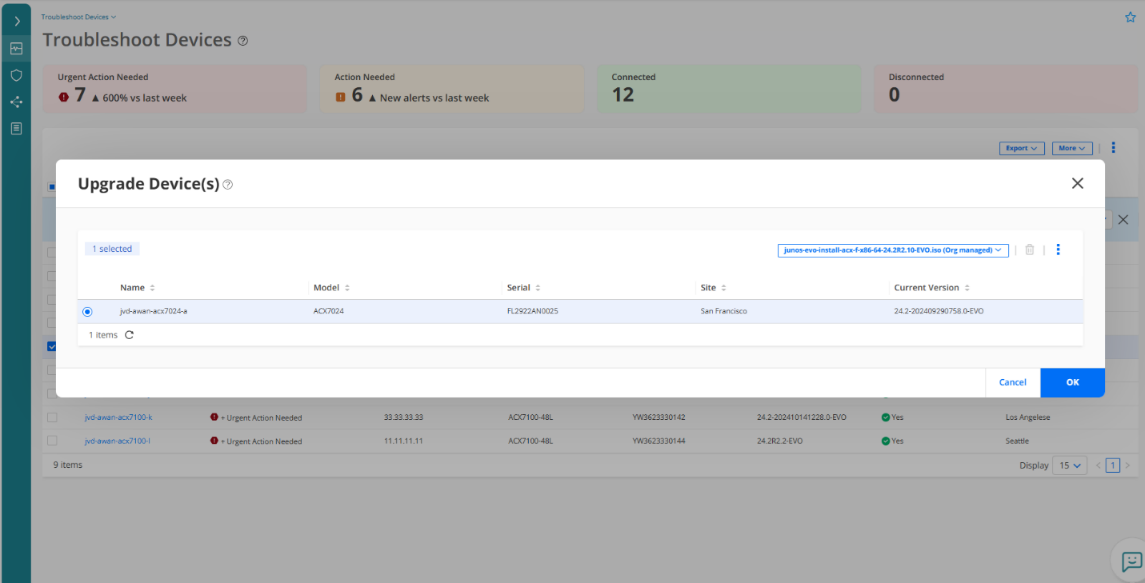
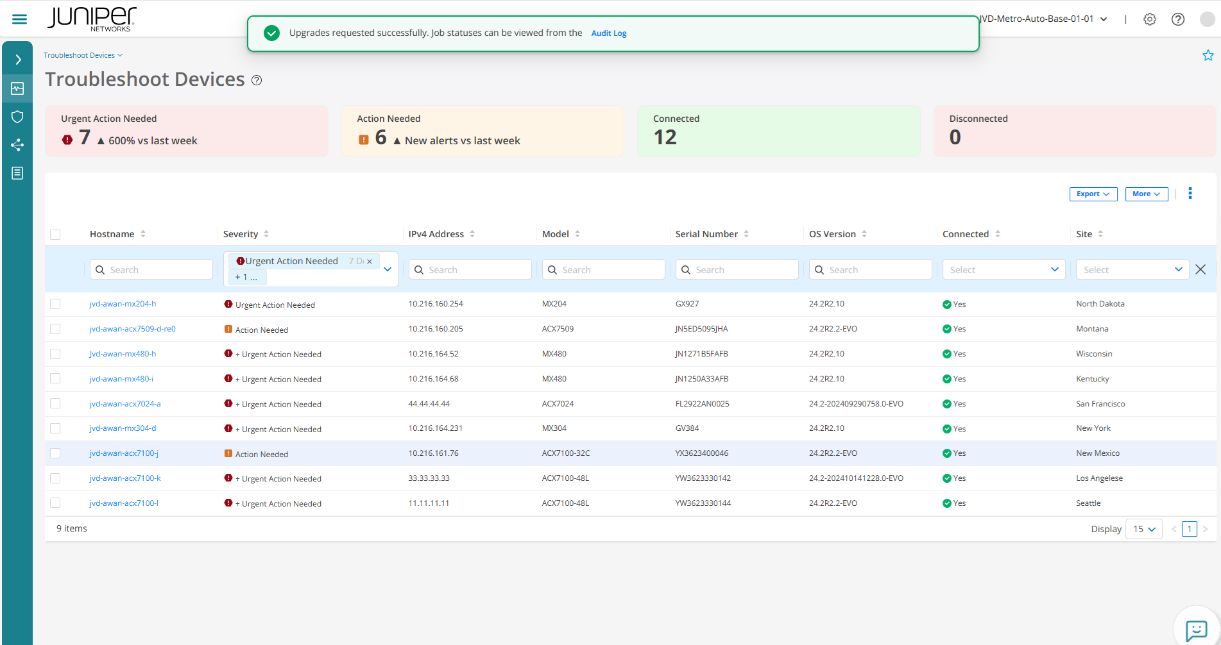
.png)
.png)
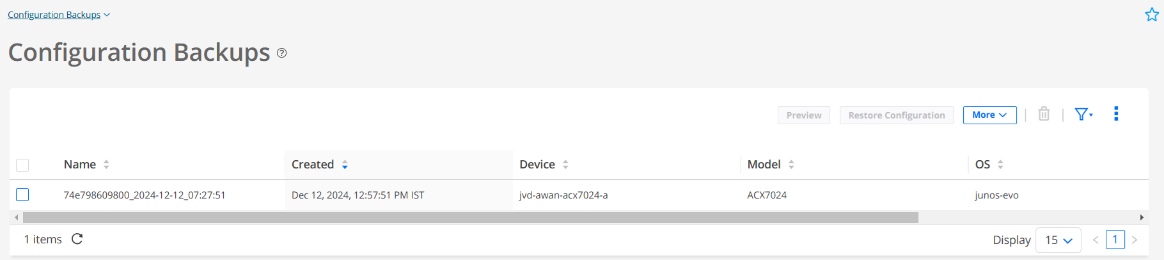
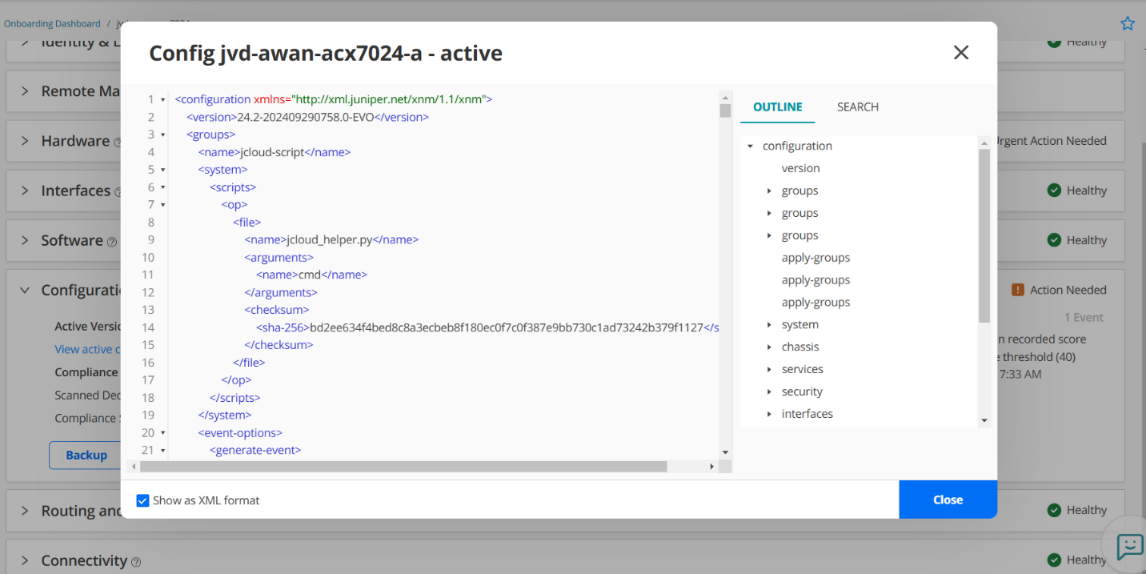
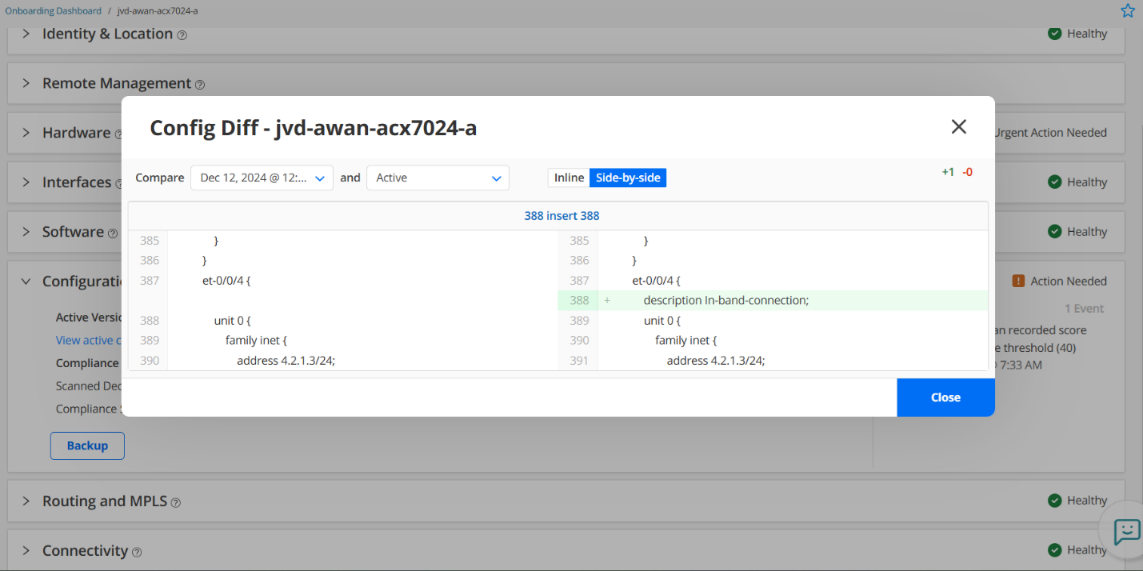
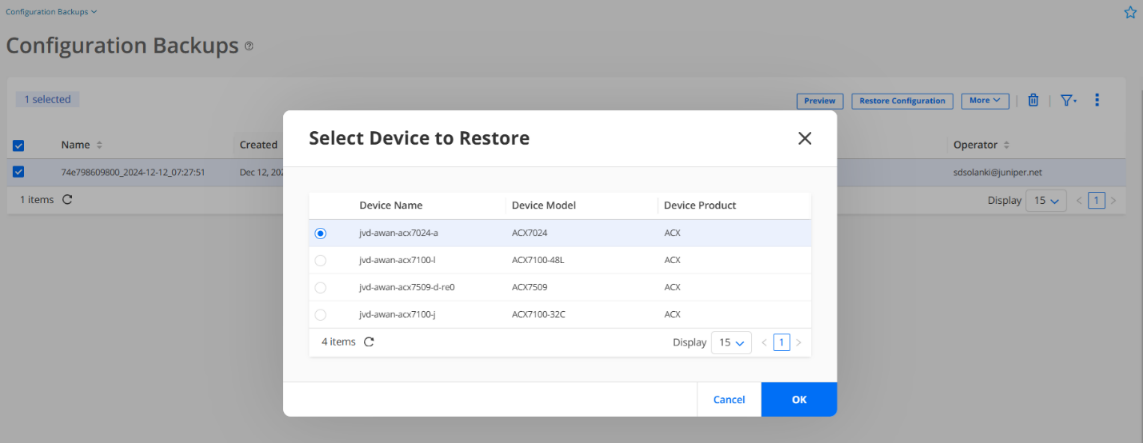
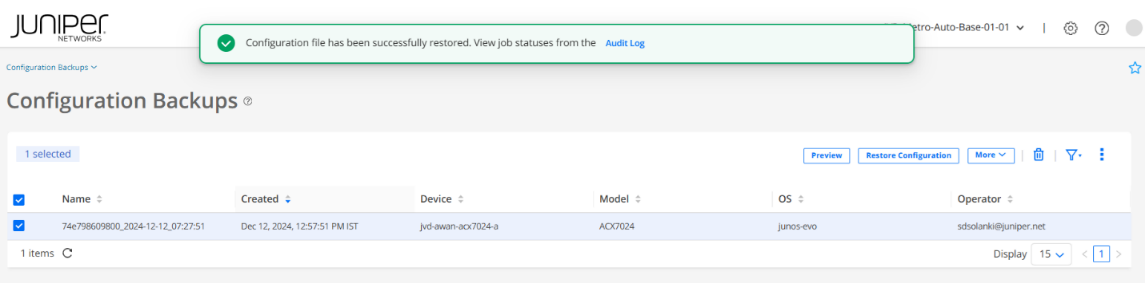
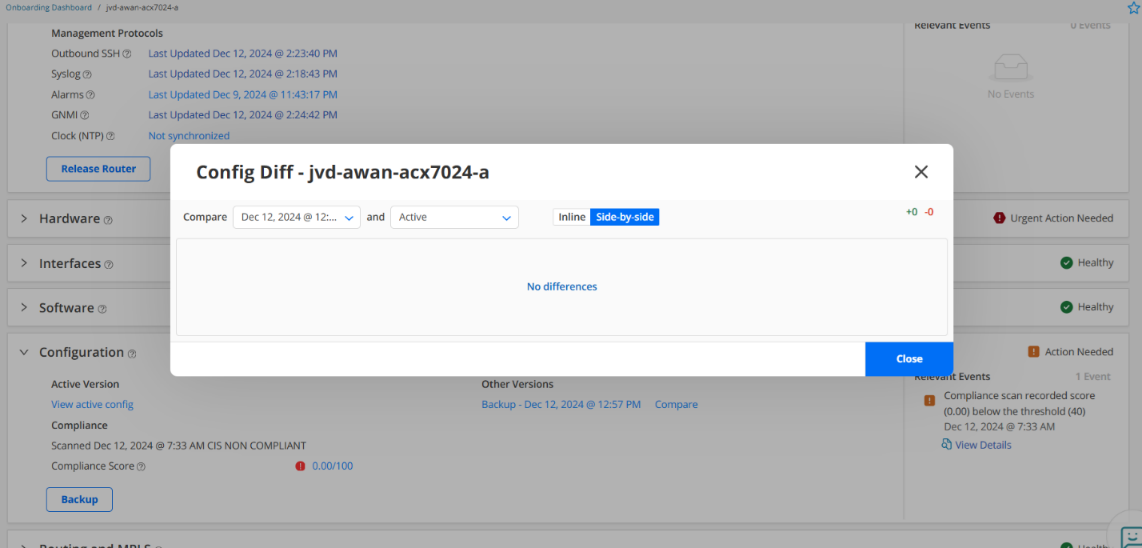
Configuration Management
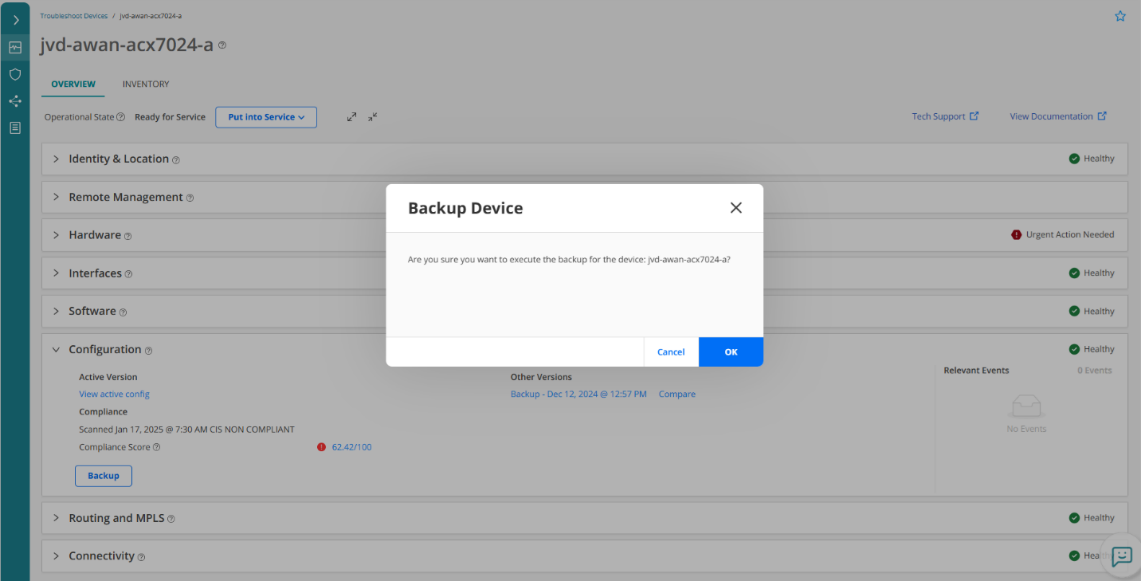
Paragon Automation manages the lifecycle of devices through various features like configuration backup and restore, comparison of different configuration versions, and deployment of configuration changes. The following figures explain the step-by-step procedure on how a device’s configuration can be backed up and restored.
Routing and MPLS Information
This accordion displays the total RIB and FIB routes of the onboarded device and validates that the expected numbers of entries are available in the routing and forwarding tables. It also validates that the peering states of all BGP, OSPF, IS-IS, RSVP, LSP, and LDP neighbors are healthy and without extensive flaps (however, this is out of scope in the current solution, since none of these protocols were configured by Paragon Automation).
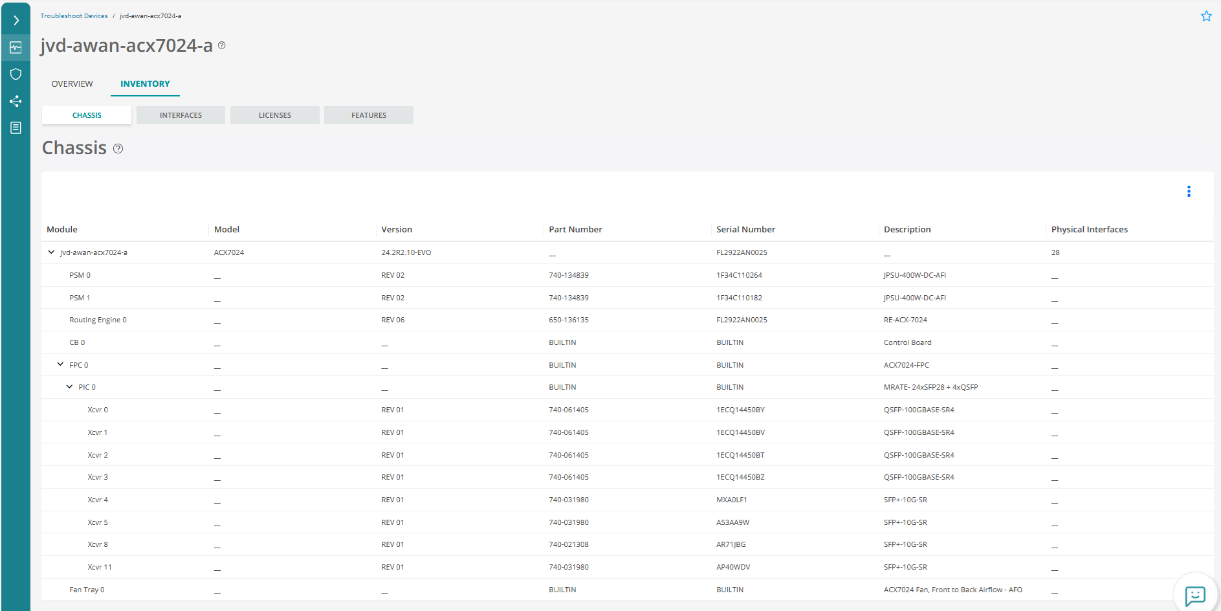
Device Inventory (Hardware Components)
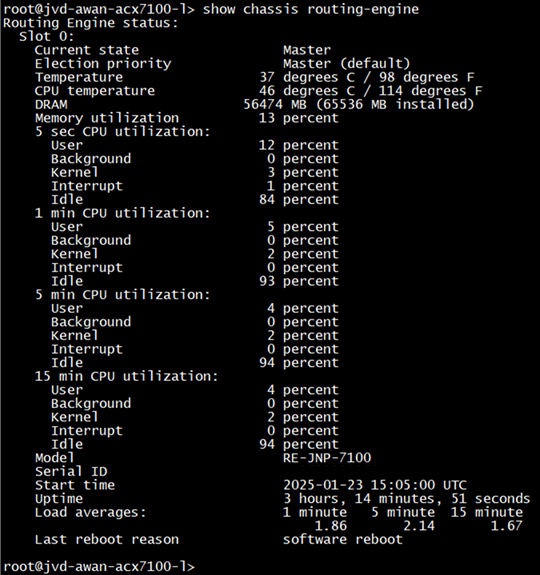
Use the Inventory tab to view a list of all the hardware components present on the chassis, and the number of associated physical interfaces, information on licenses applied on the device, and the features available on the licenses. You can also view general details about the hardware components such as model, serial, and part numbers. Everything is the same as from the terminal.
.png)
.png)
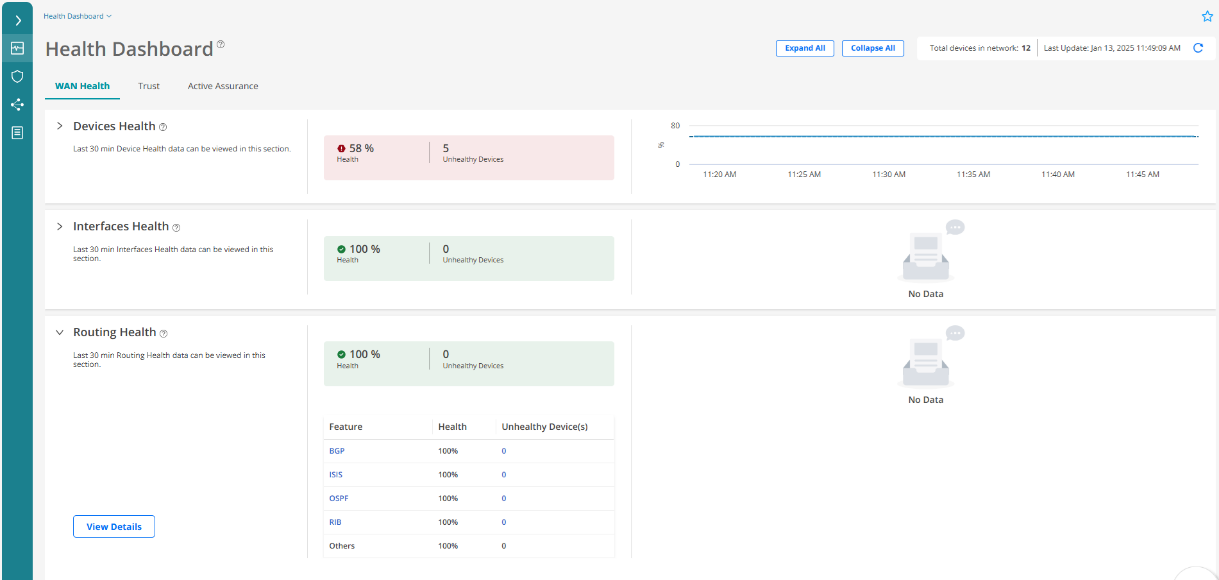
Health Dashboard
Use the Health Dashboard page to monitor network health-related data, and average trust score of the targets in the network in real-time. It helps us to view the health of devices, interfaces, routing components, and details of vulnerabilities in the network from this dashboard.
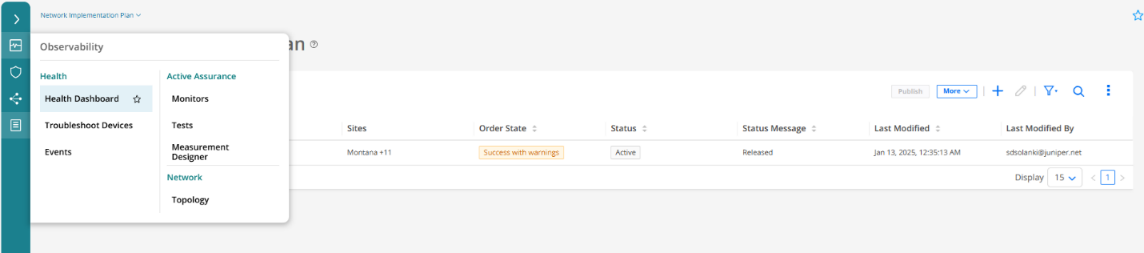
Figure 84 shows average health (in percentage) of devices, and the total number of unhealthy devices. The data displayed for healthy devices is calculated based on the number of devices that have an alert raised divided by the install base. Install base indicates the total number of devices that are available in the network. You can also view the percentage and health of the KPIs, and the total number of unhealthy devices in relation to that KPI that affects device health.
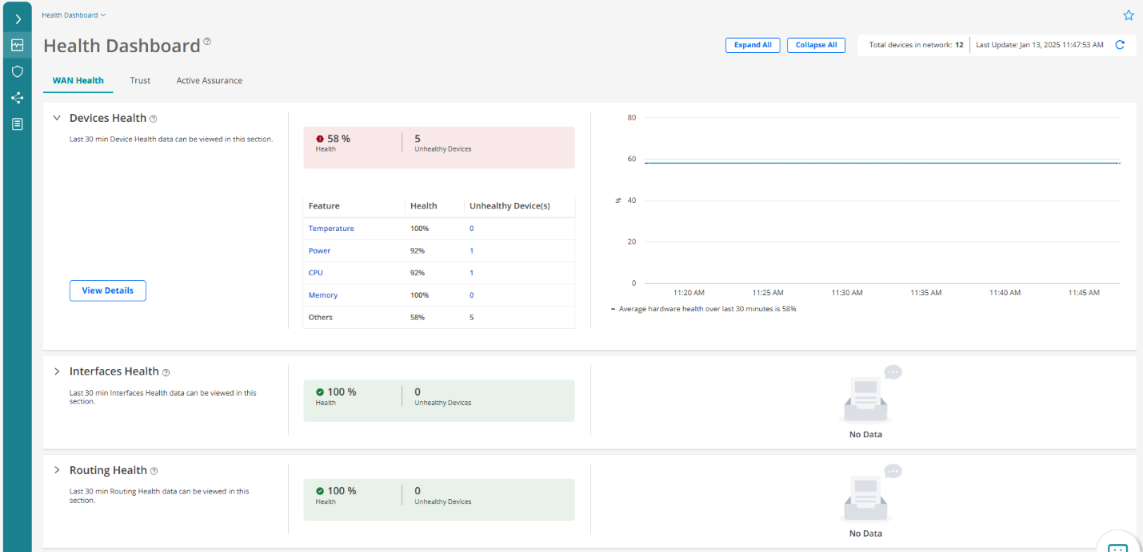
Figure 85 shows average health (in percentage) of the interfaces of the devices, and the total number of unhealthy devices. View the percentage and health of the KPIs that affect interface health, and the total number of unhealthy devices in relation to that KPI that affects interface health.
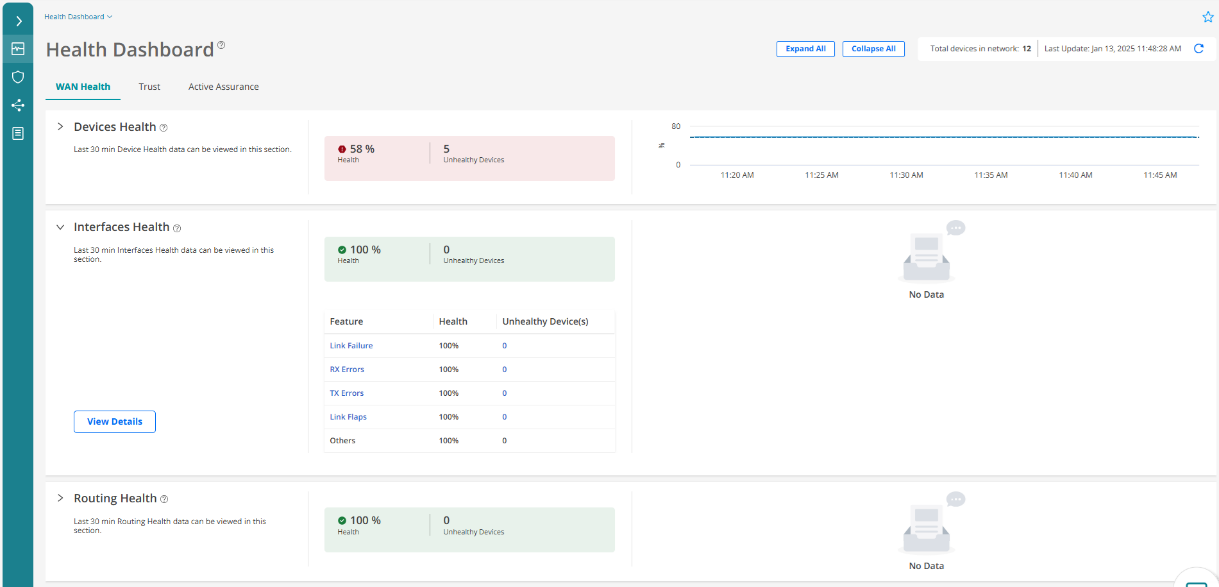
Figure 86 shows average routing health (in percentage) in relation to the number of devices, and the total number of unhealthy devices. View the percentage and health of the KPIs, and total number of unhealthy devices in relation to that KPI that affects routing health.
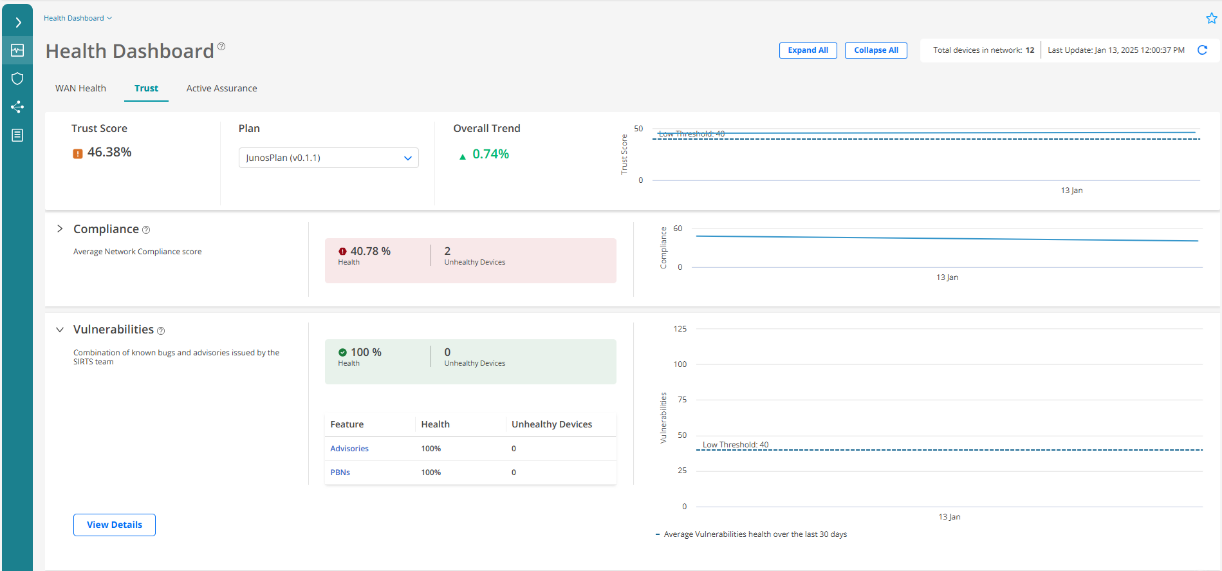
Device Compliance Status
Paragon Automation monitors the devices and software to ensure that they comply with the security rules that are defined in the benchmarking documents applied to the network. Paragon Automation alerts when a device does not comply with the rules in the benchmarks document.
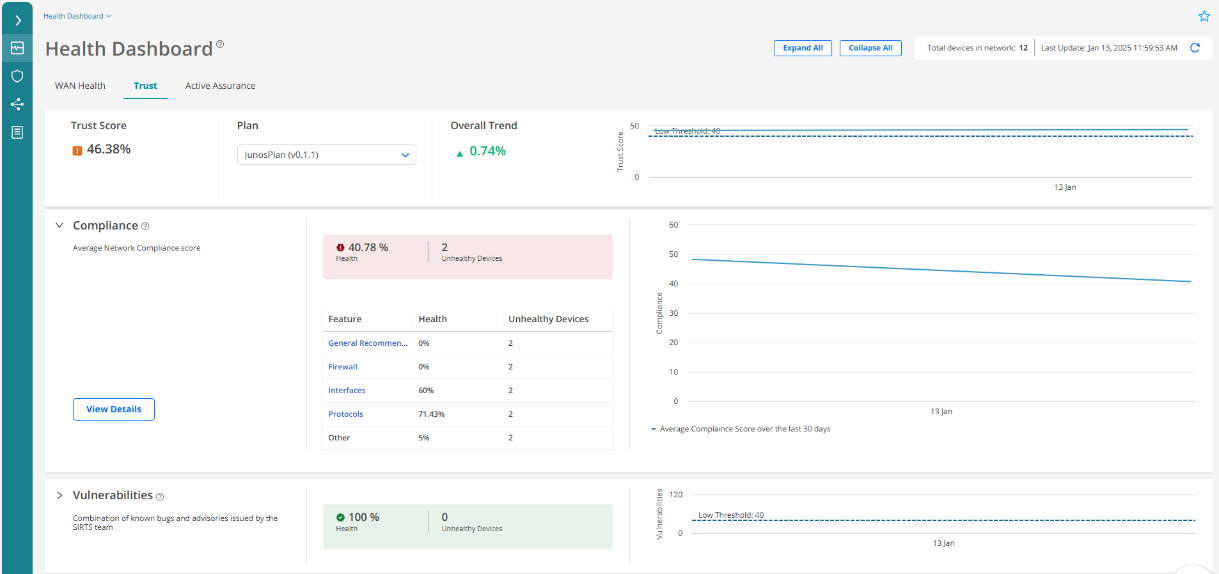
Device Vulnerabilities
The Vulnerabilities page lists all the SIRT advisories that Juniper Networks has published, the devices on the network affected by these advisories, and the common vulnerabilities and exposures.
Device Integrity
Paragon Automation periodically checks network devices' integrity, comparing them to the latest Juniper Networks hardware and software releases. It notifies when a device or software nears its End of Life (EOL), allowing proactive maintenance and replacement.