ON THIS PAGE
Results Summary and Analysis
CoS for LLQ JVD extends previous solutions with the focused delivery of differentiated services supporting ultra-low latency workloads. 5G O-RAN is an open and disaggregated RAN architecture that aims to enable interoperability, flexibility, and innovation among different vendors and operators.
The fronthaul is the most demanding segment of the xHaul architecture, requiring high performance and functionality. Comprehensive QoS in the 5G network architecture is mandatory to ensure reliable and efficient performance across diverse applications and services. QoS mechanisms prioritize traffic, manage bandwidth, and preserve latency budgets, ensuring critical applications receive the necessary resources and maintain overall network performance and user experience.
During the validation process, a robust solution is demonstrated for 5G xHaul transport infrastructure using Seamless MPLS with Segment Routing and EVPN-VPWS, EVPN-FXC, EVPN-ELAN, VPLS, L2Circuit, and L3VPN services. The JVD generates reasonable multi-vector scale of Layer 2 and Layer 3 connectivity services, meeting the expectations of Mobile Network Operators (MNOs) and Metropolitan Area Network (MAN) operators for real network deployments while satisfying strict SLA requirements.
ACX7024 (CSR), ACX7100-32C (HSR), and ACX7509 (HSR) as the DUT routers have each successfully passed all 581 test cases curated to support the reference architecture.
.png)
Class of Service Operations
The CoS model differs between operators. The model created in the validation of this profile is shared in the following table. However, this model might be modified to meet the requirements for a given implementation based on the characteristics of the operator’s traffic patterns and goals. In the table, the higher priority queues use a shaping rate (SR), and low-priority queues use a transmit rate (TR). For more information, see theScheduling section.
| Forwarding Classes | Scheduling Parameters | Classification and Rewrite | Traffic Profile | |||||
|---|---|---|---|---|---|---|---|---|
| Queue | Priority | BW Rate | Buffer | 802.1p | DSCP | EXP | Type | |
| FC-SIGNALING | 7 | Strict-High | 5% SR | 5% | 110 | CS5, CS6 | 110 | OAM aggressive timers, O-RAN/3GPP C-plane |
| FC-LLQ | 6 | Low-Latency | 40% SR | 10% | 100 | CS4, AF41, AF42, AF43 | 100 | CPRI RoE, eCPRI C/U-Plane ≤2000 bytes |
| FC-REALTIME | 5 | Medium-High | 30% SR | 20% | 101 | EF | 101 | 5QI/QCI Group 1 low-latency U-plane, low-latency business. Interactive video, low latency voice |
| FC-HIGH | 4 | Low | 40% TR | 30% | 011 | CS3, AF31, AF32, AF33 | 011 | 5QI/QCI Group 2 medium latency U-plane data |
| FC-CONTROL | 3 | High | 5% SR | 5% | 111 | CS7 | 111 | Network control: OAM relaxed timers, IGP, BGP, PTP aware mode |
| FC-MEDIUM | 2 | Low | 30% TR | 20% | 010 | CS2, AF21, AF22, AF23 | 010 | 5QI/QCI Group 3 remainder GBR U-plane guaranteed business data. Video-on-demand. O-RAN/3GPP M-plane, e.g., eCPRI M-plane, other management, software upgrades |
| FC-LOW | 1 | Low | 20% TR | 10% | 001 | CS1, AF11, AF12, AF13 | 001 | high latency, guaranteed low-priority data |
| FC-BEST-EFFORT | 0 | Low | remainder | remainder | 000 | BE | 000 | 5QI/QCI Group 4 – remainder non-GBR U-plane data |
The validation includes three styles of ingress classification: fixed, behavior aggregate, and multifield classifier. BA is packet-based, where flows are pre-marked with Layer 3 DSCP, Layer 2 802.1Q Priority Code Points (PCP), or MPLS EXP. Fixed classification is context-based, where all traffic arriving on a specific interface is mapped to one forwarding class. Multifield (MF) Classification allows matching criteria within packet fields and mapping to one or more forwarding classes.
A crucial goal of the JVD is the validation of CoS functional operations, ensuring that traffic is properly matched (classified) and placed into an appropriate forwarding class to be scheduled for egress transmission. O-RAN or 3GPP proposes a minimum of six queues and a maximum of eight queues per interface. For the JVD, eight queues and associated forwarding classes are used to accommodate the traffic scheme requirements. In supporting Profile-B, multiple PQs are used, which are shaped (PIR) to prevent starving lower priority queues. In parallel, four WFQs are created with low priority and transmit rate bandwidth assigned by a percentage of the remaining port speed. A final low-priority queue is given the remainder without guaranteed bandwidth.
At egress, DSCP, 802.1p or EXP codepoints, and packet loss priorities (PLP) are rewritten based on the assigned forwarding class and rewrite-rule instruction. ACX supports rewriting the outer tag, which is the default and commonly preferred to preserve the inner (C-TAG) 802.1p bits for transparent transmission.
.png)
The following table summarizes the three classification and rewrite operations, resulting in the preservation of the CoS priority bits. Services include EVPN-VPWS, EVPN Flexible Cross Connect (FXC), L2Circuit, VPLS, EVPN-ELAN, EVPN IRB Virtual Gateway Address (VGA) active-active ESI to L3VPN, and Layer 2 Bridge Domain with Anycast IRB to L3VPN. The table also share information about the services validated for each classification type. The final section of Table 2 involves test scenarios where specific traffic types (eCPRI, PTP, and OAM) are sent, and multifield classifiers are used to match the packet header fields to be given desired priority.
In addition, the validation ensures that the priority hierarchies are honored. Irrespective of whether fixed, BA, or multifield classifiers are used, traffic is validated to be mapped to the proper priority queue. The checkmarks under LLQ (low-latency), SH (strict-high), H (high), MH (medium-high), and L (low) confirm that the scheduler rates defined in Table 1 are honored. This ensures traffic rates can be guaranteed (CIR) regardless of the priority level with proper configuration. The dashed lines represent scenarios not applicable to the test conditions.
For example, Fixed classification is applied at the ingress interface irrespective of packet codepoints received. Traffic is verified to traverse the correct egress queue (Queue Match) and is confirmed again with the correct EXP ingress BA classification at the next hop.
In the table, Scheduler Rates Honored confirms the expected bandwidth allocation of queues utilizing shaping or transmit rate behaviors as outlined previously. Codepoints Rewritten validates whether an expected DSCP, 802.1p, or EXP rewrite operation is successful. This is dependent on the protocol type at the position of the network. Bits Preserved confirms that the expected codepoints of the outer or inner tag are recorded properly. Packet captures are taken to confirm.
All CoS functional test case scenarios passed successfully during the execution. For more information, see the Test Report or contact your Juniper representative.
| Traffic Scenario | Ingress Classification Mapped to FC | Scheduler Rates Honored | Codepoints Rewritten | Bits Preserved | ||||||||
|---|---|---|---|---|---|---|---|---|---|---|---|---|
| Fixed Classifier | Queue Match | EXP | LLQ | SH | H | MH | L | 802.1p | DSCP | EXP | E2E | |
|
EVPN-VPWS |
✓ |
✓ |
✓ |
-- |
-- |
-- |
-- |
✓ |
-- |
✓ |
✓ |
|
|
EVPN-FXC |
✓ |
✓ |
✓ |
-- |
-- |
-- |
-- |
✓ |
-- |
✓ |
✓ |
|
|
L2Circuit |
✓ |
✓ |
-- |
-- |
-- |
-- |
✓ |
✓ |
-- |
✓ |
✓ |
|
|
EVPN IRB VGA with L3VPN MH |
✓ |
✓ |
-- |
-- |
-- |
✓ |
-- |
✓ |
-- |
✓ |
✓ |
|
|
BD IRB anycast static MAC/IP with L3VPN |
✓ |
✓ |
-- |
-- |
-- |
✓ |
-- |
✓ |
-- |
✓ |
✓ |
|
| BA Classifier | 802.1p | DSCP | EXP | LLQ | SH | H | MH | L | 802.1p | DSCP | EXP | E2E |
| EVPN-VPWS |
✓ |
-- |
✓ |
-- |
✓ |
✓ |
✓ |
✓ |
✓ |
-- |
✓ |
✓ |
| EVPN-FXC |
✓ |
-- |
✓ |
-- |
✓ |
✓ |
✓ |
✓ |
✓ |
-- |
✓ |
✓ |
| EVPN-ELAN |
✓ |
-- |
✓ |
-- |
✓ |
✓ |
✓ |
✓ |
✓ |
-- |
✓ |
✓ |
| EVPN IRB anycast with L3VPN MH |
✓ |
-- |
✓ |
✓ |
✓ |
✓ |
✓ |
✓ |
✓ |
-- |
✓ |
✓ |
| L3VPN |
-- |
✓ |
✓ |
-- |
✓ |
✓ |
✓ |
✓ |
✓ |
✓ |
✓ |
✓ |
| VPLS |
✓ |
-- |
✓ |
-- |
-- |
-- |
-- |
✓ |
-- |
-- |
✓ |
✓ |
| BD IRB anycast static MAC/IP with L3VPN |
✓ |
-- |
✓ |
-- |
✓ |
✓ |
✓ |
✓ |
✓ |
-- |
✓ |
✓ |
| Multifield Classifier | Packet Match | EXP | LLQ | SH | H | MH | L | 802.1p | DSCP | EXP | E2E | |
| Traffic Type: eCPRI |
✓ |
✓ |
✓ |
-- |
-- |
-- |
-- |
-- |
-- |
✓ |
✓ |
|
| Traffic Type: PTP |
✓ |
✓ |
✓ |
-- |
-- |
-- |
-- |
-- |
-- |
✓ |
✓ |
|
| Traffic Type: OAM |
✓ |
✓ |
✓ |
-- |
-- |
-- |
-- |
-- |
-- |
✓ |
✓ |
|
As shown above, BA services included multiple traffic classes with checkmarks across multiple priority queues. In this condition, there is contention for bandwidth resources. By including a shaping rate to prevent priority queues from starving the low-priority queues, you can ensure bandwidth reserves are available to service all queues.
Multifield classifiers are used to match specific traffic based on packet header information to be mapped into a desired forwarding class. For example, eCPRI traffic is identified by EtherType 0xAEFE and PTP by EtherType 0x88F7. For more information about multifield classifier match conditions and results, including packet captures, see the Test Report.
For brevity, only one low-priority (L) queue is shown in the table above. However, the complete model includes four low-priority queues. After priority queues with shaping rate deduct the expected bandwidth, the remaining bandwidth defines the port speed that is utilized for the low priority queues using transmit rate percentages. The percentage allocation remains consistent based on this updated port speed.
Congestion Scenarios
The validation includes a variety of congestion scenarios, which are outlined in the Test Objectives section. Congestion constitutes one or more conditions where traffic exceeds the configured scheduler transmit rate, shaped rate, or port speed and results in an expected traffic loss. The major objective is to ensure critical priority traffic is uninterrupted even during periods of congestion and that during congestion, high-priority delay-sensitive traffic is given preference.
During key congestion events, the following observations are recorded. For more information, see the full test report:
- Low-latency queue (FC-LLQ) is serviced ahead of strict-high, high, medium-high, medium-low, and low priority queues and given preferential treatment to preserve the latency budget. FC-LLQ does not exceed the defined allowance when a shaping rate is configured.
- Strict-high queue (FC-SIGNALING) is serviced ahead of high, medium-high, medium-low, and low queues. FC-SIGNALING does not exceed the defined allowance when a shaping rate is configured.
- High queue (FC-CONTROL) is serviced ahead of medium-high, medium-low, and low queues. FC-CONTROL does not exceed the defined allowance when a shaping rate is configured.
- Medium-high queue (FC-REALTIME) is serviced ahead of medium-low and low queues. FC-REALTIME does not exceed the defined allowance when a shaping rate is configured.
- Low-priority queues (FC-HIGH, FC-MEDIUM, and FC-LOW) are serviced based on configured transmit rate percentages of the remaining port speed. Low-priority queues are serviced as WFQ when operating in excess of the transmit rate and bandwidth is available.
- Low-priority remainder queue (FC-BEST-EFFORT) is serviced only when unused bandwidth is available based on the intentionality of the scheduler configuration.
- During high congestion periods, queues operating within their configured bandwidth (in-profile) are guaranteed without packet drops.
- Critical eCPRI or ORAN traffic flows are assigned to priority queues and meet the given SLAs.
- Scheduler percentages correctly inherit the configured port-shaper as port speed.
- Queue shaping rate is deducted from total port speed with transmit-rates applied to the remaining bandwidth.
- Priority hierarchies are honored across and within VPN services that share common links.
- Traffic is transmitted up to 99% port speed under normal conditions where multi-level priorities are validated.
- Latency results are always measured in microseconds (µs).
Latency Budget Validation
5G xHaul infrastructure defines strict latency budgets, particularly in the fronthaul segment. O-RAN WG9 technical specification (O-RAN.WG9.XTRP-REQ-v01.00) for transport requirements provides guidelines for a maximum one-way latency budget of 100µs for the fronthaul. This budget includes latency incurred by the fiber runs at approximately 4.9µs/km and transit nodes. The objective of the JVD is to deliver a solution with latency performance within the acceptable range from O-RU to O-DU, approximately ≤10µs per node. The ACX7000 platforms selected for CSR and HSR roles are shown to consistently achieve an average transit latency of ≤4-6µs. In addition, the ability to preserve an objective latency budget for priority flows during conditions of congestion. This is a significant paradigm shift from the requirements of earlier 4G architectures.
When measuring a traffic delay, there should not be any traffic dropping from the queue under test since this invalidates the goal of capturing transit latency. The best measure of individual device performance is shown by the standalone topology 1. Additional topologies provide key insight into the overall network performance. Three permutations for each CSR and HSR device type are validated.
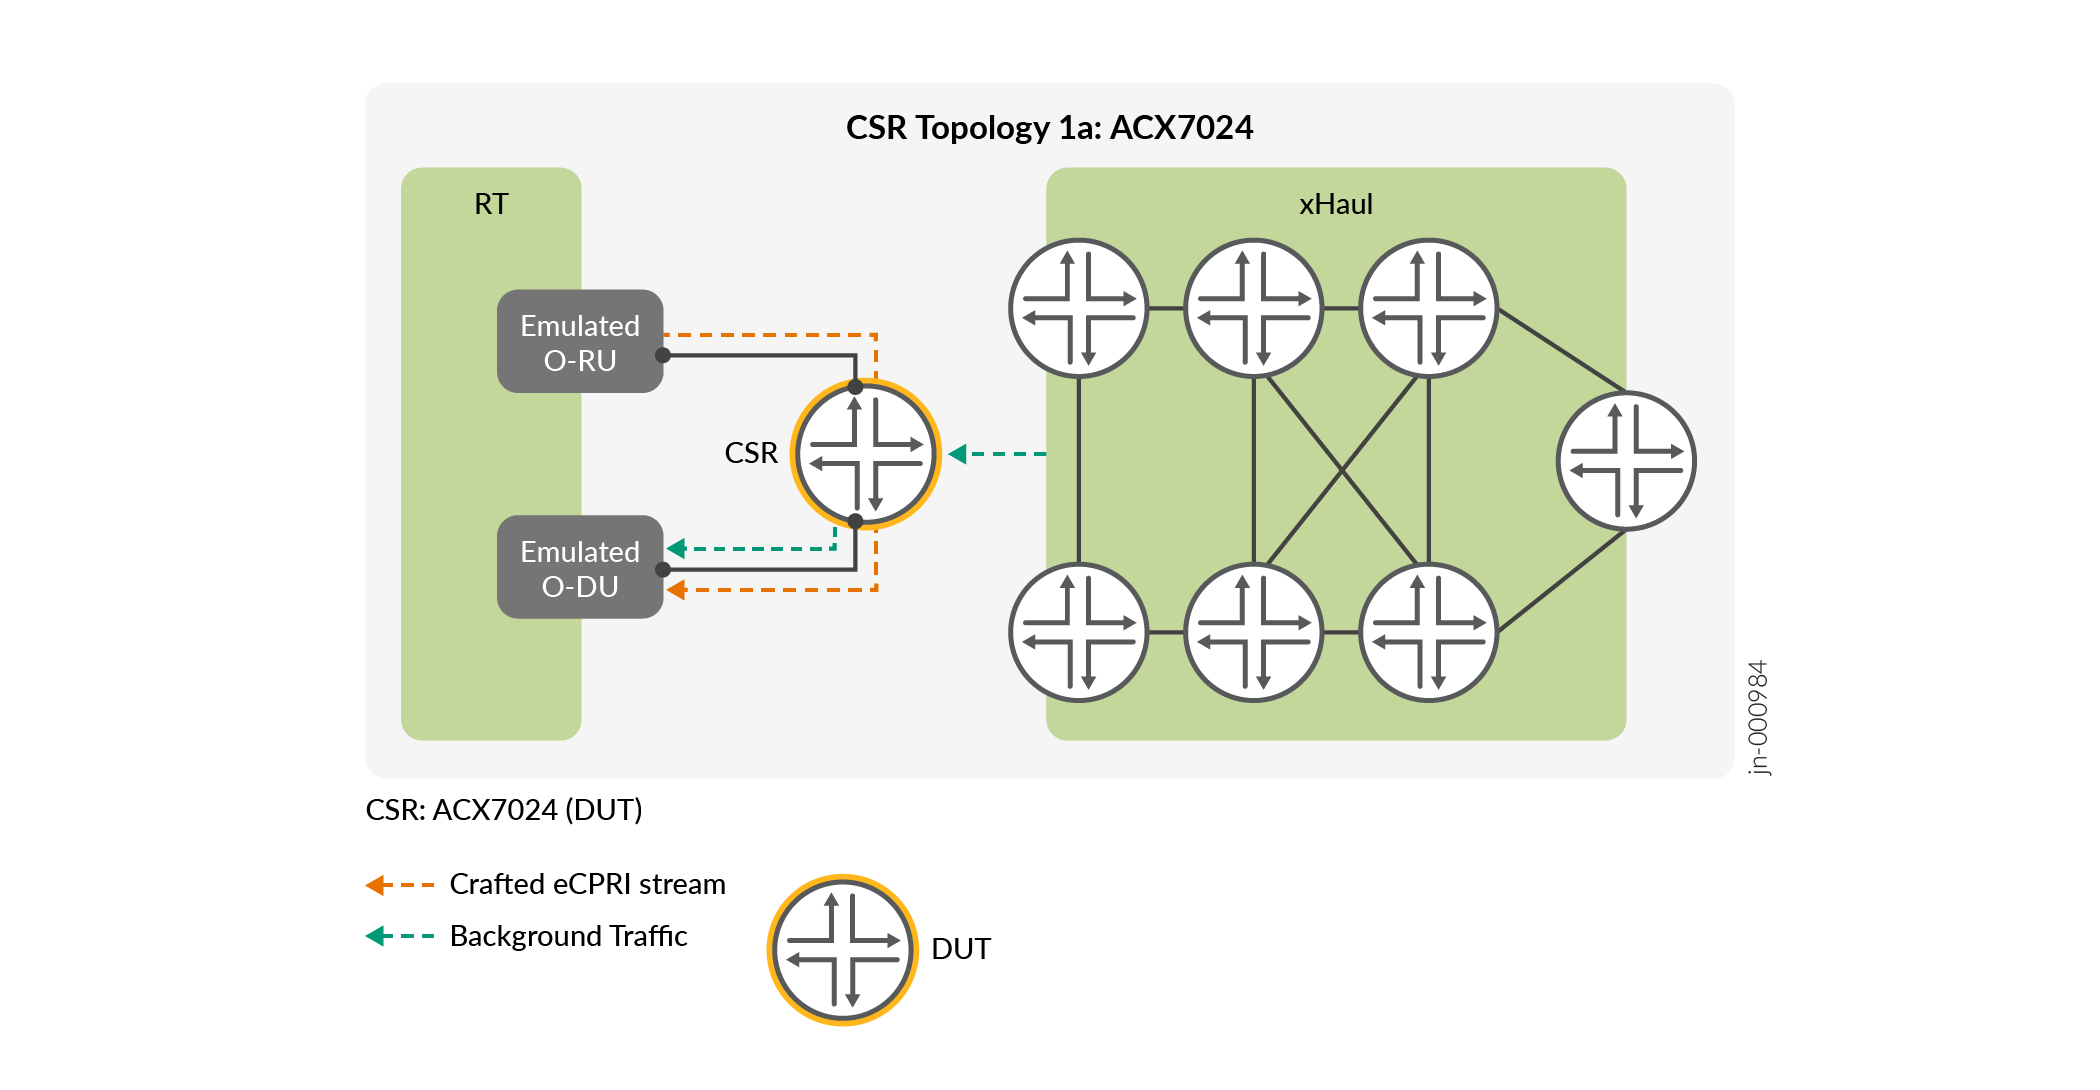
Topology 1a: ACX7024
Topology 1a (Figure 3) is used to validate the performance of the ACX7024 platform in the CSR role. The test equipment emulates O-RU and O-DU devices and does not include self-latency. For each scenario, the results are provided across different frame sizes with either continuous or burst traffic patterns. Latency is measured in microseconds (µs).
The following table describes the ACX7024 performance when traffic is sent only to the low-latency queue without background traffic. No queues are congested during this time.
| Queue Name | Queue Priority | Min (µs) Latency | Ave (µs) Latency | Max (µs) Latency | Frame Size | Traffic Pattern | Port Speed |
|---|---|---|---|---|---|---|---|
|
FC-LLQ |
Low-Latency |
5.83 |
6.18 |
9.54 |
64 |
continuous |
10G |
|
FC-LLQ |
Low-Latency |
5.78 |
6.13 |
9.55 |
512 |
continuous |
10G |
|
FC-LLQ |
Low-Latency |
5.09 |
5.31 |
6.61 |
1500 |
continuous |
10G |
The following table includes continuous background traffic up to 99%-line rate with encapsulation overhead considerations for Topology 1a with ACX7024. The performance of the low-latency queue (FC-LLQ) is measured in conjunction with multi-level priority queues. From the results, you can see that LLQ is given preferential treatment for latency constraints. In these scenarios, lower priority queues are also maintained below 10µs average latency goal.
| Queue Name | Queue Priority | Min (µs) Latency | Ave (µs) Latency | Max (µs) Latency | Frame Size | Traffic Pattern | Port Speed |
|---|---|---|---|---|---|---|---|
| FC-LLQ | Low-Latency | 5.09 | 5.43 | 12.95 | 64 | continuous | 10G |
| FC-SIGNALING | Strict-High | 5.09 | 6.94 | 52.72 | 64 | continuous | 10G |
| FC-CONTROL | High | 5.01 | 6.36 | 20.40 | 64 | continuous | 10G |
| FC-REALTIME | Medium-High | 5.08 | 6.24 | 24.66 | 64 | continuous | 10G |
| FC-HIGH | Low | 5.09 | 6.68 | 39.37 | 64 | continuous | 10G |
| FC-MEDIUM | Low | 5.09 | 7.05 | 51.91 | 64 | continuous | 10G |
| FC-LOW | Low | 5.09 | 6.94 | 52.72 | 64 | continuous | 10G |
| FC-LLQ | Low-Latency | 5.77 | 5.96 | 10.10 | 512 | continuous | 10G |
| FC-SIGNALING | Strict-High | 5.77 | 6.10 | 12.40 | 512 | continuous | 10G |
| FC-CONTROL | High | 5.76 | 6.26 | 17.33 | 512 | continuous | 10G |
| FC-REALTIME | Medium-High | 5.78 | 6.43 | 21.05 | 512 | continuous | 10G |
| FC-HIGH | Low | 5.78 | 6.40 | 19.31 | 512 | continuous | 10G |
| FC-MEDIUM | Low | 5.78 | 6.10 | 25.61 | 512 | continuous | 10G |
| FC-LOW | Low | 5.78 | 6.32 | 23.38 | 512 | continuous | 10G |
| FC-LLQ | Low-Latency | 5.83 | 6.06 | 11.23 | 1500 | continuous | 10G |
| FC-SIGNALING | Strict-High | 5.84 | 6.08 | 13.48 | 1500 | continuous | 10G |
| FC-CONTROL | High | 5.84 | 6.10 | 16.25 | 1500 | continuous | 10G |
| FC-REALTIME | Medium-High | 5.81 | 6.36 | 22.66 | 1500 | continuous | 10G |
| FC-HIGH | Low | 5.87 | 6.07 | 34.26 | 1500 | continuous | 10G |
| FC-MEDIUM | Low | 5.87 | 6.06 | 30.42 | 1500 | continuous | 10G |
| FC-LOW | Low | 5.87 | 6.07 | 32.43 | 1500 | continuous | 10G |
The following table includes burst traffic type rather than continuous for Topology 1a with ACX7024, measuring the performance of the low-latency queue (FC-LLQ) in conjunction with multi-level priority queues. From the results, you can see that LLQ is given preferential treatment for latency constraints. In these scenarios, lower priority queues are also maintained well below the 10µs average latency goal.
| Queue Name | Queue Priority | Min (µs) Latency | Ave (µs) Latency | Max (µs) Latency | Frame Size | Traffic Pattern | Port Speed |
|---|---|---|---|---|---|---|---|
| FC-LLQ | Low-Latency | 5.82 | 5.91 | 6.38 | 64 | burst | 10G |
| FC-SIGNALING | Strict-High | 5.82 | 5.99 | 9.69 | 64 | burst | 10G |
| FC-CONTROL | High | 5.86 | 5.91 | 7.61 | 64 | burst | 10G |
| FC-REALTIME | Medium-High | 5.83 | 5.91 | 8.18 | 64 | burst | 10G |
| FC-HIGH | Low | 5.87 | 5.91 | 6.71 | 64 | burst | 10G |
| FC-MEDIUM | Low | 5.87 | 5.91 | 6.46 | 64 | burst | 10G |
| FC-LOW | Low | 5.87 | 5.91 | 9.13 | 64 | burst | 10G |
| FC-LLQ | Low-Latency | 5.77 | 5.80 | 6.21 | 512 | burst | 10G |
| FC-SIGNALING | Strict-High | 5.77 | 5.87 | 11.39 | 512 | burst | 10G |
| FC-CONTROL | High | 5.69 | 5.87 | 7.72 | 512 | burst | 10G |
| FC-REALTIME | Medium-High | 5.77 | 5.87 | 9.55 | 512 | burst | 10G |
| FC-HIGH | Low | 5.77 | 5.87 | 6.45 | 512 | burst | 10G |
| FC-MEDIUM | Low | 5.77 | 5.87 | 6.69 | 512 | burst | 10G |
| FC-LOW | Low | 5.77 | 5.87 | 6.64 | 512 | burst | 10G |
| FC-LLQ | Low-Latency | 5.08 | 5.12 | 6.31 | 1500 | burst | 10G |
| FC-SIGNALING | Strict-High | 5.08 | 5.30 | 11.10 | 1500 | burst | 10G |
| FC-CONTROL | High | 5.00 | 5.30 | 8.95 | 1500 | burst | 10G |
| FC-REALTIME | Medium-High | 5.08 | 5.30 | 8.72 | 1500 | burst | 10G |
| FC-HIGH | Low | 5.08 | 5.30 | 6.79 | 1500 | burst | 10G |
| FC-MEDIUM | Low | 5.08 | 5.30 | 8.35 | 1500 | burst | 10G |
| FC-LOW | Low | 5.08 | 5.30 | 6.57 | 1500 | burst | 10G |
For the next table, observe the impact on the LLQ when creating congestion to the point of traffic discarding in the oversubscribed strict-high queue. The intentionality of the LLQ design prevents such scenarios from disrupting the low-latency queue. From the results, you can observe that the average latency budget is ≤6µs and well below the goal of 10µs.
| Queue Name | Queue Priority | Min (µs) Latency | Ave (µs) Latency | Max (µs) Latency | Frame Size | Traffic Pattern | Congested Queue |
|---|---|---|---|---|---|---|---|
| FC-LLQ | Low-Latency | 5.83 | 6.17 | 12.44 | 64 | continuous | Strict-High |
| FC-LLQ | Low-Latency | 5.78 | 6.02 | 10.95 | 512 | continuous | Strict-High |
| FC-LLQ | Low-Latency | 5.09 | 5.26 | 11.34 | 1500 | continuous | Strict-High |
| FC-LLQ | Low-Latency | 5.09 | 5.16 | 11.39 | 64 | burst | Strict-High |
| FC-LLQ | Low-Latency | 5.78 | 5.99 | 11.00 | 512 | burst | Strict-High |
| FC-LLQ | Low-Latency | 5.84 | 6.00 | 12.44 | 1500 | burst | Strict-High |
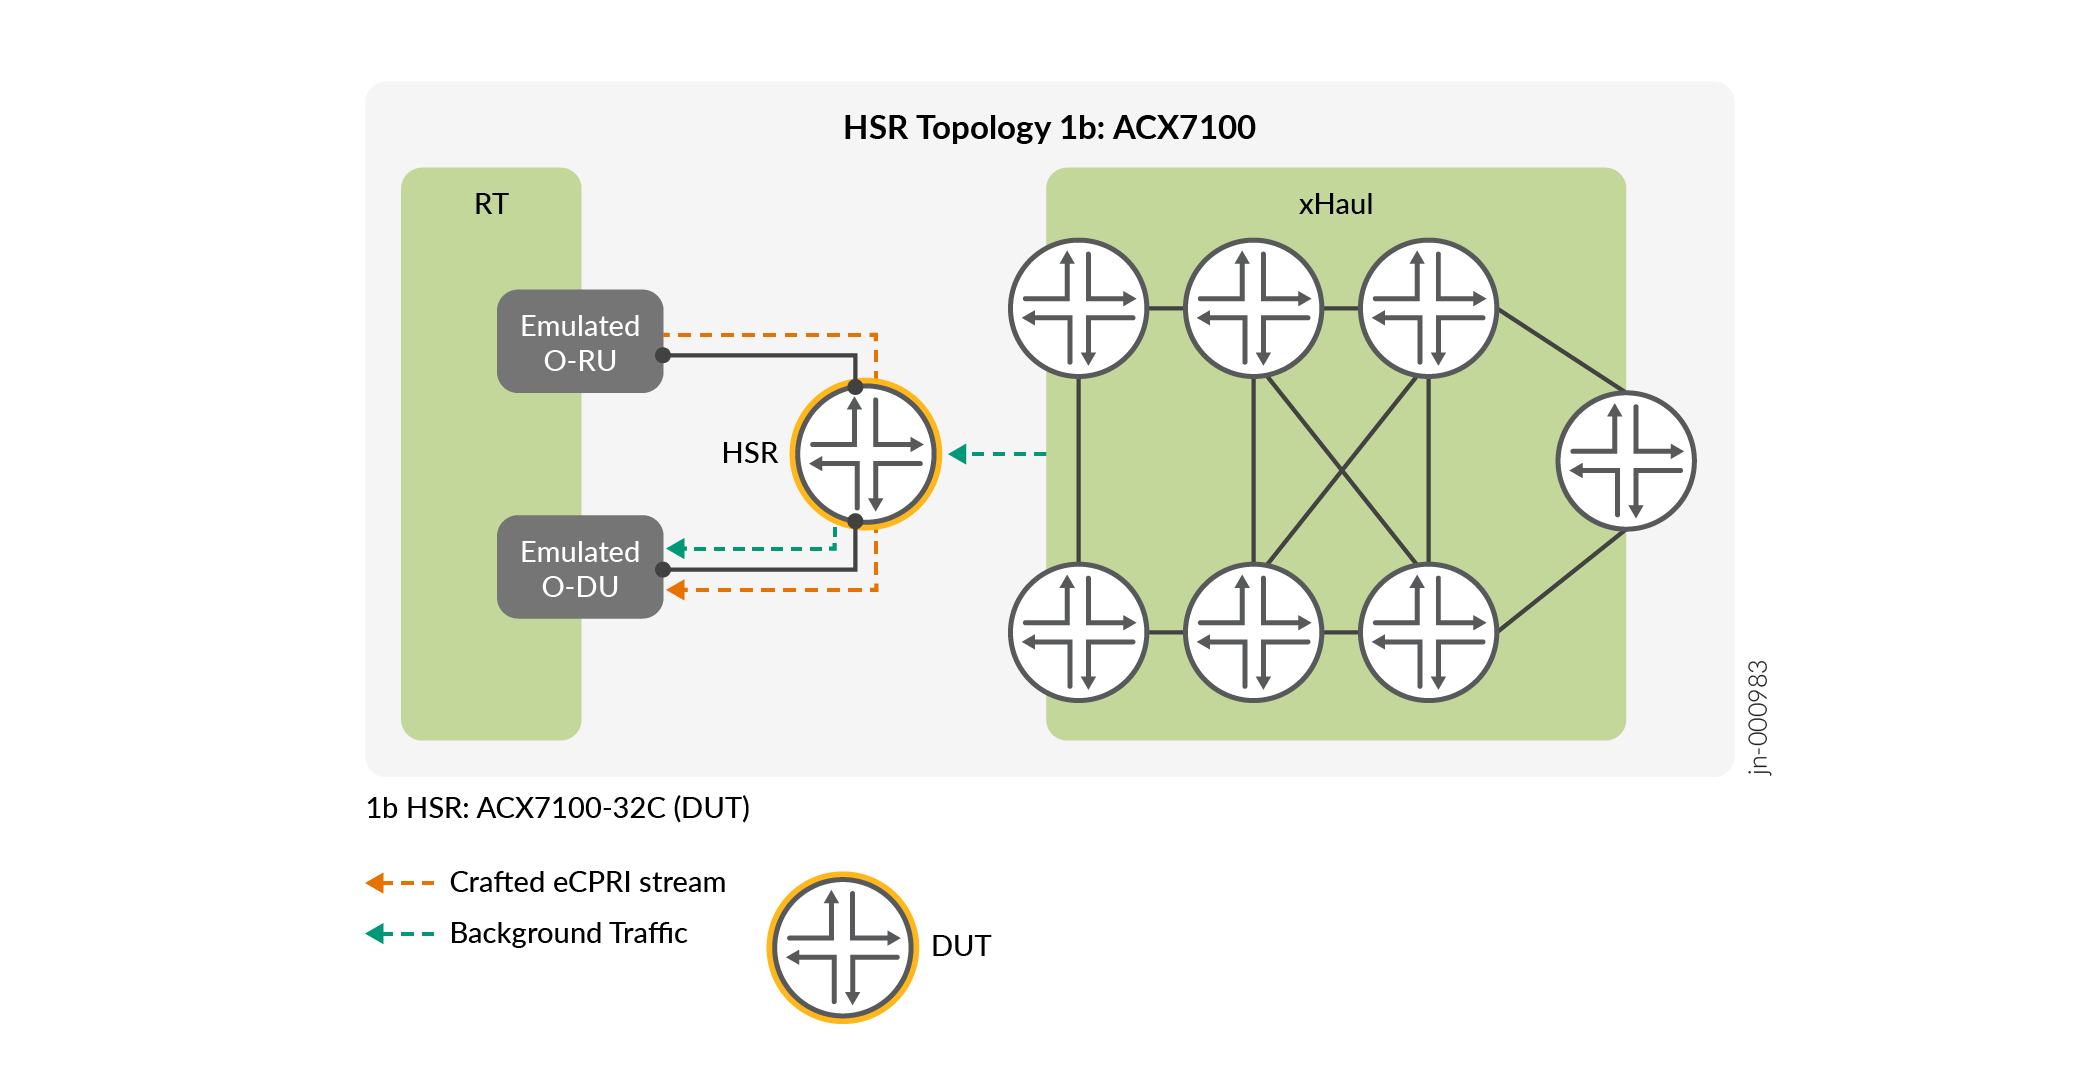
Topology 1b: ACX7100-32C
In Topology 1b, the same test scenarios are executed while moving to the HSR role with the examination of ACX7100-32C performance. Once again, the test equipment emulates O-RU and O-DU without self-latency. There is no physical CSR. In this case, the performance of the single HSR device is captured. For each scenario, the results are provided across different frame sizes with either continuous or burst traffic patterns. Latency is measured in microseconds (µs).
The following table describes the Topology 1b ACX7100-32C performance when traffic is sent only to the LLQ without background traffic. No queues are congested during this time.
| Queue Name | Queue Priority | Min (µs) Latency | Ave (µs) Latency | Max (µs) Latency | Frame Size | Traffic Pattern | Port Speed |
|---|---|---|---|---|---|---|---|
| FC-LLQ | Low-Latency | 4.35 | 4.44 | 7.82 | 64 | continuous | 10G |
| FC-LLQ | Low-Latency | 5.05 | 5.18 | 5.57 | 512 | continuous | 10G |
| FC-LLQ | Low-Latency | 4.68 | 4.88 | 5.86 | 1500 | continuous | 10G |
The following table includes continuous background traffic up to 99%-line rate with encapsulation overhead considerations for Topology 1b with ACX7100-32C. The performance of the low-latency queue is measured in conjunction with multi-level priority queues. From the results, you can see that LLQ is given preferential treatment for latency constraints. All queues are maintained below 10µs average latency, with LLQ operating at <6µs.
| Queue Name | Queue Priority | Min (µs) Latency | Ave (µs) Latency | Max (µs) Latency | Frame Size | Traffic Pattern | Port Speed |
|---|---|---|---|---|---|---|---|
| FC-LLQ | Low-Latency | 4.57 | 4.78 | 9.30 | 64 | continuous | 10G |
| FC-SIGNALING | Strict-High | 4.57 | 4.83 | 11.84 | 64 | continuous | 10G |
| FC-CONTROL | High | 4.58 | 4.86 | 14.89 | 64 | continuous | 10G |
| FC-REALTIME | Medium-High | 4.57 | 5.20 | 21.32 | 64 | continuous | 10G |
| FC-HIGH | Low | 4.58 | 4.94 | 27.61 | 64 | continuous | 10G |
| FC-MEDIUM | Low | 4.61 | 4.96 | 31.12 | 64 | continuous | 10G |
| FC-LOW | Low | 4.58 | 4.95 | 25.48 | 64 | continuous | 10G |
| FC-LLQ | Low-Latency | 5.29 | 5.53 | 8.85 | 512 | continuous | 10G |
| FC-SIGNALING | Strict-High | 5.29 | 5.70 | 12.28 | 512 | continuous | 10G |
| FC-CONTROL | High | 5.34 | 5.83 | 18.32 | 512 | continuous | 10G |
| FC-REALTIME | Medium-High | 5.29 | 5.95 | 17.89 | 512 | continuous | 10G |
| FC-HIGH | Low | 5.29 | 5.94 | 28.39 | 512 | continuous | 10G |
| FC-MEDIUM | Low | 5.34 | 6.47 | 21.83 | 512 | continuous | 10G |
| FC-LOW | Low | 5.35 | 5.68 | 28.15 | 512 | continuous | 10G |
| FC-LLQ | Low-Latency | 4.91 | 5.29 | 10.27 | 1500 | continuous | 10G |
| FC-SIGNALING | Strict-High | 4.91 | 5.67 | 15.49 | 1500 | continuous | 10G |
| FC-CONTROL | High | 4.96 | 6.14 | 18.20 | 1500 | continuous | 10G |
| FC-REALTIME | Medium-High | 4.91 | 6.03 | 24.50 | 1500 | continuous | 10G |
| FC-HIGH | Low | 4.96 | 6.45 | 39.09 | 1500 | continuous | 10G |
| FC-MEDIUM | Low | 4.96 | 7.52 | 50.54 | 1500 | continuous | 10G |
| FC-LOW | Low | 4.96 | 6.76 | 55.82 | 1500 | continuous | 10G |
The following table includes burst traffic type rather than continuous for Topology 1b with ACX7100-32C, measuring the performance of the low-latency queue in conjunction with multi-level priority queues. From the results, you can see that LLQ is given preferential treatment for latency constraints. In these scenarios, all queues are transmitted <6µs, with LLQ having slightly better performance.
| Queue Name | Queue Priority | Min (µs) Latency | Ave (µs) Latency | Max (µs) Latency | Frame Size | Traffic Pattern | Port Speed |
|---|---|---|---|---|---|---|---|
| FC-LLQ | Low-Latency | 4.61 | 4.65 | 4.79 | 64 | burst | 10G |
| FC-SIGNALING | Strict-High | 4.61 | 4.67 | 5.04 | 64 | burst | 10G |
| FC-CONTROL | High | 4.61 | 4.67 | 5.04 | 64 | burst | 10G |
| FC-REALTIME | Medium-High | 4.61 | 4.66 | 5.04 | 64 | burst | 10G |
| FC-HIGH | Low | 4.61 | 4.67 | 5.04 | 64 | burst | 10G |
| FC-MEDIUM | Low | 4.61 | 4.67 | 5.04 | 64 | burst | 10G |
| FC-LOW | Low | 4.61 | 4.67 | 5.04 | 64 | burst | 10G |
| FC-LLQ | Low-Latency | 5.31 | 5.38 | 5.49 | 512 | burst | 10G |
| FC-SIGNALING | Strict-High | 5.31 | 5.42 | 8.41 | 512 | burst | 10G |
| FC-CONTROL | High | 5.31 | 5.42 | 5.78 | 512 | burst | 10G |
| FC-REALTIME | Medium-High | 5.31 | 5.42 | 7.82 | 512 | burst | 10G |
| FC-HIGH | Low | 5.31 | 5.42 | 5.74 | 512 | burst | 10G |
| FC-MEDIUM | Low | 5.31 | 5.42 | 7.73 | 512 | burst | 10G |
| FC-LOW | Low | 5.31 | 5.42 | 5.74 | 512 | burst | 10G |
| FC-LLQ | Low-Latency | 4.94 | 5.01 | 5.87 | 1500 | burst | 10G |
| FC-SIGNALING | Strict-High | 4.94 | 5.13 | 7.81 | 1500 | burst | 10G |
| FC-CONTROL | High | 4.94 | 5.13 | 8.42 | 1500 | burst | 10G |
| FC-REALTIME | Medium-High | 4.94 | 5.13 | 8.55 | 1500 | burst | 10G |
| FC-HIGH | Low | 4.94 | 5.13 | 5.69 | 1500 | burst | 10G |
| FC-MEDIUM | Low | 4.94 | 5.13 | 5.65 | 1500 | burst | 10G |
| FC-LOW | Low | 4.94 | 5.13 | 5.76 | 1500 | burst | 10G |
In the next table, look at the impact on the LLQ when creating congestion to the point of traffic discarding in the oversubscribed strict-high queue. The intentionality of the LLQ design prevents such scenarios from disrupting the LLQ. From the results, you can observe that the latency budget is preserved at ~4-5µs and well below the goal of 10µs.
| Queue Name | Queue Priority | Min (µs) Latency | Ave (µs) Latency | Max (µs) Latency | Frame Size | Traffic Pattern | Congested Queue |
|---|---|---|---|---|---|---|---|
| FC-LLQ | Low-Latency | 4.58 | 4.89 | 11.04 | 64 | continuous | Strict-High |
| FC-LLQ | Low-Latency | 5.34 | 5.57 | 11.54 | 512 | continuous | Strict-High |
| FC-LLQ | Low-Latency | 4.93 | 5.13 | 11.46 | 1500 | continuous | Strict-High |
| FC-LLQ | Low-Latency | 4.59 | 4.70 | 11.02 | 64 | burst | Strict-High |
| FC-LLQ | Low-Latency | 5.30 | 5.50 | 10.14 | 512 | burst | Strict-High |
| FC-LLQ | Low-Latency | 4.92 | 5.03 | 11.09 | 1500 | burst | Strict-High |
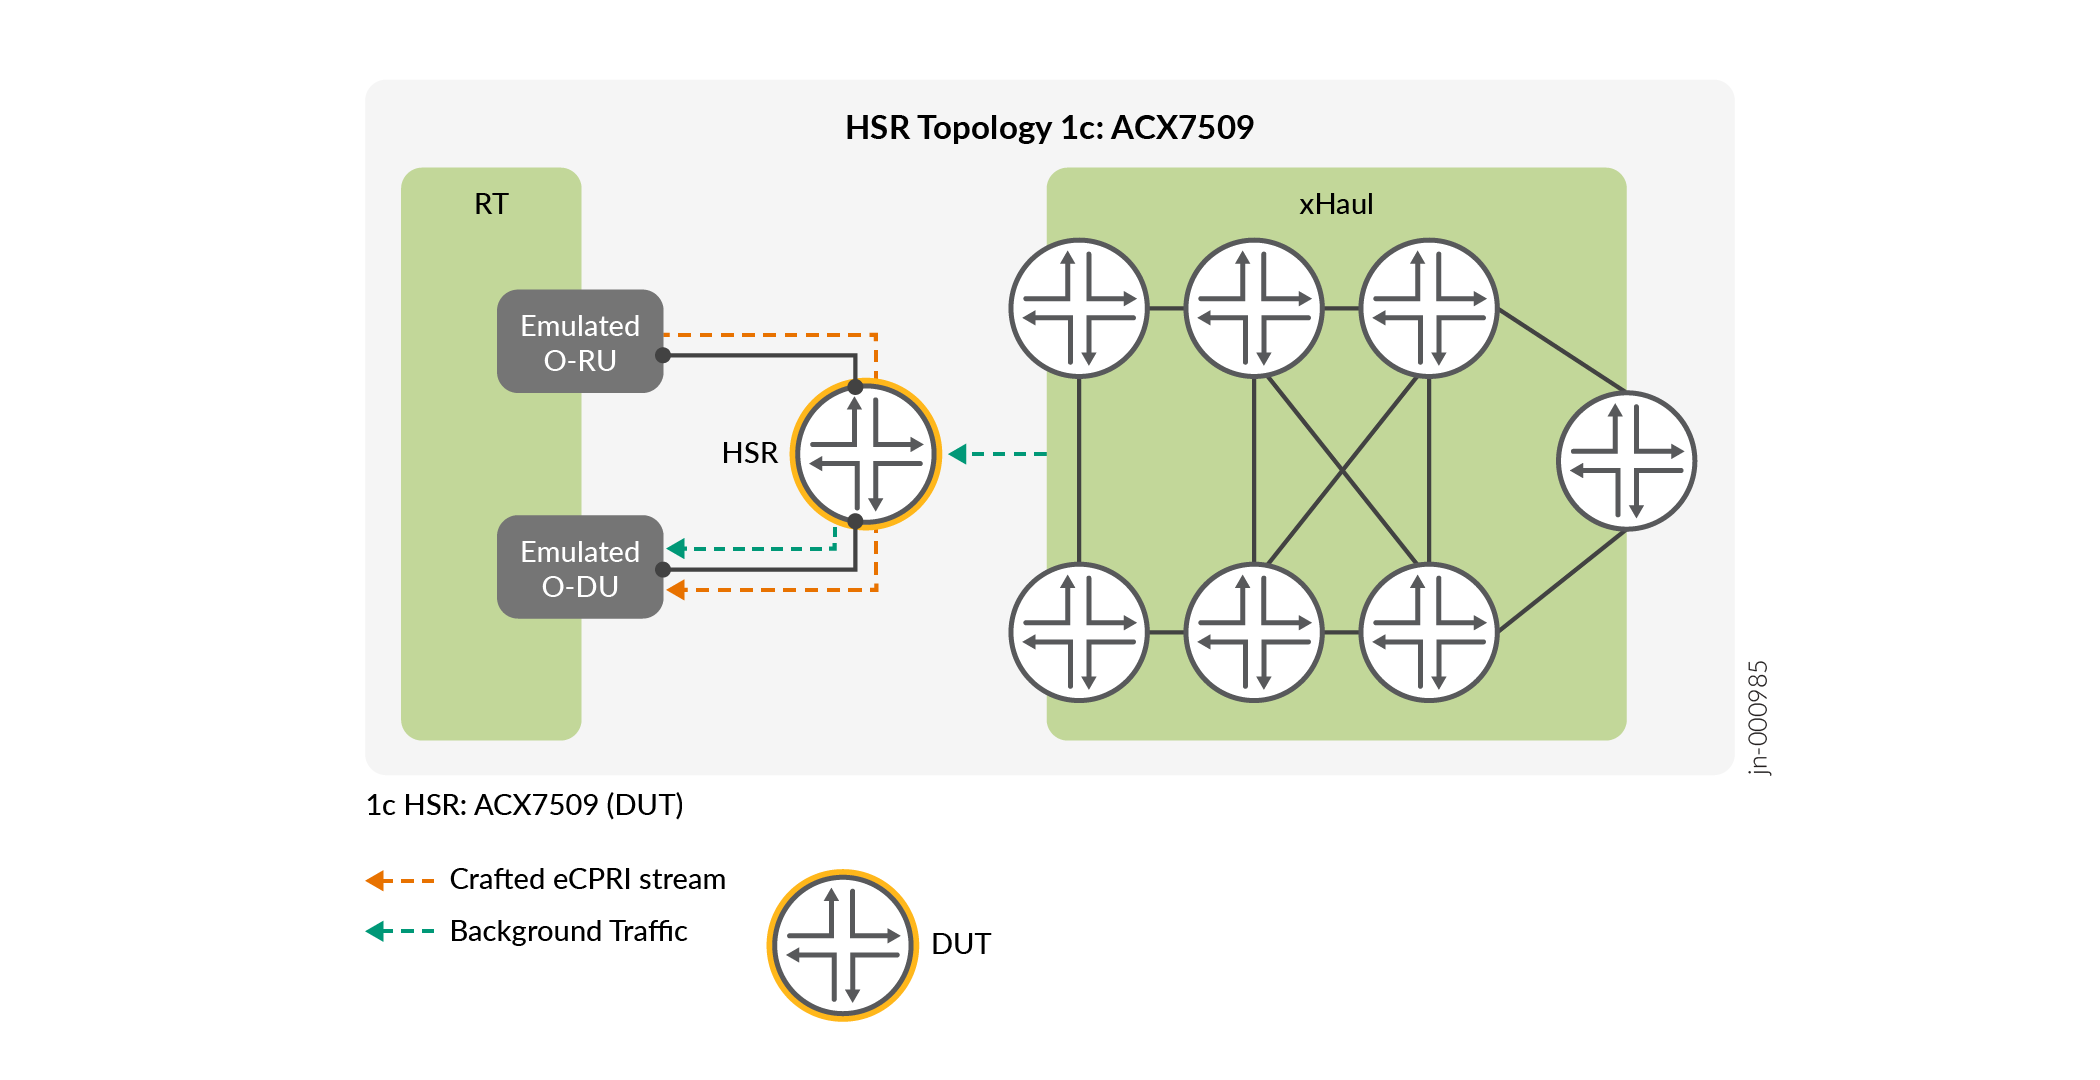
Topology 1c: ACX7509
In Topology 1c, same test scenarios are executed while moving to the second HSR device with the examination of ACX7509 performance. Once again, the test equipment emulates O-RU and O-DU without self-latency. There is no physical CSR in this case as the performance of the single device is captured. For each scenario, the results are provided across different frame sizes with either continuous or burst traffic patterns. Latency is measured in microseconds (µs).
The following table describes the Topology 1c ACX7509 performance when traffic is sent only to the LLQ without background traffic. No queues are congested during this time.
| Queue Name | Queue Priority | Min (µs) Latency | Ave (µs) Latency | Max (µs) Latency | Frame Size | Traffic Pattern | Port Speed |
|---|---|---|---|---|---|---|---|
| FC-LLQ | Low-Latency | 4.72 | 5.16 | 8.49 | 64 | continuous | 10G |
| FC-LLQ | Low-Latency | 5.30 | 6.12 | 9.22 | 512 | continuous | 10G |
| FC-LLQ | Low-Latency | 5.10 | 6.03 | 9.50 | 1500 | continuous | 10G |
The following table includes continuous background traffic up to 99%-line rate with encapsulation overhead considerations for Topology 1c with ACX7509. Performance of the FC-LLQ is measured in conjunction with multi-level priority queues. From the results, you can see that LLQ is given preferential treatment for latency constraints. All priority queues are maintained below 10µs average latency, with LLQ operating ≤6µs.
| Queue Name | Queue Priority | Min (µs) Latency | Ave (µs) Latency | Max (µs) Latency | Frame Size | Traffic Pattern | Port Speed |
|---|---|---|---|---|---|---|---|
| FC-LLQ | Low-Latency | 4.93 | 5.24 | 9.85 | 64 | continuous | 10G |
| FC-SIGNALING | Strict-High | 4.95 | 5.31 | 12.62 | 64 | continuous | 10G |
| FC-CONTROL | High | 4.97 | 5.34 | 15.32 | 64 | continuous | 10G |
| FC-REALTIME | Medium-High | 4.92 | 6.04 | 21.86 | 64 | continuous | 10G |
| FC-HIGH | Low | 4.97 | 5.41 | 36.48 | 64 | continuous | 10G |
| FC-MEDIUM | Low | 4.97 | 5.47 | 32.47 | 64 | continuous | 10G |
| FC-LOW | Low | 4.94 | 5.43 | 36.44 | 64 | continuous | 10G |
| FC-LLQ | Low-Latency | 5.69 | 6.18 | 10.24 | 512 | continuous | 10G |
| FC-SIGNALING | Strict-High | 5.69 | 6.54 | 14.42 | 512 | continuous | 10G |
| FC-CONTROL | High | 5.72 | 6.65 | 19.17 | 512 | continuous | 10G |
| FC-REALTIME | Medium-High | 5.69 | 7.69 | 22.86 | 512 | continuous | 10G |
| FC-HIGH | Low | 5.69 | 7.32 | 37.08 | 512 | continuous | 10G |
| FC-MEDIUM | Low | 5.73 | 8.01 | 35.80 | 512 | continuous | 10G |
| FC-LOW | Low | 5.73 | 7.28 | 36.19 | 512 | continuous | 10G |
| FC-LLQ | Low-Latency | 5.34 | 5.91 | 12.29 | 1500 | continuous | 10G |
| FC-SIGNALING | Strict-High | 5.32 | 6.75 | 16.29 | 1500 | continuous | 10G |
| FC-CONTROL | High | 5.34 | 7.28 | 18.77 | 1500 | continuous | 10G |
| FC-REALTIME | Medium-High | 5.34 | 8.00 | 26.09 | 1500 | continuous | 10G |
| FC-HIGH | Low | 5.34 | 8.85 | 45.10 | 1500 | continuous | 10G |
| FC-MEDIUM | Low | 5.34 | 10.19 | 57.32 | 1500 | continuous | 10G |
| FC-LOW | Low | 5.34 | 9.30 | 60.16 | 1500 | continuous | 10G |
The following table includes burst traffic type rather than continuous for Topology 1c with ACX7509, measuring the performance of the low-latency queue in conjunction with multi-level priority queues. From the results, you can see that LLQ is given preferential treatment for latency constraints. In these scenarios, all queues are transmitted within ≤6µs, with LLQ having slightly better performance.
| Queue Name | Queue Priority | Min (µs) Latency | Ave (µs) Latency | Max (µs) Latency | Frame Size | Traffic Pattern | Port Speed |
|---|---|---|---|---|---|---|---|
| FC-LLQ | Low-Latency | 4.92 | 5.01 | 5.12 | 64 | burst | 10G |
| FC-SIGNALING | Strict-High | 4.92 | 5.07 | 8.70 | 64 | burst | 10G |
| FC-CONTROL | High | 4.92 | 5.07 | 9.44 | 64 | burst | 10G |
| FC-REALTIME | Medium-High | 4.92 | 5.27 | 8.71 | 64 | burst | 10G |
| FC-HIGH | Low | 4.92 | 5.10 | 8.70 | 64 | burst | 10G |
| FC-MEDIUM | Low | 4.92 | 5.10 | 8.70 | 64 | burst | 10G |
| FC-LOW | Low | 4.92 | 5.10 | 8.70 | 64 | burst | 10G |
| FC-LLQ | Low-Latency | 5.71 | 5.75 | 5.85 | 512 | burst | 10G |
| FC-SIGNALING | Strict-High | 5.71 | 6.00 | 9.73 | 512 | burst | 10G |
| FC-CONTROL | High | 5.71 | 6.00 | 11.56 | 512 | burst | 10G |
| FC-REALTIME | Medium-High | 5.71 | 6.19 | 10.54 | 512 | burst | 10G |
| FC-HIGH | Low | 5.71 | 6.00 | 9.43 | 512 | burst | 10G |
| FC-MEDIUM | Low | 5.71 | 6.00 | 9.43 | 512 | burst | 10G |
| FC-LOW | Low | 5.71 | 6.00 | 9.43 | 512 | burst | 10G |
| FC-LLQ | Low-Latency | 5.30 | 5.38 | 7.37 | 1500 | burst | 10G |
| FC-SIGNALING | Strict-High | 5.30 | 6.10 | 9.07 | 1500 | burst | 10G |
| FC-CONTROL | High | 5.30 | 6.10 | 9.21 | 1500 | burst | 10G |
| FC-REALTIME | Medium-High | 5.30 | 6.13 | 12.20 | 1500 | burst | 10G |
| FC-HIGH | Low | 5.30 | 6.10 | 9.06 | 1500 | burst | 10G |
| FC-MEDIUM | Low | 5.30 | 6.10 | 11.82 | 1500 | burst | 10G |
| FC-LOW | Low | 5.30 | 6.10 | 9.02 | 1500 | burst | 10G |
The next table provides the impact on the low-latency queue when creating congestion to the point of traffic discarding in the oversubscribed strict-high queue. The intentionality of the design prevents such scenarios from disrupting the LLQ. From the results, you can observe that the latency budget is preserved at <6µs and well below the goal of 10µs.
| Queue Name | Queue Priority | Min (µs) Latency | Ave (µs) Latency | Max (µs) Latency | Frame Size | Traffic Pattern | Congested Queue |
|---|---|---|---|---|---|---|---|
| FC-LLQ | Low-Latency | 4.93 | 5.26 | 11.40 | 64 | continuous | Strict-High |
| FC-LLQ | Low-Latency | 5.71 | 5.94 | 11.89 | 512 | continuous | Strict-High |
| FC-LLQ | Low-Latency | 5.30 | 5.52 | 11.50 | 1500 | continuous | Strict-High |
| FC-LLQ | Low-Latency | 4.94 | 5.05 | 11.36 | 64 | burst | Strict-High |
| FC-LLQ | Low-Latency | 5.67 | 5.91 | 10.52 | 512 | burst | Strict-High |
| FC-LLQ | Low-Latency | 5.32 | 5.40 | 11.48 | 1500 | burst | Strict-High |
eCPRI Validation
In this section, the validation is summarized and performed with real eCPRI traffic patterns, O-RAN conformance testing, and handling of eCPRI message types. For all eCPRI and O-RAN conformance validation results with flow data and measurements, see the Test Report. This section captures the most critical data to explain the network and device performance. Latency is measured in microseconds (µs).
The O-RAN and eCPRI test scenarios include several functional permutations with emulated O-DU and RRU. Innovative steps are taken to validate the performance and assurance of 5G eCPRI communications, U-Plane message-type behaviors, and O-RAN conformance. These steps ensure that the featured DUTs are correctly and consistently transporting critical 5G services.
Results evolve across multiple topologies to capture a range of DUT performance characteristics in non-congested and congested scenarios.
Here is the summary of O-RAN and eCPRI test scenarios:
- eCPRI O-RAN Emulation: Leverages a standard IQ Sample file to generate flows.
- O-RAN Conformance: Analyzes messages for conformance to O-RAN specification.
- Crafted eCPRI O-RAN: Produces variable eCPRI payload for comparing latency performance.
- eCPRI Services Validation: Emulates User Plane messages, performing functional and integrity analysis.
- eCPRI Remote Memory Access (Type 4): Performs read or write from/to a specific memory address on the opposite eCPRI node and validates expected success or failure conditions.
- eCPRI Delay Measurement Message (Type 5): Estimates one-way delay between two eCPRI ports.
- eCPRI Remote Reset Message (Type 6): Requests reset of one eCPRI node from another node. This validates expected sender and receiver operations.
- eCPRI Event Indication Message (Type 7): An event notification message to convey information about raised or ceased faults or general notifications. Validation confirms events raised as expected.
Topology 1: Latency Performance with eCPRI
The proceeding test scenarios provide results across topology 1 for single-DUT performance, topology 2 for fronthaul EVPN-VPWS, and topology 3 for fronthaul active-active EVPN Multihoming. The focus of this section is on measuring the LLQ performance in non-congested and heavy congestion scenarios using real eCPRI traffic streams. Background traffic is sent up to 99%-line rate or exceeds the configured bandwidth rate to the point of discarding frames. The validation aims to measure the LLQ performance in these conditions.
For brevity, the data is summarized here with crucial results. For additional test details, including latency measured for all queues, see the Test Report or contact your Juniper representative for more information.
In the following table, real eCPRI traffic is forwarded across topology 1a with ACX7024, topology 1b with ACX7100-32C, and topology 1c with ACX7509 for 10GbE and 100GbE port speeds with continuous or burst traffic patterns. In all cases, the average latency is measured as less than the 10µs objective, with the majority ≤6µs across all three DUTs (ACX7024, ACX7100-32C, and ACX7509).
| DUT | Scenario |
Min (µs) Latency |
Ave (µs) Latency |
Max (µs) Latency |
Frame Size |
Port Speed |
Traffic Pattern |
Traffic Type |
|---|---|---|---|---|---|---|---|---|
| ACX7024 | Non-Congested | 5.71 | 5.86 | 12.72 | 64 | 10GbE | Continuous | eCPRI-ORAN |
| ACX7024 | Non-Congested | 5.56 | 5.76 | 12.33 | 512 | 10GbE | Continuous | eCPRI-ORAN |
| ACX7024 | Non-Congested | 4.88 | 5.20 | 12.45 | 1500 | 10GbE | Continuous | eCPRI-ORAN |
| ACX7024 | Non-Congested | 5.70 | 5.82 | 6.36 | 64 | 10GbE | Burst | eCPRI-ORAN |
| ACX7024 | Non-Congested | 5.45 | 5.68 | 6.40 | 512 | 10GbE | Burst | eCPRI-ORAN |
| ACX7024 | Non-Congested | 4.95 | 4.99 | 6.45 | 1500 | 10GbE | Burst | eCPRI-ORAN |
| ACX7024 | Non-Congested | 5.71 | 6.01 | 6.55 | 64 | 100GbE | Continuous | eCPRI-ORAN |
| ACX7024 | Non-Congested | 5.74 | 5.85 | 6.36 | 512 | 100GbE | Continuous | eCPRI-ORAN |
| ACX7024 | Non-Congested | 5.78 | 5.80 | 6.43 | 1500 | 100GbE | Continuous | eCPRI-ORAN |
| ACX7024 | Non-Congested | 5.74 | 6.00 | 6.54 | 64 | 100GbE | Burst | eCPRI-ORAN |
| ACX7024 | Non-Congested | 5.73 | 5.84 | 6.35 | 512 | 100GbE | Burst | eCPRI-ORAN |
| ACX7024 | Non-Congested | 5.77 | 5.79 | 6.40 | 1500 | 100GbE | Burst | eCPRI-ORAN |
| ACX7100 | Non-Congested | 4.94 | 5.81 | 12.40 | 64 | 10GbE | Continuous | eCPRI-ORAN |
| ACX7100 | Non-Congested | 5.68 | 6.36 | 12.40 | 512 | 10GbE | Continuous | eCPRI-ORAN |
| ACX7100 | Non-Congested | 5.33 | 6.26 | 11.81 | 1500 | 10GbE | Continuous | eCPRI-ORAN |
| ACX7100 | Non-Congested | 4.91 | 4.98 | 5.15 | 64 | 10GbE | Burst | eCPRI-ORAN |
| ACX7100 | Non-Congested | 5.69 | 5.77 | 5.92 | 512 | 10GbE | Burst | eCPRI-ORAN |
| ACX7100 | Non-Congested | 5.33 | 5.38 | 6.29 | 1500 | 10GbE | Burst | eCPRI-ORAN |
| ACX7100 | Non-Congested | 4.44 | 4.47 | 4.71 | 64 | 100GbE | Continuous | eCPRI-ORAN |
| ACX7100 | Non-Congested | 4.47 | 4.53 | 4.69 | 512 | 100GbE | Continuous | eCPRI-ORAN |
| ACX7100 | Non-Congested | 4.44 | 4.60 | 4.71 | 1500 | 100GbE | Continuous | eCPRI-ORAN |
| ACX7100 | Non-Congested | 4.43 | 4.60 | 4.71 | 64 | 100GbE | Burst | eCPRI-ORAN |
| ACX7100 | Non-Congested | 4.47 | 4.53 | 4.73 | 512 | 100GbE | Burst | eCPRI-ORAN |
| ACX7100 | Non-Congested | 4.44 | 4.46 | 4.70 | 1500 | 100GbE | Burst | eCPRI-ORAN |
| ACX7509 | Non-Congested | 4.59 | 4.66 | 8.55 | 64 | 10GbE | Continuous | eCPRI-ORAN |
| ACX7509 | Non-Congested | 5.30 | 5.43 | 8.92 | 512 | 10GbE | Continuous | eCPRI-ORAN |
| ACX7509 | Non-Congested | 4.92 | 5.12 | 10.40 | 1500 | 10GbE | Continuous | eCPRI-ORAN |
| ACX7509 | Non-Congested | 4.59 | 4.63 | 4.82 | 64 | 10GbE | Burst | eCPRI-ORAN |
| ACX7509 | Non-Congested | 4.93 | 5.16 | 5.88 | 512 | 10GbE | Burst | eCPRI-ORAN |
| ACX7509 | Non-Congested | 4.93 | 5.01 | 5.88 | 1500 | 10GbE | Burst | eCPRI-ORAN |
| ACX7509 | Non-Congested | 5.71 | 6.01 | 6.55 | 64 | 100GbE | Continuous | eCPRI-ORAN |
| ACX7509 | Non-Congested | 5.74 | 5.85 | 6.36 | 512 | 100GbE | Continuous | eCPRI-ORAN |
| ACX7509 | Non-Congested | 5.78 | 5.80 | 6.43 | 1500 | 100GbE | Continuous | eCPRI-ORAN |
| ACX7509 | Non-Congested | 4.12 | 4.37 | 4.47 | 64 | 100GbE | Burst | eCPRI-ORAN |
| ACX7509 | Non-Congested | 4.19 | 4.24 | 4.55 | 512 | 100GbE | Burst | eCPRI-ORAN |
| ACX7509 | Non-Congested | 4.15 | 4.16 | 4.58 | 1500 | 100GbE | Burst | eCPRI-ORAN |
The following table validates the same scenario as above, introducing heavy congestion with the strict-high queue oversubscribed and dropping traffic. The intentionality of the LLQ design prevents such scenarios from causing significant disruption to the low-latency queue while sending eCPRI traffic streams. From the results, you can observe that the average latency budget is preserved below 10µs. As the port speed increases, the transmission delay associated with congestion typically decreases. As a result, slightly lower latency can be seen on 100GbE port speeds.
| DUT | Scenario |
Min (µs) Latency |
Ave (µs) Latency |
Max (µs) Latency |
Frame Size |
Port Speed |
Traffic Pattern |
Traffic Type |
|---|---|---|---|---|---|---|---|---|
| ACX7024 | 1Q-Congested | 5.88 | 7.24 | 15.96 | 64 | 10GbE | Continuous | eCPRI-ORAN |
| ACX7024 | 1Q-Congested | 6.18 | 7.50 | 16.27 | 512 | 10GbE | Continuous | eCPRI-ORAN |
| ACX7024 | 1Q-Congested | 6.28 | 7.78 | 19.60 | 1500 | 10GbE | Continuous | eCPRI-ORAN |
| ACX7024 | 1Q-Congested | 5.69 | 6.07 | 12.23 | 64 | 10GbE | Burst | eCPRI-ORAN |
| ACX7024 | 1Q-Congested | 5.64 | 5.87 | 10.56 | 512 | 10GbE | Burst | eCPRI-ORAN |
| ACX7024 | 1Q-Congested | 4.95 | 5.12 | 12.88 | 1500 | 10GbE | Burst | eCPRI-ORAN |
| ACX7024 | 1Q-Congested | 5.70 | 6.02 | 7.02 | 64 | 100GbE | Continuous | eCPRI-ORAN |
| ACX7024 | 1Q-Congested | 5.72 | 5.87 | 6.84 | 512 | 100GbE | Continuous | eCPRI-ORAN |
| ACX7024 | 1Q-Congested | 5.78 | 5.81 | 6.89 | 1500 | 100GbE | Continuous | eCPRI-ORAN |
| ACX7024 | 1Q-Congested | 5.77 | 6.02 | 6.95 | 64 | 100GbE | Burst | eCPRI-ORAN |
| ACX7024 | 1Q-Congested | 5.71 | 5.86 | 6.86 | 512 | 100GbE | Burst | eCPRI-ORAN |
| ACX7024 | 1Q-Congested | 5.77 | 5.80 | 6.83 | 1500 | 100GbE | Burst | eCPRI-ORAN |
| ACX7100 | 1Q-Congested | 5.03 | 7.16 | 16.29 | 64 | 10GbE | Continuous | eCPRI-ORAN |
| ACX7100 | 1Q-Congested | 6.14 | 7.69 | 15.61 | 512 | 10GbE | Continuous | eCPRI-ORAN |
| ACX7100 | 1Q-Congested | 6.49 | 8.61 | 21.39 | 1500 | 10GbE | Continuous | eCPRI-ORAN |
| ACX7100 | 1Q-Congested | 4.91 | 5.28 | 11.45 | 64 | 10GbE | Burst | eCPRI-ORAN |
| ACX7100 | 1Q-Congested | 5.70 | 5.96 | 12.00 | 512 | 10GbE | Burst | eCPRI-ORAN |
| ACX7100 | 1Q-Congested | 5.30 | 5.42 | 12.01 | 1500 | 10GbE | Burst | eCPRI-ORAN |
| ACX7100 | 1Q-Congested | 4.44 | 4.49 | 5.08 | 64 | 100GbE | Continuous | eCPRI-ORAN |
| ACX7100 | 1Q-Congested | 4.47 | 4.55 | 5.07 | 512 | 100GbE | Continuous | eCPRI-ORAN |
| ACX7100 | 1Q-Congested | 4.42 | 4.61 | 5.48 | 1500 | 100GbE | Continuous | eCPRI-ORAN |
| ACX7100 | 1Q-Congested | 4.41 | 4.61 | 5.41 | 64 | 100GbE | Burst | eCPRI-ORAN |
| ACX7100 | 1Q-Congested | 4.46 | 4.54 | 5.07 | 512 | 100GbE | Burst | eCPRI-ORAN |
| ACX7100 | 1Q-Congested | 4.44 | 4.48 | 5.23 | 1500 | 100GbE | Burst | eCPRI-ORAN |
| ACX7509 | 1Q-Congested | 4.64 | 6.63 | 14.89 | 64 | 10GbE | Continuous | eCPRI-ORAN |
| ACX7509 | 1Q-Congested | 5.71 | 7.14 | 14.85 | 512 | 10GbE | Continuous | eCPRI-ORAN |
| ACX7509 | 1Q-Congested | 6.09 | 8.04 | 20.25 | 1500 | 10GbE | Continuous | eCPRI-ORAN |
| ACX7509 | 1Q-Congested | 4.59 | 4.92 | 11.10 | 64 | 10GbE | Burst | eCPRI-ORAN |
| ACX7509 | 1Q-Congested | 5.30 | 5.57 | 11.17 | 512 | 10GbE | Burst | eCPRI-ORAN |
| ACX7509 | 1Q-Congested | 4.59 | 4.68 | 12.39 | 1500 | 10GbE | Burst | eCPRI-ORAN |
| ACX7509 | 1Q-Congested | 4.13 | 4.17 | 4.94 | 64 | 100GbE | Continuous | eCPRI-ORAN |
| ACX7509 | 1Q-Congested | 4.18 | 4.24 | 4.76 | 512 | 100GbE | Continuous | eCPRI-ORAN |
| ACX7509 | 1Q-Congested | 4.10 | 4.36 | 4.96 | 1500 | 100GbE | Continuous | eCPRI-ORAN |
| ACX7509 | 1Q-Congested | 4.12 | 4.37 | 5.02 | 64 | 100GbE | Burst | eCPRI-ORAN |
| ACX7509 | 1Q-Congested | 4.19 | 4.25 | 4.87 | 512 | 100GbE | Burst | eCPRI-ORAN |
| ACX7509 | 1Q-Congested | 4.15 | 4.19 | 5.07 | 1500 | 100GbE | Burst | eCPRI-ORAN |
The following table continues to increase very heavy congestion with multiple queues simultaneously dropping traffic. In this scenario, both strict-high and high priority queues are oversubscribed. The LLQ implementation prevents disruption to delay sensitive eCPRI traffic, maintaining latency budget. Despite the increased congestion with all queues sending traffic and two queues dropping, latency is preserved below the 10µs objective in all cases. As the port speed increases, the transmission delay associated with congestion typically decreases. As a result, you can see even more benefit as the congestion increases, with measurements consistently in the range of 4-5µs.
| DUT | Scenario | Min (µs) Latency | Ave (µs) Latency | Max (µs) Latency |
Frame Size |
Port Speed |
Traffic Pattern |
Traffic Type |
|---|---|---|---|---|---|---|---|---|
| ACX7024 | 2Q-Congested | 5.90 | 7.71 | 22.88 | 64 | 10GbE | Continuous | eCPRI-ORAN |
| ACX7024 | 2Q-Congested | 6.18 | 7.37 | 16.89 | 512 | 10GbE | Continuous | eCPRI-ORAN |
| ACX7024 | 2Q-Congested | 6.29 | 7.39 | 23.58 | 1500 | 10GbE | Continuous | eCPRI-ORAN |
| ACX7024 | 2Q-Congested | 5.70 | 6.52 | 16.33 | 64 | 10GbE | Burst | eCPRI-ORAN |
| ACX7024 | 2Q-Congested | 5.64 | 6.17 | 14.18 | 512 | 10GbE | Burst | eCPRI-ORAN |
| ACX7024 | 2Q-Congested | 4.95 | 5.35 | 15.74 | 1500 | 10GbE | Burst | eCPRI-ORAN |
| ACX7024 | 2Q-Congested | 5.77 | 6.07 | 7.55 | 64 | 100GbE | Continuous | eCPRI-ORAN |
| ACX7024 | 2Q-Congested | 5.71 | 5.93 | 7.23 | 512 | 100GbE | Continuous | eCPRI-ORAN |
| ACX7024 | 2Q-Congested | 5.78 | 5.85 | 7.17 | 1500 | 100GbE | Continuous | eCPRI-ORAN |
| ACX7024 | 2Q-Congested | 5.77 | 6.06 | 7.54 | 64 | 100GbE | Burst | eCPRI-ORAN |
| ACX7024 | 2Q-Congested | 5.70 | 5.92 | 7.15 | 512 | 100GbE | Burst | eCPRI-ORAN |
| ACX7024 | 2Q-Congested | 5.77 | 5.84 | 7.16 | 1500 | 100GbE | Burst | eCPRI-ORAN |
| ACX7100 | 2Q-Congested | 4.98 | 7.09 | 22.41 | 64 | 10GbE | Continuous | eCPRI-ORAN |
| ACX7100 | 2Q-Congested | 6.10 | 7.40 | 16.54 | 512 | 10GbE | Continuous | eCPRI-ORAN |
| ACX7100 | 2Q-Congested | 6.49 | 8.55 | 26.38 | 1500 | 10GbE | Continuous | eCPRI-ORAN |
| ACX7100 | 2Q-Congested | 4.91 | 5.81 | 15.77 | 64 | 10GbE | Burst | eCPRI-ORAN |
| ACX7100 | 2Q-Congested | 5.70 | 6.31 | 13.40 | 512 | 10GbE | Burst | eCPRI-ORAN |
| ACX7100 | 2Q-Congested | 5.33 | 5.97 | 16.20 | 1500 | 10GbE | Burst | eCPRI-ORAN |
| ACX7100 | 2Q-Congested | 4.41 | 4.65 | 5.84 | 64 | 100GbE | Continuous | eCPRI-ORAN |
| ACX7100 | 2Q-Congested | 4.47 | 4.58 | 5.44 | 512 | 100GbE | Continuous | eCPRI-ORAN |
| ACX7100 | 2Q-Congested | 4.44 | 4.52 | 5.68 | 1500 | 100GbE | Continuous | eCPRI-ORAN |
| ACX7100 | 2Q-Congested | 4.12 | 4.37 | 5.02 | 64 | 100GbE | Burst | eCPRI-ORAN |
| ACX7100 | 2Q-Congested | 4.19 | 4.25 | 4.87 | 512 | 100GbE | Burst | eCPRI-ORAN |
| ACX7100 | 2Q-Congested | 4.15 | 4.19 | 5.07 | 1500 | 100GbE | Burst | eCPRI-ORAN |
| ACX7509 | 2Q-Congested | 4.60 | 6.54 | 19.92 | 64 | 10GbE | Continuous | eCPRI-ORAN |
| ACX7509 | 2Q-Congested | 5.69 | 6.93 | 15.62 | 512 | 10GbE | Continuous | eCPRI-ORAN |
| ACX7509 | 2Q-Congested | 6.10 | 7.70 | 21.52 | 1500 | 10GbE | Continuous | eCPRI-ORAN |
| ACX7509 | 2Q-Congested | 4.59 | 5.46 | 15.42 | 64 | 10GbE | Burst | eCPRI-ORAN |
| ACX7509 | 2Q-Congested | 5.30 | 5.88 | 15.93 | 512 | 10GbE | Burst | eCPRI-ORAN |
| ACX7509 | 2Q-Congested | 4.93 | 5.60 | 15.82 | 1500 | 10GbE | Burst | eCPRI-ORAN |
| ACX7509 | 2Q-Congested | 4.12 | 4.39 | 5.52 | 64 | 100GbE | Continuous | eCPRI-ORAN |
| ACX7509 | 2Q-Congested | 4.18 | 4.26 | 5.16 | 512 | 100GbE | Continuous | eCPRI-ORAN |
| ACX7509 | 2Q-Congested | 4.13 | 4.21 | 5.38 | 1500 | 100GbE | Continuous | eCPRI-ORAN |
| ACX7509 | 2Q-Congested | 4.13 | 4.41 | 5.57 | 64 | 100GbE | Burst | eCPRI-ORAN |
| ACX7509 | 2Q-Congested | 4.19 | 4.27 | 5.18 | 512 | 100GbE | Burst | eCPRI-ORAN |
| ACX7509 | 2Q-Congested | 4.15 | 4.22 | 5.37 | 1500 | 100GbE | Burst | eCPRI-ORAN |
Topology 2: Latency Performance with eCPRI over EVPN-VPWS
Topology 2 measures latency in the LLQ over point-to-point EVPN-VPWS services in the fronthaul network segment between CSR and HSR. In topology 2a, the ACX7024 is the CSR DUT, and ACX7100-32C is the HSR DUT. The test equipment emulates the O-RU and O-DU without self-latency. The focus of this section is on measuring the LLQ performance during conditions of non-congested and heavy congestion scenarios using real eCPRI traffic streams. Background traffic is sent up to 99%-line rate or exceeding the configured bandwidth rate to the point of discarding frames.
For brevity, the information provided here is summarized with results for EVPN-VPWS 5G fronthaul eCPRI performance. For fronthaul, midhaul and MBH workloads, see the Test Report of all data across multiple VPN services representing the traffic profiles explained in this document. In addition, the Test Report includes results for topology 2b, which features ACX7024 as the CSR and ACX7509 as the HSR.
.png)
Topology 2 provides single-homed performance data in a 2-hop scenario without a physical RU or DU element (both emulated by the test center). The following table measures the latency for eCPRI traffic sent over Topology 2, which includes two hops supporting point-to-point EVPN-VPWS services. The data shown is for Topology 2a, including ACX7024 as CSR and ACX7100-32C as HSR. Additional test results are found in the Test Report. Results are provided across different frame sizes, 10GbE and 100GbE port speeds, and continuous or burst traffic patterns. Latency is always measured in microseconds (µs). In all cases, the per-device average latency is measured less than the 10µs objective with the majority ≤6µs.
| Traffic Type |
Per-Hop Ave (µs) |
Scenario |
Min (µs) Latency |
Ave (µs) Latency |
Max (µs) Latency |
Frame Size |
Port Speed |
Traffic Pattern |
Hops |
|---|---|---|---|---|---|---|---|---|---|
| EVPN-VPWS (eCPRI) | 5.29 | Non-Congested | 10.45 | 10.59 | 10.89 | 64 | 10GbE | Continuous | 2 |
| EVPN-VPWS (eCPRI) | 5.52 | Non-Congested | 10.89 | 11.04 | 11.40 | 512 | 10GbE | Continuous | 2 |
| EVPN-VPWS (eCPRI) | 5.30 | Non-Congested | 10.48 | 10.61 | 11.53 | 1500 | 10GbE | Continuous | 2 |
| EVPN-VPWS (eCPRI) | 5.29 | Non-Congested | 10.46 | 10.59 | 10.84 | 64 | 10GbE | Burst | 2 |
| EVPN-VPWS (eCPRI) | 5.52 | Non-Congested | 10.90 | 11.05 | 11.32 | 512 | 10GbE | Burst | 2 |
| EVPN-VPWS (eCPRI) | 5.30 | Non-Congested | 10.46 | 10.62 | 11.47 | 1500 | 10GbE | Burst | 2 |
| EVPN-VPWS (eCPRI) | 5.25 | Non-Congested | 10.00 | 10.50 | 10.94 | 64 | 100GbE | Continuous | 2 |
| EVPN-VPWS (eCPRI) | 5.10 | Non-Congested | 10.10 | 10.21 | 10.48 | 512 | 100GbE | Continuous | 2 |
| EVPN-VPWS (eCPRI) | 5.11 | Non-Congested | 10.12 | 10.23 | 10.60 | 1500 | 100GbE | Continuous | 2 |
| EVPN-VPWS (eCPRI) | 5.39 | Non-Congested | 10.40 | 10.80 | 11.17 | 64 | 100GbE | Burst | 2 |
| EVPN-VPWS (eCPRI) | 5.29 | Non-Congested | 10.47 | 10.59 | 10.93 | 512 | 100GbE | Burst | 2 |
| EVPN-VPWS (eCPRI) | 5.29 | Non-Congested | 10.43 | 10.58 | 11.01 | 1500 | 100GbE | Burst | 2 |
As shown, the average per-hop latency (2nd column) is kept below 6µs when the network is not experiencing congestion. For the test validation, eCPRI traffic is generated from CSR (ACX7024) to HSR (ACX7100-32C).
The following table describes the latency performance with congestion created on the strict-high queue and additional scenarios including heavy congestion with traffic loss across multiple queues (strict-high and high). The congestion is created at the CSR ACX7024, resulting in discards on the egress path toward ACX7100-32C HSR.
| Traffic Type |
Per-Hop Ave (µs) |
Scenario |
Min (µs) Latency |
Ave (µs) Latency |
Max (µs) Latency |
Frame Size |
Port Speed |
Traffic Pattern |
Hops |
|---|---|---|---|---|---|---|---|---|---|
| EVPN-VPWS (eCPRI) | 6.05 | 1Q-Congested | 10.71 | 12.11 | 20.12 | 64 | 10GbE | Continuous | 2 |
| EVPN-VPWS (eCPRI) | 6.44 | 1Q-Congested | 11.50 | 12.89 | 21.10 | 512 | 10GbE | Continuous | 2 |
| EVPN-VPWS (eCPRI) | 6.76 | 1Q-Congested | 11.87 | 13.53 | 22.96 | 1500 | 10GbE | Continuous | 2 |
| EVPN-VPWS (eCPRI) | 5.37 | 1Q-Congested | 10.46 | 10.74 | 16.30 | 64 | 10GbE | Burst | 2 |
| EVPN-VPWS (eCPRI) | 5.61 | 1Q-Congested | 10.90 | 11.23 | 16.20 | 512 | 10GbE | Burst | 2 |
| EVPN-VPWS (eCPRI) | 5.38 | 1Q-Congested | 10.50 | 10.78 | 16.51 | 1500 | 10GbE | Burst | 2 |
| EVPN-VPWS (eCPRI) | 5.29 | 1Q-Congested | 10.01 | 10.60 | 11.53 | 64 | 100GbE | Continuous | 2 |
| EVPN-VPWS (eCPRI) | 5.12 | 1Q-Congested | 10.08 | 10.25 | 11.27 | 512 | 100GbE | Continuous | 2 |
| EVPN-VPWS (eCPRI) | 5.12 | 1Q-Congested | 10.10 | 10.26 | 11.16 | 1500 | 100GbE | Continuous | 2 |
| EVPN-VPWS (eCPRI) | 5.42 | 1Q-Congested | 10.41 | 10.84 | 11.94 | 64 | 100GbE | Burst | 2 |
| EVPN-VPWS (eCPRI) | 5.32 | 1Q-Congested | 10.44 | 10.64 | 11.70 | 512 | 100GbE | Burst | 2 |
| EVPN-VPWS (eCPRI) | 5.31 | 1Q-Congested | 10.43 | 10.62 | 11.58 | 1500 | 100GbE | Burst | 2 |
| EVPN-VPWS (eCPRI) | 5.78 | 2Q-Congested | 10.65 | 11.56 | 23.78 | 64 | 10GbE | Continuous | 2 |
| EVPN-VPWS (eCPRI) | 6.32 | 2Q-Congested | 11.46 | 12.64 | 22.78 | 512 | 10GbE | Continuous | 2 |
| EVPN-VPWS (eCPRI) | 6.53 | 2Q-Congested | 11.82 | 13.07 | 28.35 | 1500 | 10GbE | Continuous | 2 |
| EVPN-VPWS (eCPRI) | 5.48 | 2Q-Congested | 10.46 | 10.97 | 19.95 | 64 | 10GbE | Burst | 2 |
| EVPN-VPWS (eCPRI) | 5.76 | 2Q-Congested | 10.92 | 11.52 | 20.39 | 512 | 10GbE | Burst | 2 |
| EVPN-VPWS (eCPRI) | 5.53 | 2Q-Congested | 10.46 | 11.07 | 19.02 | 1500 | 10GbE | Burst | 2 |
| EVPN-VPWS (eCPRI) | 6.05 | 2Q-Congested | 10.01 | 12.11 | 17.33 | 64 | 100GbE | Continuous | 2 |
| EVPN-VPWS (eCPRI) | 5.16 | 2Q-Congested | 10.08 | 10.33 | 11.98 | 512 | 100GbE | Continuous | 2 |
| EVPN-VPWS (eCPRI) | 5.15 | 2Q-Congested | 10.10 | 10.31 | 11.82 | 1500 | 100GbE | Continuous | 2 |
| EVPN-VPWS (eCPRI) | 5.47 | 2Q-Congested | 10.40 | 10.95 | 12.96 | 64 | 100GbE | Burst | 2 |
| EVPN-VPWS (eCPRI) | 5.36 | 2Q-Congested | 10.43 | 10.73 | 12.29 | 512 | 100GbE | Burst | 2 |
| EVPN-VPWS (eCPRI) | 5.35 | 2Q-Congested | 10.44 | 10.70 | 12.23 | 1500 | 100GbE | Burst | 2 |
As shown, the average per-hop latency (2nd column) remains well below the overall goal of ≤10µs per device even during heavy network congestion, causing traffic loss in multiple priority queues (strict-high and high). In most cases, the per-hop latency results in less than 6µs. As the port speed increases, the transmission delay associated with congestion typically decreases. As a result, slightly lower latency is seen. The low-latency queue is designed to preserve the strict latency budget. This is a critical function for 5G architectures.
Topology 3: Latency Performance with eCPRI over active-active EVPN-VPWS Multihoming
Topology 3 measures low-latency queue performance over active-active EVPN-VPWS Multihoming services in the fronthaul network segment between CSR and a pair of HSRs. ACX7024 is the CSR with ACX7100-32C and ACX7509 as HSRs, counting as a single hop as traffic is load-shared. In this scenario, the QFX5120 is the third device emulating the DU. This section measures LLQ performance in conditions of non-congested and heavy congestion scenarios using real eCPRI traffic streams. Background traffic is sent up to 99%-line rate or exceeding the configured bandwidth rate to the point of discarding frames.
For brevity, the information provided here is summarized with results for EVPN-VPWS 5G fronthaul eCPRI performance. For fronthaul, midhaul, and MBH workloads, see the test report of all data across multiple VPN services representing the traffic profiles explained in this document.
.png)
Topology 3 provides the multihomed performance data in a 3-hop scenario, which includes QFX Series Switches as the DU connecting to the all-active ESI LAG. The test center emulates the RU.
The following table provides measurements of the latency for eCPRI traffic sent over topology 3, which includes three hops supporting active-active multihoming EVPN-VPWS services. Results are provided across different frame sizes, 10GbE and 100GbE port speeds, and continuous or burst traffic patterns. Latency is always measured in microseconds (µs). In all cases, the per-device average latency is measured less than the 10µs objective, with the majority ~3-4µs.
| Traffic Type |
Per-Hop Ave (µs) |
Scenario |
Min (µs) Latency |
Ave (µs) Latency |
Max (µs) Latency |
Frame Size |
Port Speed |
Traffic Pattern |
Hops |
|---|---|---|---|---|---|---|---|---|---|
| EVPN-VPWS (eCPRI) | 3.75 | Non-Congested | 11.09 | 11.24 | 11.79 | 64 | 10GbE | Continuous | 3 |
| EVPN-VPWS (eCPRI) | 3.98 | Non-Congested | 11.78 | 11.94 | 12.47 | 512 | 10GbE | Continuous | 3 |
| EVPN-VPWS (eCPRI) | 4.08 | Non-Congested | 12.09 | 12.23 | 13.54 | 1500 | 10GbE | Continuous | 3 |
| EVPN-VPWS (eCPRI) | 3.75 | Non-Congested | 11.09 | 11.25 | 11.77 | 64 | 10GbE | Burst | 3 |
| EVPN-VPWS (eCPRI) | 3.98 | Non-Congested | 11.79 | 11.94 | 12.49 | 512 | 10GbE | Burst | 3 |
| EVPN-VPWS (eCPRI) | 4.07 | Non-Congested | 11.80 | 12.22 | 13.56 | 1500 | 10GbE | Burst | 3 |
| EVPN-VPWS (eCPRI) | 3.78 | Non-Congested | 10.95 | 11.35 | 11.66 | 64 | 100GbE | Continuous | 3 |
| EVPN-VPWS (eCPRI) | 3.73 | Non-Congested | 11.07 | 11.20 | 11.53 | 512 | 100GbE | Continuous | 3 |
| EVPN-VPWS (eCPRI) | 3.73 | Non-Congested | 11.11 | 11.18 | 11.63 | 1500 | 100GbE | Continuous | 3 |
| EVPN-VPWS (eCPRI) | 5.49 | Non-Congested | 64 | 10.99 | 11.39 | 64 | 100GbE | Burst | 3 |
| EVPN-VPWS (eCPRI) | 5.56 | Non-Congested | 512 | 11.12 | 11.24 | 512 | 100GbE | Burst | 3 |
| EVPN-VPWS (eCPRI) | 5.57 | Non-Congested | 1500 | 11.15 | 11.22 | 1500 | 100GbE | Burst | 3 |
As shown in the table, the average per-hop latency (2nd column) equates to ~3-4µs per device as traffic is load-shared and includes an additional low latency QFX Series Switches element as the 3rd hop DU. For the test validation, eCPRI traffic is generated from CSR (ACX7024) to active-active multihomed HSRs (ACX7100-32C and ACX7509) and traversing QFX5120 as the DU.
The following table describes the latency performance with congestion created on the strict-high queue and additional scenarios, including heavy congestion with traffic loss across multiple queues (strict-high and high).
| Traffic Type |
Per-Hop Ave (µs) |
Scenario |
Min (µs) Latency |
Ave (µs) Latency |
Max (µs) Latency |
Frame Size |
Port Speed |
Traffic Pattern |
Hops |
|---|---|---|---|---|---|---|---|---|---|
| EVPN-VPWS (eCPRI) | 4.24 | 1Q-Congested | 11.32 | 12.71 | 20.91 | 64 | 10GbE | Continuous | 3 |
| EVPN-VPWS (eCPRI) | 4.67 | 1Q-Congested | 12.44 | 14.01 | 21.78 | 512 | 10GbE | Continuous | 3 |
| EVPN-VPWS (eCPRI) | 5.12 | 1Q-Congested | 13.52 | 15.35 | 25.50 | 1500 | 10GbE | Continuous | 3 |
| EVPN-VPWS (eCPRI) | 3.80 | 1Q-Congested | 11.09 | 11.41 | 16.99 | 64 | 10GbE | Burst | 3 |
| EVPN-VPWS (eCPRI) | 4.04 | 1Q-Congested | 11.81 | 12.13 | 18.65 | 512 | 10GbE | Burst | 3 |
| EVPN-VPWS (eCPRI) | 4.14 | 1Q-Congested | 12.09 | 12.41 | 18.08 | 1500 | 10GbE | Burst | 3 |
| EVPN-VPWS (eCPRI) | 3.79 | 1Q-Congested | 10.83 | 11.38 | 12.51 | 64 | 100GbE | Continuous | 3 |
| EVPN-VPWS (eCPRI) | 3.73 | 1Q-Congested | 11.03 | 11.20 | 12.18 | 512 | 100GbE | Continuous | 3 |
| EVPN-VPWS (eCPRI) | 3.74 | 1Q-Congested | 11.06 | 11.21 | 12.22 | 1500 | 100GbE | Continuous | 3 |
| EVPN-VPWS (eCPRI) | 3.80 | 1Q-Congested | 11.03 | 11.41 | 12.65 | 64 | 100GbE | Burst | 3 |
| EVPN-VPWS (eCPRI) | 3.75 | 1Q-Congested | 11.08 | 11.27 | 12.35 | 512 | 100GbE | Burst | 3 |
| EVPN-VPWS (eCPRI) | 3.75 | 1Q-Congested | 11.11 | 11.26 | 11.29 | 1500 | 100GbE | Burst | 3 |
| EVPN-VPWS (eCPRI) | 4.18 | 2Q-Congested | 11.33 | 12.54 | 25.68 | 64 | 10GbE | Continuous | 3 |
| EVPN-VPWS (eCPRI) | 4.57 | 2Q-Congested | 12.40 | 13.72 | 25.47 | 512 | 10GbE | Continuous | 3 |
| EVPN-VPWS (eCPRI) | 4.99 | 2Q-Congested | 13.51 | 14.98 | 27.73 | 1500 | 10GbE | Continuous | 3 |
| EVPN-VPWS (eCPRI) | 3.87 | 2Q-Congested | 11.08 | 11.62 | 20.63 | 64 | 10GbE | Burst | 3 |
| EVPN-VPWS (eCPRI) | 4.14 | 2Q-Congested | 11.81 | 12.41 | 23.91 | 512 | 10GbE | Burst | 3 |
| EVPN-VPWS (eCPRI) | 4.24 | 2Q-Congested | 12.12 | 12.71 | 20.88 | 1500 | 10GbE | Burst | 3 |
| EVPN-VPWS (eCPRI) | 5.20 | 2Q-Congested | 11.08 | 15.61 | 17.93 | 64 | 100GbE | Continuous | 3 |
| EVPN-VPWS (eCPRI) | 5.13 | 2Q-Congested | 15.07 | 15.38 | 17.45 | 512 | 100GbE | Continuous | 3 |
| EVPN-VPWS (eCPRI) | 4.77 | 2Q-Congested | 11.07 | 14.32 | 17.39 | 1500 | 100GbE | Continuous | 3 |
| EVPN-VPWS (eCPRI) | 4.63 | 2Q-Congested | 11.10 | 13.91 | 18.05 | 64 | 100GbE | Burst | 3 |
| EVPN-VPWS (eCPRI) | 3.78 | 2Q-Congested | 11.07 | 11.35 | 13.11 | 512 | 100GbE | Burst | 3 |
| EVPN-VPWS (eCPRI) | 4.25 | 2Q-Congested | 11.10 | 12.76 | 17.51 | 1500 | 100GbE | Burst | 3 |
As shown in the table, the average per-hop latency (2nd column) results in ~3-5µs per device even during heavy network congestion, causing traffic loss in multiple priority queues (strict-high and high). As the port speed increases, the associated transmission delay might decrease. The low-latency queue is designed to preserve the strict latency budget.
Buffer Occupancy Validation
As part of the validation, buffer utilization is verified throughout the test execution. For the complete details, see the full Test Report. The CoS buffer configuration outlined in the Scheduling section proposes the following buffer allocation per queue for the ACX7000 platform.
With the configuration implemented in the JVD, the following table displays the expected buffer allocation based on a 100GbE port with the 1250KB dedicated buffer.
| Queue | Rate | Buffer Size | Priority | Calculation | Buffer |
|---|---|---|---|---|---|
| Q7 | 5% shaped rate | 5% | strict-high | 1250000*0.05 | 62500 |
| Q6 | 40% shaped rate | 10% | low-latency | 1250000*0.1 | 125000 |
| Q5 | 30% shaped rate | 20% | medium-high | 1250000*0.2 | 250000 |
| Q4 | 40% transmit rate | 30% | low | 1250000*0.3 | 375000 |
| Q3 | 5% shaped rate | 5% | high | 1250000*0.05 | 62500 |
| Q2 | 30% transmit rate | 20% | low | 1250000*0.2 | 250000 |
| Q1 | 20% transmit rate | 10% | low | 1250000*0.1 | 125000 |
| Q0 | remainder | remainder | low | 1250000*0 | *8192 |
* remaining buffer is 0%, so minimum buffer programmed
The following outputs confirm that the buffer is allocated as expected. For more information related to buffer utilization during the test validation, see the Test Report.
jnx(/dev/pts/1)# sh cos voq buffer-profile ifd 1039
Rate Class Hardware Configuration
 =============================================================================================================
    Ifd Index:1039    Unit:0    Port:1    Queue:0    Voq Index:40    Profile Id:15
 -------------------------------------------------------------------------------------------------------------
 |                        Tail Drop Config                               |            WRED Drop Config       |
 -------------------------------------------------------------------------------------------------------------
 |  colour  |  Dedicated Buffer  |  Shared Buffer  |  Dynamic Threshold  |  Min Threshold  |  Max Threshold  |
 -------------------------------------------------------------------------------------------------------------
 |  Green   |               8192 |       500000000 |                   0 |               0 |               0 |
 |  Yellow  |               8192 |       500000000 |                   0 |               0 |               0 |
 |  Red     |               8192 |       500000000 |                   0 |               0 |               0 |
 -------------------------------------------------------------------------------------------------------------
 =============================================================================================================
    Ifd Index:1039    Unit:0    Port:1    Queue:1    Voq Index:41    Profile Id:28
 -------------------------------------------------------------------------------------------------------------
 |                        Tail Drop Config                               |            WRED Drop Config       |
 -------------------------------------------------------------------------------------------------------------
 |  colour  |  Dedicated Buffer  |  Shared Buffer  |  Dynamic Threshold  |  Min Threshold  |  Max Threshold  |
 -------------------------------------------------------------------------------------------------------------
 |  Green   |             124928 |       500000000 |                   0 |               0 |               0 |
 |  Yellow  |             124928 |       500000000 |                   0 |               0 |               0 |
 |  Red     |             124928 |       500000000 |                   0 |               0 |               0 |
 -------------------------------------------------------------------------------------------------------------
 =============================================================================================================
    Ifd Index:1039    Unit:0    Port:1    Queue:2    Voq Index:42    Profile Id:29
 -------------------------------------------------------------------------------------------------------------
 |                        Tail Drop Config                               |            WRED Drop Config       |
 -------------------------------------------------------------------------------------------------------------
 |  colour  |  Dedicated Buffer  |  Shared Buffer  |  Dynamic Threshold  |  Min Threshold  |  Max Threshold  |
 -------------------------------------------------------------------------------------------------------------
 |  Green   |             249856 |       500000000 |                   0 |               0 |               0 |
 |  Yellow  |             249856 |       500000000 |                   0 |               0 |               0 |
 |  Red     |             249856 |       500000000 |                   0 |               0 |               0 |
 -------------------------------------------------------------------------------------------------------------
 =============================================================================================================
    Ifd Index:1039    Unit:0    Port:1    Queue:3    Voq Index:43    Profile Id:14
 -------------------------------------------------------------------------------------------------------------
 |                        Tail Drop Config                               |            WRED Drop Config       |
 -------------------------------------------------------------------------------------------------------------
 |  colour  |  Dedicated Buffer  |  Shared Buffer  |  Dynamic Threshold  |  Min Threshold  |  Max Threshold  |
 -------------------------------------------------------------------------------------------------------------
 |  Green   |              62464 |       500000000 |                   0 |               0 |               0 |
 |  Yellow  |              62464 |       500000000 |                   0 |               0 |               0 |
 |  Red     |              62464 |       500000000 |                   0 |               0 |               0 |
 -------------------------------------------------------------------------------------------------------------
 =============================================================================================================
    Ifd Index:1039    Unit:0    Port:1    Queue:4    Voq Index:44    Profile Id:30
 -------------------------------------------------------------------------------------------------------------
 |                        Tail Drop Config                               |            WRED Drop Config       |
 -------------------------------------------------------------------------------------------------------------
 |  colour  |  Dedicated Buffer  |  Shared Buffer  |  Dynamic Threshold  |  Min Threshold  |  Max Threshold  |
 -------------------------------------------------------------------------------------------------------------
 |  Green   |             374784 |       500000000 |                   0 |               0 |               0 |
 |  Yellow  |             374784 |       500000000 |                   0 |               0 |               0 |
 |  Red     |             374784 |       500000000 |                   0 |               0 |               0 |
 -------------------------------------------------------------------------------------------------------------
 =============================================================================================================
    Ifd Index:1039    Unit:0    Port:1    Queue:5    Voq Index:45    Profile Id:29
 -------------------------------------------------------------------------------------------------------------
 |                        Tail Drop Config                               |            WRED Drop Config       |
 -------------------------------------------------------------------------------------------------------------
 |  colour  |  Dedicated Buffer  |  Shared Buffer  |  Dynamic Threshold  |  Min Threshold  |  Max Threshold  |
 -------------------------------------------------------------------------------------------------------------
 |  Green   |             249856 |       500000000 |                   0 |               0 |               0 |
 |  Yellow  |             249856 |       500000000 |                   0 |               0 |               0 |
 |  Red     |             249856 |       500000000 |                   0 |               0 |               0 |
 -------------------------------------------------------------------------------------------------------------
 =============================================================================================================
    Ifd Index:1039    Unit:0    Port:1    Queue:6    Voq Index:46    Profile Id:28
 -------------------------------------------------------------------------------------------------------------
 |                        Tail Drop Config                               |            WRED Drop Config       |
 -------------------------------------------------------------------------------------------------------------
 |  colour  |  Dedicated Buffer  |  Shared Buffer  |  Dynamic Threshold  |  Min Threshold  |  Max Threshold  |
 -------------------------------------------------------------------------------------------------------------
 |  Green   |             124928 |       500000000 |                   0 |               0 |               0 |
 |  Yellow  |             124928 |       500000000 |                   0 |               0 |               0 |
 |  Red     |             124928 |       500000000 |                   0 |               0 |               0 |
 -------------------------------------------------------------------------------------------------------------
 =============================================================================================================
    Ifd Index:1039    Unit:0    Port:1    Queue:7    Voq Index:47    Profile Id:14
 -------------------------------------------------------------------------------------------------------------
 |                        Tail Drop Config                               |            WRED Drop Config       |
 -------------------------------------------------------------------------------------------------------------
 |  colour  |  Dedicated Buffer  |  Shared Buffer  |  Dynamic Threshold  |  Min Threshold  |  Max Threshold  |
 -------------------------------------------------------------------------------------------------------------
 |  Green   |              62464 |       500000000 |                   0 |               0 |               0 |
 |  Yellow  |              62464 |       500000000 |                   0 |               0 |               0 |
 |  Red     |              62464 |       500000000 |                   0 |               0 |               0 |
------------------------------------------------------------------------------------------------------------- |
Host Traffic Classification
For details on the results related to assigning host traffic to a forwarding class for this profile, see the Test Report.
Traffic Characteristics
For all details on traffic flows and types of streams created in the execution of this JVD, see the Test Report.