
Inline Monitoring Services Configuration
Understanding Inline Monitoring Services
- Benefits of Inline Monitoring Services
- Inline Monitoring Services Feature Overview
- Inline Monitoring Services IPFIX Export Format Overview
- Inline Monitoring Services sFlow Version 5 Export Format Overview
- Inline Monitoring Services Configuration Overview
- Supported and Unsupported Features with Inline Monitoring Services
Benefits of Inline Monitoring Services
Flexible—Inline monitoring services allow different inline-monitoring instances to be mapped to different firewall filter terms, unlike in traditional sampling technologies, where all the instances are mapped to the Flexible PIC Concentrator (FPC). This provides you with the flexibility of sampling different streams of traffic at different rates on a single interface.
Packet format agnostic—Traditional flow collection technologies rely on packet parsing and aggregation by the network element. With inline monitoring services, the packet header is exported to the collector for further processing, but without aggregation. Thereby, you have the benefit of using arbitrary packet fields to process the monitored packets at the collector.
Inline Monitoring Services Feature Overview
Service providers and content providers typically require visibility into traffic flows to evaluate peering agreements, detect traffic anomalies and policy violations, and monitor network performance. To meet these requirements, you would traditionally export aggregate flow statistics information using inline active flow monitoring or IPFIX variants.
As an alternative approach, you can sample the packet content, add metadata information, and export the monitored packets to an collector. The inline monitoring services enable you to do this on MX Series routers and on PTX routers that run Junos OS Evolved.
With inline monitoring services, you can monitor every IPv4 and IPv6
packet on both ingress and egress directions of an interface.
Starting in Junos OS
Release 26.2R1 for the MX304 router, you can choose either IPFIX or sFlow version 5 (RFC
3176) export format. IPFIX is the default export format. The IPFIX export format
supports all traffic families. The sFlow version 5 export format supports only
family inet and family inet6.
An inline monitoring services instance can support either the IPFIX export version or the sFlow version 5 export version. One inline monitoring services instance cannot support both versions. We also do not recommend that you toggle between export formats on one instance. You should configure a different instance for each export format.
You configure
templates only for the IPFIX export format. You cannot configure a template when the
sflow-v5 export format statement is configured for the inline
monitoring services
instance.
For more information about the sFlow standard, see RFC3176. For more information about the sFlow version 5 format, see sFlow Version 5.
Inline Monitoring Services IPFIX Export Format Overview
With inline monitoring services, you can monitor every IPv4 and IPv6 packet on both ingress and egress directions of an interface. The software encapsulates the monitored traffic in an IPFIX format and exports the actual packet up to the configured clip length to an collector for further processing. By default, Junos OS supports a maximum clip length of 126 bytes starting from the Ethernet header and Junos OS Evolved supports a maximum clip length of 256 bytes starting from the Ethernet header.
Figure 1 illustrates the IPFIX format specification.
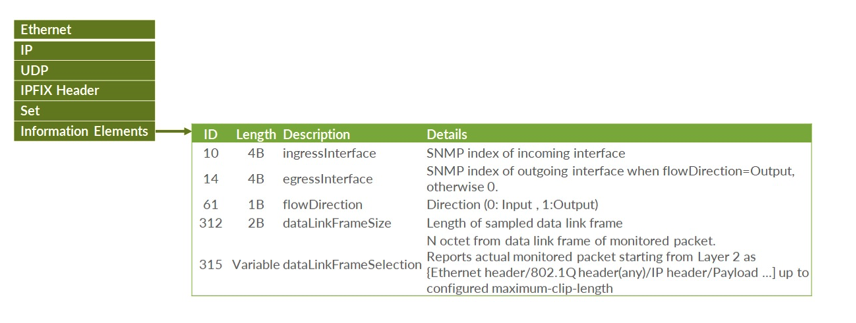
The IPFIX header and IPFIX payload are encapsulated using the IP or UDP transport layer. The exported IPFIX format includes two data records and two data templates that are exported to every collector:
-
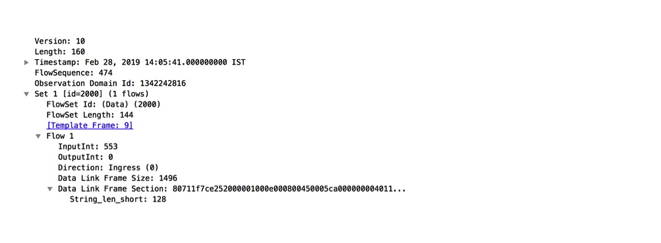
Data record—Includes incoming and outgoing interface, flow direction, data link frame section, and data link frame size. This information is sent to the collector only when sampled packets are being exported.
Figure 2 is a sample illustration of IPFIX data record packet.
-
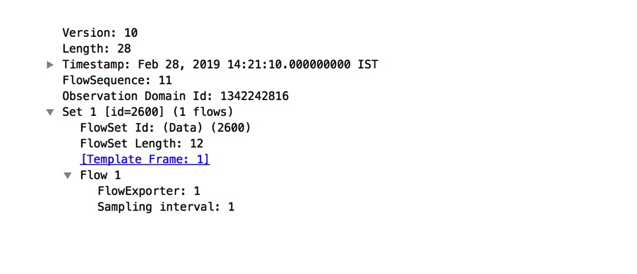
Option data record—Includes system level information, such as exporting process ID, and sampling interval. This information is sent to the collector periodically, irrespective of whether sampling packets are being exported are not.
Figure 3 is a sample illustration of IPFIX option data record packet.
Table 1: Information Element fields in IPFIX Option Data Packet Number
Information Element ID
Information Element Length
Details
1
144
4B
Observation domain ID - An unique identifier of exporting process per IPFIX device. Purpose of this field is to limit the scope of other information element fields.
2
34
4B
Sampling interval at which the packets are sampled. 1000 indicates that one of 1000 packets is sampled.
-
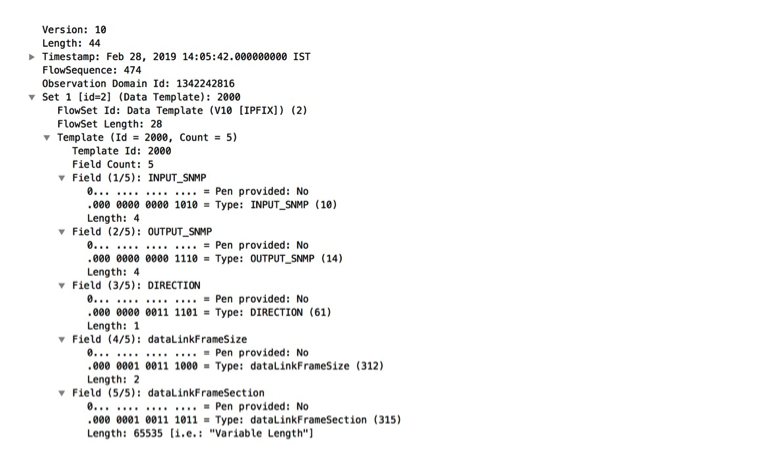
Data template—Includes five information elements:
-
Ingress interface
-
Egress interface
-
Flow direction
-
Data link frame size
-
Variable data link frame selection
Figure 4 is a sample illustration of IPFIX data template packet.
-
-
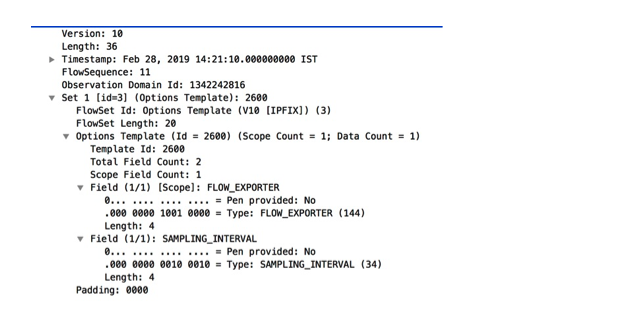
Option data template—Includes flow exporter and sampling interval information.
Figure 5 is a sample illustration of IPFIX option data template packet.
When there is a new or changed inline monitoring services configuration, periodic export of data template and option data template is immediately sent to the respective collectors.
Inline Monitoring Services sFlow Version 5 Export Format Overview
With inline monitoring services (IMON), you can monitor every IPv4 and IPv6 packet on both ingress and egress directions of an interface. The software encapsulates the monitored traffic in an sFlow version 5 format and exports the actual packet up to the configured clip length to an IPv4-addressable collector for further processing. By default, Junos OS supports a maximum clip length of 126 bytes, starting from the Ethernet header.
For this export format, you can have up to 4 collectors under each IMON instance. Because the export format is configured at the instance level and not at the collector level, the export format applies to all collectors under that instance. You can sample traffic on only one logical interface per physical interface. All traffic under that logical interface is sampled. You can export the sFlow datagram through a non-default VRF.
The sFlow version 5 header and payload are encapsulated using the IP or UDP transport layer. This sFlow version 5 datagram includes:
-
IPv4 datagram header
-
UDP datagram header
-
Sample datagram header for version 5
-
Flow sample header
-
Raw packet header
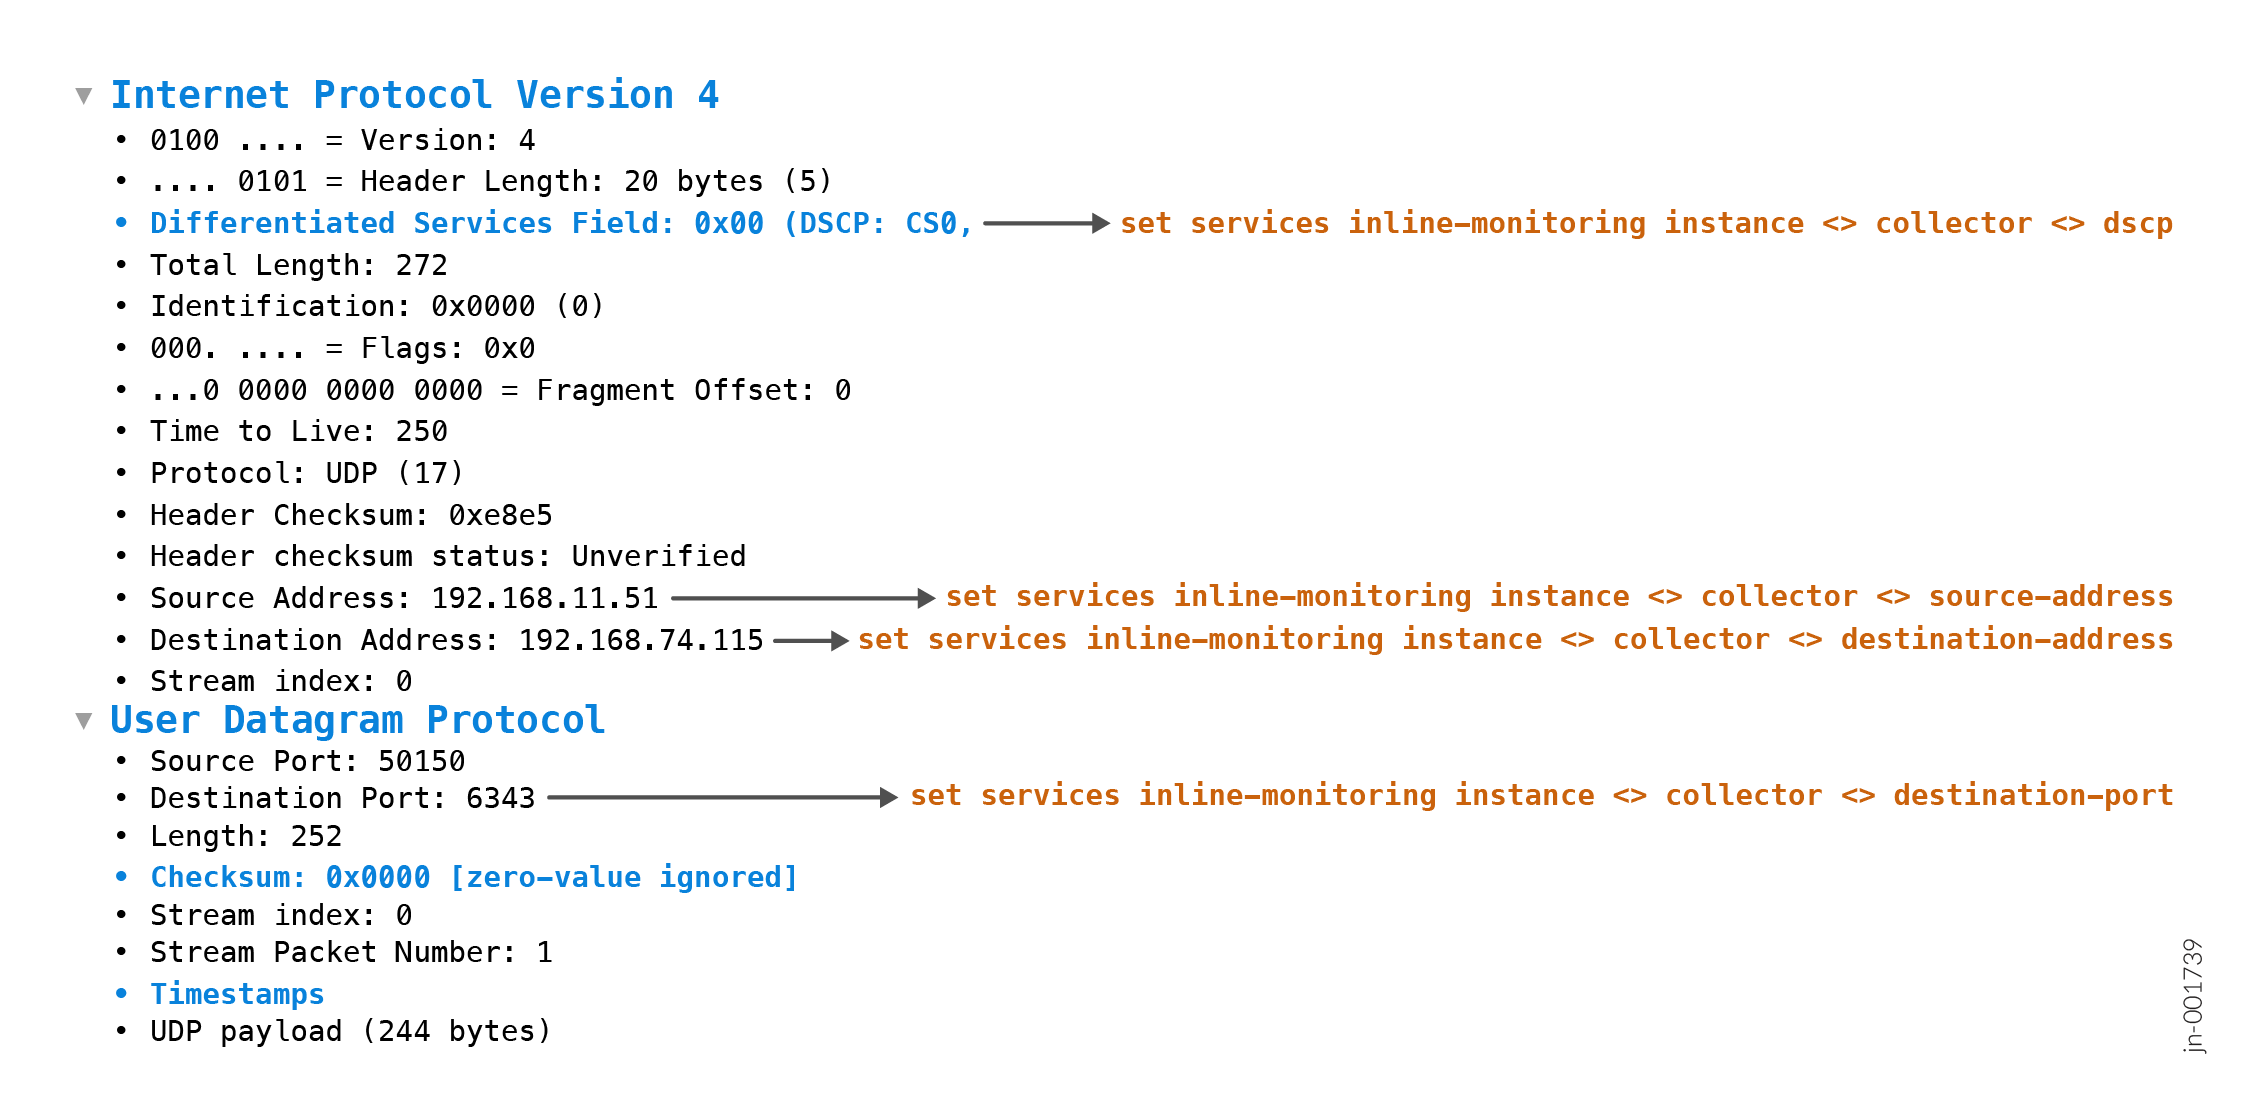
The IPv4 datagram header contains the following fields:
| Field | Description |
|---|---|
|
|
4 |
|
|
20 |
|
|
Configured with the CLI command set services inline-monitoring instance name collector name dscp. |
|
|
Computed by the software. |
|
|
Randomly generated value using LFSR. |
|
|
Always 0. |
|
|
Always 0. |
|
|
250 |
|
|
UDP |
|
|
Computed by the software. |
|
|
Configured with the CLI command set services inline-monitoring instance name collector name source-address address. |
|
|
Configured with the CLI command set services inline-monitoring instance name collector name destination-address address. |
The UDP datagram contains the following fields:
| Field | Description |
|---|---|
|
|
50151 |
|
|
Configured with the CLI command set services inline-monitoring instance name collector name destination-port port-number. |
|
|
Computed by the software. |
|
|
Always 0. |
You can view the information in these datagrams at the collector, see Figure 6 for a sample capture.
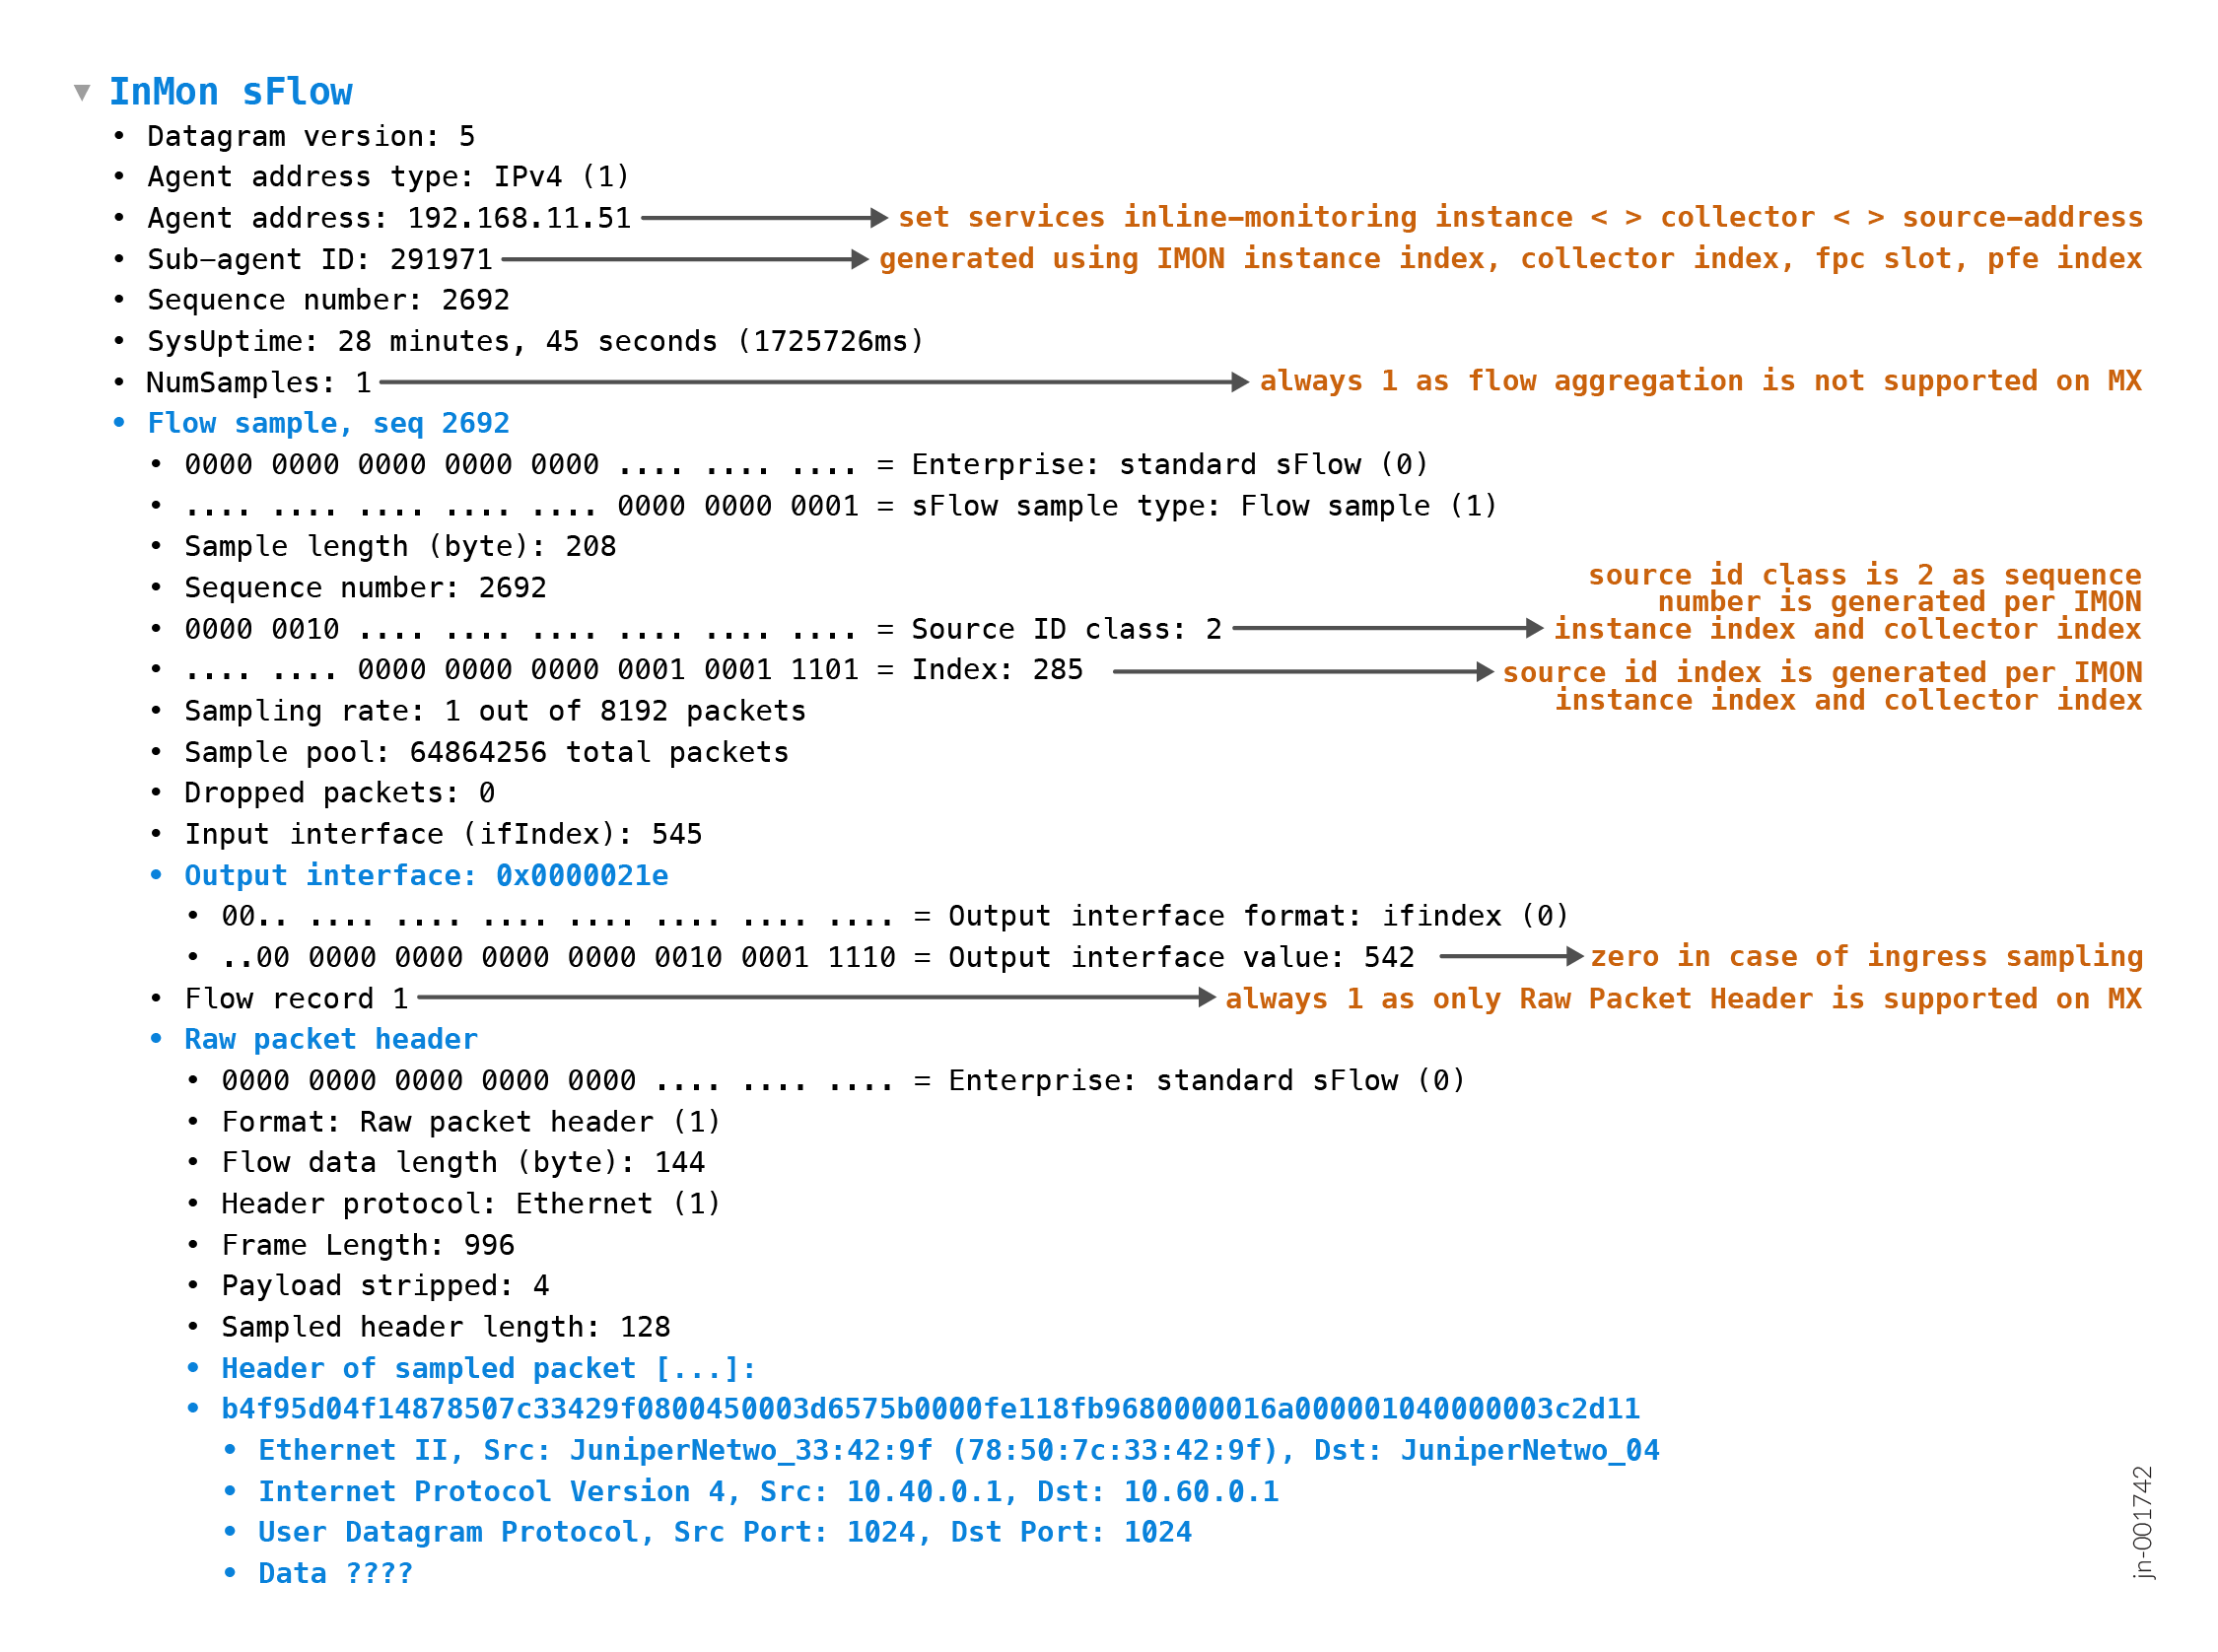
Fields in the sample_datagram_v5 header of the exported datagram are shown in Table 4. This header
is labeled InMon sFlow in the sample capture shown in Figure 9.
| Field | Description |
|---|---|
|
|
5 |
|
|
1 - indicates IPv4. |
|
|
Configured with the CLI command set services inline-monitoring instance name collector name source-address address. |
|
|
Generated using the inline monitoring services instance index, collector index, FPC slot number, and Packet Forwarding Engine instance, as shown in Figure 7. |
|
|
An incrementing sequence number, incremented by 1 for each datagram. This number is unique per SubAgentId. |
|
|
Time in milliseconds since the device last booted. |
|
|
Always 1. Each sampled packet triggers an sFlow datagram to the collector. |

The fields of the Flow Sample header of the exported datagram are shown in Table 5. This header
is labeled Flow Sample in the sample capture shown in Figure 9.
| Field | Description | ||||||||||||||||||
|---|---|---|---|---|---|---|---|---|---|---|---|---|---|---|---|---|---|---|---|
|
|
Value 1, indicates flow_sample. |
||||||||||||||||||
|
|
Computed according to the sFlow standard. |
||||||||||||||||||
|
|
Incrementing sequence number. Incremented by 1 for each flow sample generated by this source ID. Maintained at the collector level. |
||||||||||||||||||
|
|
Generated using the inline monitoring services instance index and collector index as shown in Figure 8. |
||||||||||||||||||
|
|
Configured with the CLI command set services inline-monitoring instance name collector name sampling-rate. |
||||||||||||||||||
|
|
Computed on every sampled packet as shown in table below:
|
||||||||||||||||||
|
|
Always 0. |
||||||||||||||||||
|
|
SNMP index of the ingress interface. If it is an Aggregated Ethernet interface, the SNMP index of the AE interface is reported. Note:
The SNMP index is for the physical interface, not the logical interface. |
||||||||||||||||||
|
|
For ingress sampling, the value is always 0. For egress sampling, the SNMP index of the egress Interface. If it is an Aggregated Ethernet interface, the SNMP index of the AE interface is reported. For ECMP, an accurate physical interface index should be reported. Note:
The SNMP index is for the physical interface, not the logical interface. |
||||||||||||||||||
|
|
Always 1, because only |

The fields of the sampled_header header of the exported datagram are shown in Table 7. This header
is labeled Raw Packet Header in the sample capture shown in Figure 9.
| Field | Description |
|---|---|
|
|
Computed according to the sFlow standard. |
|
|
Always 1 according to the sFlow standard. Value 1 indicates Ethernet traffic. |
|
|
Original length of packet, starting from Ethernet header |
|
|
Always 4, because FCS is stripped and not reported as part of the sampled frame |
|
|
Size of the sampled packet reported, including the size of the Ethernet header |
|
|
Up to 126 bytes of the sampled packet, starting from the Ethernet header with a minimum of 126 bytes or the original length of the packet. Reporting 126 bytes of sampled packet is enough to get information up to Layer 4. For example, 110 bytes is sufficient in case of untagged VLAN or single MPLS-labeled MPLSoUDP packet, Example 1: Ethernet(18)+V4(20)+UDP(8)+MPLS(4)+InnerV4(20)+TCP(20) = 90 bytes Example 2: Ethernet(18)+V4(20)+UDP(8)+MPLS(4)+InnerV6(40)+TCP(20) = 110 bytes |
You can view the information in these headers at the collector, see Figure 9 for a sample.
Inline Monitoring Services Configuration Overview
You can configure a maximum of sixteen (Junos OS) or seven (Junos OS Evolved) inline-monitoring instances that support template and collector-specific configuration parameters. Each inline monitoring instance supports up to four collectors (maximum of 64 collectors in total), and, for Junos OS and IPFIX export format only, you can specify different sampling rates under each collector configuration. Because of this flexibility, the inline monitoring services overcome the limitations of traditional sampling technologies, such as inline active flow monitoring, sFlow, and port mirroring.
To configure inline monitoring:
-
You must include the
inline-monitoringstatement at the[edit services]hierarchy level. Here you specify the template and inline monitoring instance parameters. You must specify the collector parameters under the inline-monitoring instance. -
Specify arbitrary match conditions using a firewall filter term and an action to accept the configured inline-monitoring instance. This maps the inline-monitoring instance to the firewall term.
-
Map the firewall filter under the family
inetorinet6statement using theinline-monitoring-instancestatement at the [edit firewall filter name then] hierarchy level. Starting in Junos OS Release 21.1R1 and for the IPFIX export format, you can also map the firewall filter under the familyany, bridge, ccc, mpls,orvplsstatements. For Junos OS Evolved, thebridgeandvplsfamilies are not supported; use theethernet-switchfamily instead. Junos OS Evolved does support theany,ccc,inet,inet6, andmplsfamilies as well. You can also alternatively apply the firewall filter to a forwarding table filter with input or output statement to filter ingress or egress packets, respectively.
Remember:
-
The device must support a maximum packet length (clip length) of 126 bytes (Junos OS) or 256 bytes (Junos OS Evolved) to enable inline monitoring services.
-
You cannot configure more than 16 (Junos OS) or 7 (Junos OS Evolved) inline-monitoring instances because of the scarcity of bits available in the packet in the forwarding path.
-
Apply inline monitoring services only on a collector interface, that is, the interface on which the collector is reachable. You must not apply inline monitoring on IPFIX traffic as this generates another IPFIX packet for sampling, thereby creating a loop. This includes inline monitoring service-generated traffic, such as template and record packets, option templates, and option record packets for the IPFIX export format and datagrams for the sFlow version 5 export format.
-
When inline monitoring services are enabled on aggregated Ethernet (AE) interfaces, the information element values for the IPFIX export format are as follows:
Table 8: Information Element Values for Aggregated Ethernet Interfaces Direction of inline monitoring service on AE interface
Information element-10 (Incoming interface)
Information element-14 (Outgoing interface)
Ingress
SNMP ID of AE
0
Egress
SNMP ID of AE
SNMP ID of member link
-
When inline monitoring services are enabled on IRB interfaces, the information element values for the IPFIX export format are as follows:
Table 9: Information Element Values for IRB Interfaces Direction of inline monitoring service on IRB interface
Information element-10 (Incoming interface)
Information element-14 (Outgoing interface)
Ingress
SNMP ID of IRB
0
Egress
SNMP ID of IRB
SNMP ID of vlan-bridge encapsulated interface
-
(IPFIX export format only) For XL-XM based devices (with Lookup chip (XL) and buffering ASIC (XM)), the length of the Data Link Frame Section information element in an exported packet can be shorter than the clip length even if the egress packet length is greater than clip length.
The length of the Data Link Frame Section information element is reduced by 'N' number of bytes where 'N' = (ingress packet Layer 2 encapsulation length - egress packet Layer 2 encapsulation length).
For instance, the Layer 2 encapsulation length for the ingress packet is greater than that of the egress packet when the ingress packet has MPLS labels and egress packet is of IPv4 or IPv6 type. When traffic flows from the provider edge (PE) device to the customer edge (CE) device, the ingress packet has VLAN tags and the egress packet is untagged.
In such cases, the clip length can go past the last address location of the packet head, generating a
PKT_HEAD_SIZEsystem log message. This can result in degradation of packet forwarding for the device. -
In the ingress direction, the IPFIX
egressInterface(information element ID 14) or the sFlowflow_sample.output_interfacefield does not report the SNMP index of the output interface. These fields always report the value zero in case of ingress direction. For the IPFIX export format, the receiving collector process should identify the validity of this field based on theflowDirection(information element ID 61). -
(sFlow export format only) Some forwarding scenarios may overwrite the ingress logical or physical interface information during the lifetime of the packet. For these cases, reporting the actual media WAN port (ge-/xe-/et-/ae-) is not possible. For example:
On a MPLS tunnel tail end, when an MPLS packet is received, the target VRF is identified using the VPN label and the packet switches from the default VRF to the customer VRF using the LSI interface associated to the customer VRF. Therefore, the LSI interface index overwrites the ingress logical or physical interface index in the data path. Inline monitoring services always reports the latest interface information, which is the LSI interface in this case.
Packets traveling through dynamic tunnels report the FTI interface instead of the ingress interface.
-
(sFlow export format only) In the egress direction, if a packet is trapped or dropped before the packet goes through the Ethernet encapsulation nexthop, the
sampled_header.sampled_pktdatagram field reports without the Ethernet header and thesampled_header.protocoldatagram field reports the value 1 (Ethernet). -
(sFlow export format only) You cannot export the sFlow datagram through the management interface. The collector must be reachable through a WAN port.
Supported and Unsupported Features with Inline Monitoring Services
Inline monitoring services supports:
-
Graceful Routing Engine switchover
-
In-service software upgrade (ISSU), nonstop software upgrade (NSSU), and nonstop active routing (NSR)
-
Ethernet interfaces and integrated routing and bridging (IRB) interfaces
-
Junos node slicing
-
Starting in Junos OS Evolved Release 22.4R1, configuring DSCP, forwarding class, or routing instances for collectors.
-
Starting in Junos OS Evolved Release 22.4R1, configuring template IDs or option template IDs.
Inline monitoring services currently does not support:
-
Configuring more than 16 (Junos OS) or 7 (Junos OS Evolved) inline-monitoring instances.
-
Junos Traffic Vision
-
Prior to Junos OS Release 21.1R1, the inline-monitoring-instance term action is supported only for
inetandinet6family firewall filters. Starting in Junos OS Release 21.1R1 and for the IPFIX export format only, it is supported for theany, bridge, ccc, mpls,andvplsfamily firewall filters. -
IPv6 addressable collectors
-
Virtual platforms
-
Logical systems
-
(IPFIX export format only) Configuring both the observation domain ID and observation cloud ID. You must choose only one of them.
-
An inline monitoring instance action used for exception reporting cannot be used for any other purpose, such as a firewall re-direct action or a regular inline-monitoring action.
-
An inline monitoring instance used for a firewall re-direct action cannot be used for any other purpose, such as exception reporting or a regular inline-monitoring action.
-
Prior to Junos OS Evolved Release 22.4R1, configuring DSCP, forwarding class, or routing instances for collectors.
-
Prior to Junos OS Evolved Release 22.4R1, configuring template IDs or option template IDs. The system generates these for you.
-
(Junos OS Evolved) Configuring port mirroring and inline monitoring services under the same firewall filter term .
-
(Junos OS Evolved) In the egress direction, configuring both sFlow and exception reporting; you must choose only one of them.
Configuring Inline Monitoring Services with IPFIX Export Format
Before You Configure
When you configure inline monitoring services, you can:
-
Configure up to 16 (Junos OS) or 7 (Junos OS Evolved) inline-monitoring instances. Under each instance, you can configure specific collector and template parameters.
-
Configure up to 4 IPv4-addressable collectors under each inline-monitoring instance. In total, you can configure up to 64 collectors. The collectors can be remote, and at different locations.
For each collector, you can configure specific parameters, such as source and destination address, and so on. The default routing-instance name at the collector is
default.inet. -
For Junos OS, you can configure the
inetorinet6family firewall filter with the term actioninline-monitoring-instance inline-monitoring-instance-name. Starting in Junos OS Release 21.1R1, for the IPFIX export format, you can configureany, bridge, ccc, mpls,orvplsfamily firewall filters with the term actioninline-monitoring-instance inline-monitoring-instance-name. For Junos OS Evolved, you can configure theany, ccc, ethernet-switch, inet, inet6,ormplsfamily firewall filters with the term action inline-monitoring-instance inline-monitoring-instance-name.Each term can support a different inline-monitoring instance.
-
Attach the inline monitoring firewall filter under the family of the logical unit of the interface.
After successfully committing the configuration, you can verify the implementation of the inline monitoring services by issuing the show services inline-monitoring statistics fpc-slot command from the CLI.
If a packet requires inline monitoring services to be applied along with any of the traditional sampling technologies (such as inline active flow monitoring or sFlow), the Packet Forwarding Engine performs both inline monitoring services and the traditional sampling technology on that packet. Port mirroring currently must be configured under a different term for Junos OS Evolved.
Figure 10 is a sample illustration of inline monitoring services, where traffic is monitored at two different sampling rates on the device interface, and exported to four remote collectors in an IPFIX encapsulation format. For Junos OS, you configure the sampling rate on each collector, allowing different rates for each collector. For Junos OS Evolved, you configure the sampling rate on the inline-monitoring instance, and it applies to all of the collectors configured for that instance.
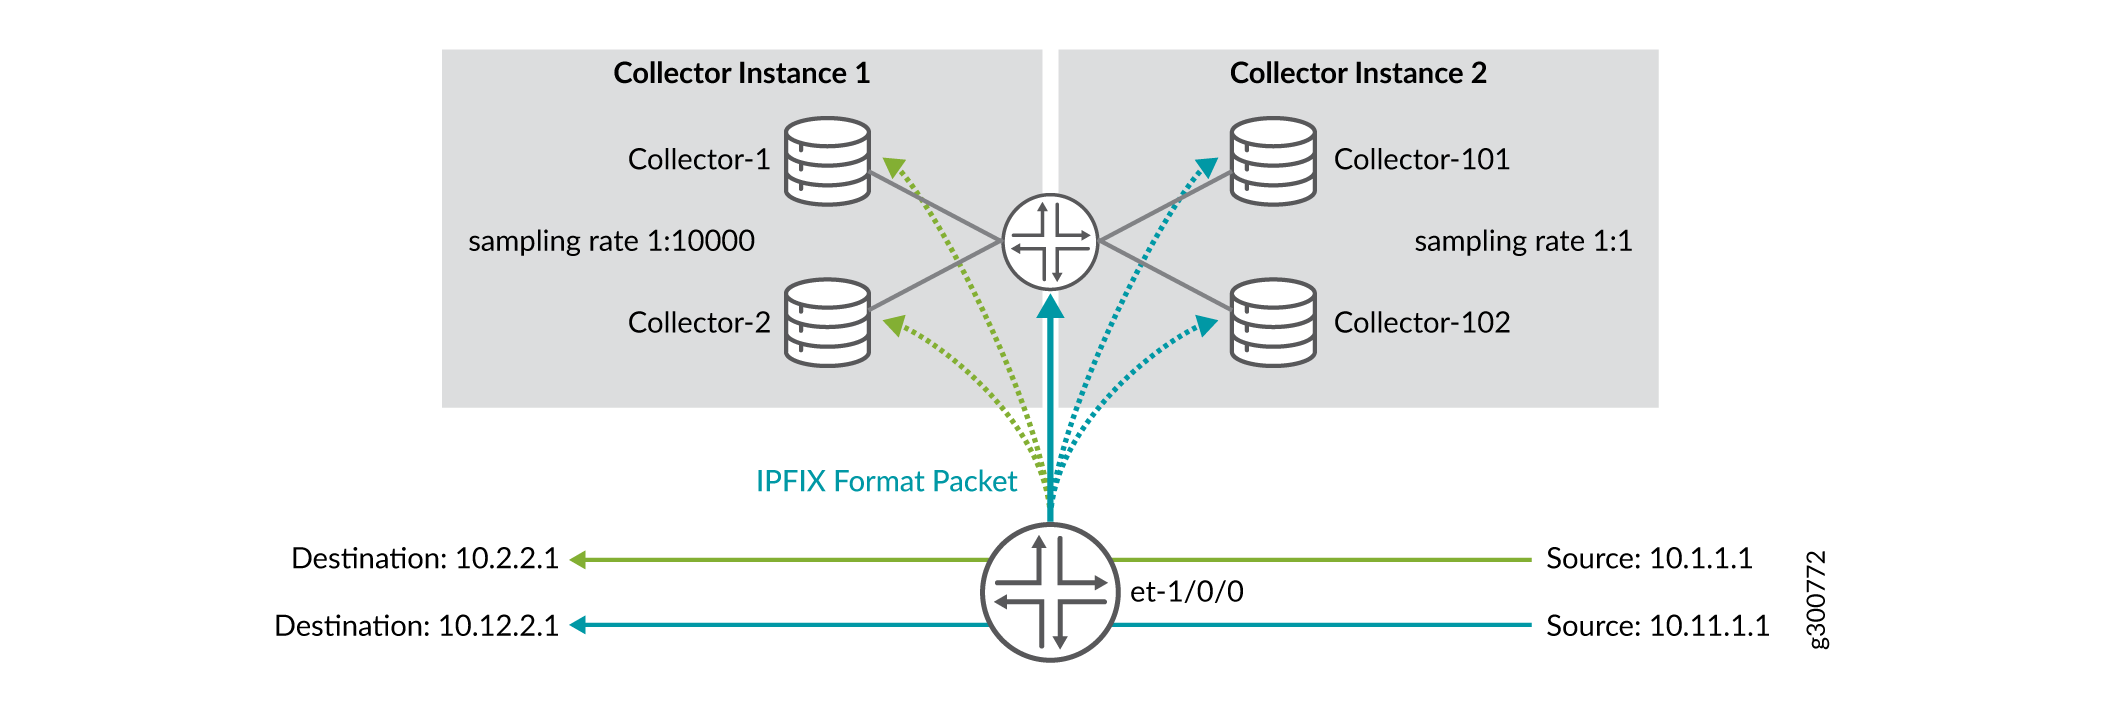
In this example, the et-1/0/0 interface of the device is configured with inline monitoring services. The details of the configurations are as follows:
-
There are two inline-monitoring instances — Instance 1 and Instance 2.
-
There are four collectors, two collectors under each inline monitoring instance.
-
Instance 1 has Collector-1 and Collector-2.
-
Instance 2 has Collector-101 and Collector-102.
-
-
The collectors on Instance 1 have a sampling rate of 1:10000.
-
The collectors on Instance 2 have a sampling rate of 1:1.
-
Instance 1 collectors have a source and destination address of 10.1.1.1 and 10.2.2.1, respectively.
-
Instance 2 collectors have a source and destination address of 10.11.1.1 and 10.12.2.1, respectively.
-
The packets are exported to the collectors in an IPFIX encapsulated format.
To configure inline monitoring services:
Change History Table
Feature support is determined by the platform and release you are using. Use Feature Explorer to determine if a feature is supported on your platform.
family inet and family inet6 sampled
packets in sFlow version 5 format instead of the current IPFIX format. IPFIX
format is the default. Configure the export-format sflow-v5
statement at the [edit inline-monitoring instance
instance-name] hierarchy level to change the
export format. You do not need to configure sFlow (set protocols
sflow CLI command) to activate this feature.any, ccc, ethernet-switch, inet,
inet6, or mpls family firewall filters with the
term action inline-monitoring-instance
inline-monitoring-instance-name.any, ccc,
ethernet-switch, inet, inet6, or mpls family
firewall filters with the term action inline-monitoring-instance
inline-monitoring-instance-name.any, ccc, ethernet-switch, inet,
inet6, or mpls family firewall filters with the
term action inline-monitoring-instance
inline-monitoring-instance-name.any, bridge, ccc,
mpls, or vpls family firewall filters with the
term action inline-monitoring-instance
inline-monitoring-instance-name.