Example: Passive Flow Monitoring Configuration on MX Series Routers
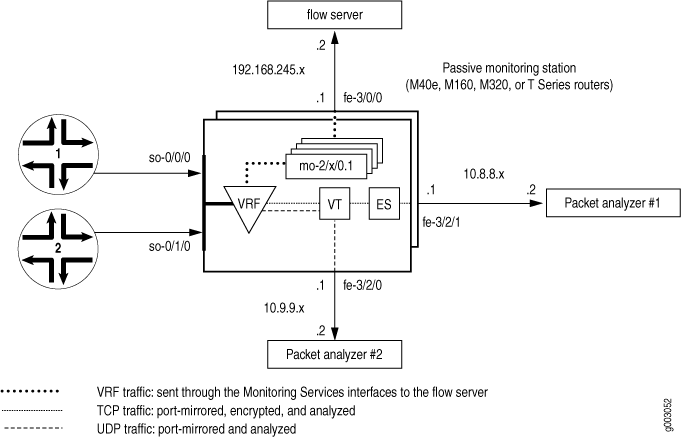
In Figure 1, traffic enters the monitoring station through interfaces so-0/0/0 and so-0/1/0. After the firewall filter accepts the traffic to be monitored, the packets enter a VRF instance.
The original packets travel within the VRF instance to the Monitoring Services PIC for flow processing. The final flow packets are sent from the monitoring services interfaces out the fe-3/0/0 interface to a flow server.
A copy of the accepted traffic is port-mirrored to the Tunnel PIC. As the copied packets enter the tunnel interface, a second firewall filter separates TCP and UDP packets and places them into two filter-based forwarding instances. The UDP instance directs the UDP packets to a packet analyzer attached to fe-3/2/0. The TCP instance sends the TCP packets to the ES PIC for encryption and the ES PIC sends the packets to a second packet analyzer connected to fe-3/2/1.
Your first step is to define a firewall filter
to select packets for monitoring. All filtered traffic must be accepted,
and the port-mirror statement at the [edit firewall
family inet filter filter-name term term-name then] hierarchy level facilitates port
mirroring.
Next, configure the input SONET/SDH interfaces
and apply the firewall filter that you just defined. The passive-monitor-mode statement disables SONET keepalives on the SONET/SDH interfaces
and enables passive flow monitoring.
Configure all other interfaces that you will use with the monitoring application, including the monitoring services interfaces, the export interfaces, the tunnel interface, and the ES interface. Once the interfaces are in place, configure a VRF instance and monitoring group to direct the original packets from the input interfaces to the monitoring services interfaces for processing. The resulting flow description packets exit fe-3/0/0 to reach the flow server.
Next, configure statements to port-mirror the monitored traffic to a tunnel interface. Design a firewall filter that selects some of this copied traffic for further analysis and some of the traffic for discarding. In this case, isolate TCP and UDP traffic and direct these two flows into separate filter-based forwarding routing instances. Remember to apply the filter to the tunnel interface to enable the separation of TCP traffic from UDP traffic. Also, import the interface routes into the forwarding instances with a routing table group.
In the filter-based forwarding instances, define static route next hops. The next hop for the TCP instance is the ES interface and the next hop for the UDP instance is the packet analyzer connected to fe-3/2/0. Finally, configure IPSec so that the next hop for the TCP traffic is the second packet analyzer attached to fe-3/2/1.
[edit]
interfaces {
                   so-0/0/0 { # Traffic enters the router on this interface.
        description “ input interface”;
        encapsulation ppp;
        unit 0 {
                             passive-monitor-mode; # Disables SONET keepalives.
            family inet {
                filter {
                                         input input-monitoring-filter; # The firewall filter is applied here.
                }
            }
        }
    }
                   so-0/1/0 { # Traffic enters the router on this interface.
        description “ input interface”;
        encapsulation ppp;
        unit 0 {
                             passive-monitor-mode;  # Disables SONET keepalives.
            family inet {
                filter {
                                         input input-monitoring-filter;  # The firewall filter is applied here.
                }
            }
        }
    }
                   es-3/1/0 {  # This is where the TCP traffic enters the ES PIC.
        unit 0 {
            tunnel {
                source 10.8.8.1;
                destination 10.8.8.2;
            }
            family inet {
                ipsec-sa sa-esp;
                address 192.0.2.1/32 {
                    destination 192.0.2.2;
                }
            }
        }
    }
                   fe-3/0/0 { # Flow records exit here and travel to the flow server.
        description “ export interface to the flow server”;
        unit 0 {
            family inet;
            address 192.168.245.1/30;
        }
    }
                   fe-3/2/0 { # This export interface for UDP traffic leads to a packet analyzer.
        description “ export interface to the packet analyzer”;
        unit 0 {
            family inet {
                address 10.9.9.1/30;
            }
        }
    }
                   fe-3/2/1 {  # This IPSec tunnel source exports TCP traffic to a packet analyzer.
        unit 0 {
            family inet {
                address 10.8.8.1/30;
            }
        }
    }
                   mo-4/0/0 { # This marks the beginning of the monitoring services interfaces.
        unit 0 { # Unit 0 is part of the inet.0 routing table and generates flow records.
            family inet;
        }
                         unit 1 { # Unit 1 receives monitored traffic and is part of the VRF instance.
            family inet;
        }
    }
                   mo-4/1/0 {
        unit 0 { # Unit 0 is part of the inet.0 routing table and generates flow records.
            family inet;
        }
                         unit 1 { # Unit 1 receives monitored traffic and is part of the VRF instance.
            family inet;
        }
    }
                   mo-4/2/0 {
        unit 0 { # Unit 0 is part of the inet.0 routing table and generates flow records.
            family inet;
        }
                         unit 1 { # Unit 1 receives monitored traffic and is part of the VRF instance.
            family inet;
        }
    }
                   mo-4/3/0 {
        unit 0 { # Unit 0 is part of the inet.0 routing table and generates flow records.
            family inet;
        }
                         unit 1 { # Unit 1 receives monitored traffic and is part of the VRF instance.
            family inet;
        }
    }
                   vt-0/2/0 {  # The tunnel services interface receives the port-mirrored traffic.
        unit 0 {
            family inet {
                filter {
                                         input tunnel-interface-filter;  # The filter splits traffic into TCP and UDP
                }
            }
        }
    }
}
forwarding-options {
                   monitoring group1 {  # Monitored traffic is processed by the monitoring services
        family inet { # interfaces and flow records are sent to the flow server.
                               output {
                export-format cflowd-version-5;
                flow-active-timeout 60;
                flow-inactive-timeout 30;
                                   flow-server 192.168.245.2 port 2055; # IP address and port for server.
                                     interface mo-4/0/0.1 {  # Use monitoring services interfaces for output.
                    engine-id 1; # engine and interface-index statements are optional.
                    engine-type 1;
                    input-interface-index 44;
                    output-interface-index 54;
                                         source-address 192.168.245.1; # This is the IP address of fe-3/0/0.
                }
                interface mo-4/1/0.1 {
                    engine-id 2; # engine and interface-index statements are optional.
                    engine-type 1;
                    input-interface-index 45;
                    output-interface-index 55;
                    source-address 192.168.245.1; # This is the IP address of fe-3/0/0.
                }
                interface mo-4/2/0.1 {
                    engine-id 3; # engine and interface-index statements are optional.
                    engine-type 1;
                    input-interface-index 46;
                    output-interface-index 56;
                    source-address 192.168.245.1; # This is the IP address of fe-3/0/0.
                }
                interface mo-4/3/0.1 {
                    engine-id 4; # engine and interface-index statements are optional.
                    engine-type 1;
                    input-interface-index 47;
                    output-interface-index 57;
                                         source-address 192.168.245.1; # This is the IP address of fe-3/0/0.
                }
            }
        }
    }
                   port-mirroring {  # Copies the traffic and sends it to the Tunnel Services PIC.
        family inet {
            input {
                rate 1;
                run-length 1;
            }
            output {
                                   interface vt-0/2/0.0;
                no-filter-check;
            }
        }
    }
}
             routing-options { # This installs the interface routes into the forwarding instances.
                   interface-routes {


         rib-group inet bc-vrf;
    }
    rib-groups {


         bc-vrf {


         import-rib [inet.0 tcp-routing-table.inet.0 udp-routing-table.inet.0];
        }
    }
    forwarding-table {
        export pplb; # Applies per-packet load balancing to the forwarding table.
    }
}
policy-options {
    policy-statement monitoring-vrf-import {
        then reject;
    }
    policy-statement monitoring-vrf-export {
        then reject;
    }
    policy-statement pplb {
        then {
            load-balance per-packet;
        }
    }
}
             security { # This sets IPSec options for the ES PIC.
    ipsec {
        proposal esp-sha1-3des {
            protocol esp;
            authentication-algorithm hmac-sha1-96;
            encryption-algorithm 3des-cbc;
            lifetime-seconds 180;
        }
        policy esp-group2 {
            perfect-forward-secrecy {
                keys group2;
            }
            proposals esp-sha1-3des;
        }
        security-association sa-esp {
            mode tunnel;
            dynamic {
                ipsec-policy esp-group2;
            }
        }
    }
    ike {
        proposal ike-esp {
            authentication-method pre-shared-keys;
            dh-group group2;
            authentication-algorithm sha1;
            encryption-algorithm 3des-cbc;
            lifetime-seconds 180;
        }
        policy 10.8.8.2 {
            mode aggressive;
            proposals ike-esp;
            pre-shared-key ascii-text "$ABC123";
        }
    }
}
firewall {
    family inet {
        filter input-monitoring-filter { # This filter selects traffic to send into the VRF
            term 1 { # instance and prepares the traffic for port mirroring.
                from {
                    destination-address {
                        10.7.0.0/16;
                    }
                }
                then {
                    port-mirror;
                    accept;
                }
            }
            term 2 {
                from {
                    destination-address {
                        10.6.0.0/16;
                    }
                }
                then accept;
            }
        }
                         filter tunnel-interface-filter {  # This filter breaks the port-mirrored traffic into two
            term tcp { # filter-based forwarding instances: TCP packets and UDP packets.
                from {
                    protocol tcp;
                }
                then { # This counts TCP packets and sends them into a TCP instance.
                    count tcp;
                    routing-instance tcp-routing-table;
                }
            }
            term udp {
                from {
                    protocol udp;
                }
                then { # This counts UDP packets and sends them into a UDP instance.
                    count udp;
                    routing-instance udp-routing-table;
                }
            }
            term rest {
                then {
                    count rest;
                    discard;
                }
            }
        }
    }
}
routing-instances {
                   monitoring-vrf { # This is the VRF instance where you send the traffic. It contains
        instance-type vrf; # the input interface and the monitoring services interfaces.
                       interface so-0/0/0.0; # Traffic enters the router on these input interfaces.
        interface so-0/1/0.0;


         interface mo-4/0/0.1;


         interface mo-4/1/0.1; # These are output interfaces (use them as
        interface mo-4/2/0.1; # output interfaces in your monitoring group).
        interface mo-4/3/0.1;
        route-distinguisher 69:1;
        vrf-import monitoring-vrf-import;
        vrf-export monitoring-vrf-export;
        routing-options { # Sends traffic to a group of monitoring services interfaces.
            static {


         route 0.0.0.0/0 next-hop [mo-4/0/0.1 mo-4/1/0.1
mo-4/2/0.1 mo-4/3/0.1];
            }
        }
    }
                   tcp-routing-table {  # This is the filter-based forwarding instance for TCP traffic.
        instance-type forwarding;
                         routing-options {  # The next hop is the ES PIC.
            static {


         route 0.0.0.0/0 next-hop es-3/1/0.0;
            }
        }
    }
    udp-routing-table { # This is the filter-based forwarding instance for UDP traffic.
        instance-type forwarding;
        routing-options { # The next hop is the second packet analyzer.
            static {


         route 0.0.0.0/0 next-hop 10.9.1.2;
            }
        }
    }
}
Verifying Your Work
To verify that your configuration is correct, use the following commands on the monitoring station that is configured for passive flow monitoring:
-
show route 0/0 -
show passive-monitoring error -
show passive-monitoring flow -
show passive-monitoring memory -
show passive-monitoring status -
show passive-monitoring usage
To clear statistics for the show passive-monitoring
error and show passive-monitoring flow commands,
issue the clear passive-monitoring (all | interface-name) command.
You can also view passive flow monitoring status with the Simple Network Management Protocol (SNMP). The following Management Information Base (MIB) tables are supported:
-
jnxPMonErrorTable—Corresponds to the
show passive-monitoring errorcommand. -
jnxPMonFlowTable—Corresponds to the
show passive-monitoring flowcommand. -
jnxPMonMemoryTable—Corresponds to the
show passive-monitoring memorycommand.
The following section shows the output of the show commands used with the configuration example:
user@host> show route 0/0
 <skip inet.0>
# We are only concerned with the routing-instance route.
bc-vrf.inet.0:  1 destinations, 1 routes (1 active, 0 holddown, 0 hidden)
bc-vrf.inet.0:+ = Active Route, - = Last Active, * = Both
0.0.0.0/0          *[Static/5] 5d 17:34:57
                      via mo-4/0/0.1
                    > via mo-4/1/0.1
                      via mo-4/2/0.1
                      via mo-4/3/0.1
tcp-rt.inet.0: 13 destinations, 13 routes (12 active, 0 holddown, 1
hidden)
+ = Active Route, - = Last Active, * = Both
0.0.0.0/0          *[Static/5] 19:24:39
                    > via es-3/1/0.0
  : <other interface routes>
udp-rt.inet.0: 13 destinations, 13 routes (12 active, 0 holddown, 1
hidden)
+ = Active Route, - = Last Active, * = Both
0.0.0.0/0          *[Static/5] 19:24:39
                    > to 10.9.1.2 via fe-3/2/0.0
  : <other interface routes>
For all show passive-monitoring commands, the output obtained when using a
wildcard (such as *) or the all option is based on the
configured interfaces listed at the [edit forwarding-options monitoring
group-name] hierarchy level. In the output
from the configuration example, you see information only for the configured
interfaces mo-4/0/0, mo-4/1/0,
mo-4/2/0, and mo-4/3/0.
Many of the statements you can configure in a monitoring group, such as
engine-id and engine-type, are visible in
the output of the show passive-monitoring commands.
|
Field |
Explanation |
|---|---|
|
Packets dropped (no memory) |
Number of packets dropped because of memory. |
|
Packets dropped (not IP) |
Number of non-IP packets dropped. |
|
Packets dropped (not IPv4) |
Number of packets dropped because they failed the IPv4 check. |
|
Packets dropped (header too small) |
Number of packets dropped because the packet length or IP header length was too small. |
|
Memory allocation failures |
Number of flow record memory allocation failures. A small number reflects failures to replenish the free list. A large number indicates the monitoring station is almost out of memory space. |
|
Memory free failures |
Number of flow record memory frees. |
|
Memory free list failures |
Number of flow records received from free list that failed. Memory is nearly exhausted or too many new flows greater than 128K are being created in one second. |
|
Memory warning |
The flows have exceeded 1 million packets per second (Mpps) on a Monitoring Services PIC or 2 Mpps on a Monitoring Services II PIC. The response can be Yes or No. |
|
Memory overload |
The memory has been overloaded. The response is Yes or No. |
|
PPS overload |
In packets per second, whether the PIC is receiving more traffic than the configured threshold. The response can be Yes or No. |
|
BPS overload |
In bytes per second, whether the PIC is receiving more traffic than the configured threshold. The response can be Yes or No. |
user@host> show passive-monitoring error all
Passive monitoring interface: mo-4/0/0, Local interface index: 44
  Error information
    Packets dropped (no memory): 0, Packets dropped (not IP): 0
    Packets dropped (not IPv4): 0, Packets dropped (header too small): 0
    Memory allocation failures: 0, Memory free failures: 0
    Memory free list failures: 0
    Memory warning: No, Memory overload: No, PPS overload: No, BPS overload: No

Passive monitoring interface: mo-4/1/0, Local interface index: 45
  Error information
    Packets dropped (no memory): 0, Packets dropped (not IP): 0
    Packets dropped (not IPv4): 0, Packets dropped (header too small): 0
    Memory allocation failures: 0, Memory free failures: 0
    Memory free list failures: 0
    Memory warning: No, Memory overload: No, PPS overload: No, BPS overload: No

Passive monitoring interface: mo-4/2/0, Local interface index: 46
  Error information
    Packets dropped (no memory): 0, Packets dropped (not IP): 0
    Packets dropped (not IPv4): 0, Packets dropped (header too small): 0
    Memory allocation failures: 0, Memory free failures: 0
    Memory free list failures: 0
    Memory warning: No, Memory overload: No, PPS overload: No, BPS overload: No

Passive monitoring interface: mo-4/3/0, Local interface index: 47
  Error information
    Packets dropped (no memory): 0, Packets dropped (not IP): 0
    Packets dropped (not IPv4): 0, Packets dropped (header too small): 0
    Memory allocation failures: 0, Memory free failures: 0
    Memory free list failures: 0
    Memory warning: No, Memory overload: No, PPS overload: No, BPS overload: No
|
Field |
Explanation |
|---|---|
|
Flow packets |
Number of packets received by an operational PIC. |
|
Flow bytes |
Number of bytes received by an operational PIC. |
|
Flow packets 10-second rate |
Number of packets per second handled by the PIC and displayed as a 10-second average. |
|
Flow bytes 10-second rate |
Number of bytes per second handled by the PIC and displayed as a 10-second average. |
|
Active flows |
Number of currently active flows tracked by the PIC. |
|
Total flows |
Total number of flows received by an operational PIC. |
|
Flows exported |
Total number of flows exported by an operational PIC. |
|
Flows packets exported |
Total number of flow packets exported by an operational PIC. |
|
Flows inactive timed out |
Total number of flows that are exported because of inactivity. |
|
Flows active timed out |
Total number of long-lived flows that are exported because of an active timeout. |
user@host> show passive-monitoring flow all
Passive monitoring interface: mo-4/0/0, Local interface index: 44
  Flow information
    Flow packets: 6533434, Flow bytes: 653343400
    Flow packets 10-second rate: 0, Flow bytes 10-second rate: 0
    Active flows: 0, Total flows: 1599
    Flows exported: 1599, Flows packets exported: 55
    Flows inactive timed out: 1599, Flows active timed out: 0

Passive monitoring interface: mo-4/1/0, Local interface index: 45
  Flow information
    Flow packets: 6537780, Flow bytes: 653778000
    Flow packets 10-second rate: 0, Flow bytes 10-second rate: 0
    Active flows: 0, Total flows: 1601
    Flows exported: 1601, Flows packets exported: 55
    Flows inactive timed out: 1601, Flows active timed out: 0

Passive monitoring interface: mo-4/2/0, Local interface index: 46
  Flow information
    Flow packets: 6529259, Flow bytes: 652925900
    Flow packets 10-second rate: 0, Flow bytes 10-second rate: 0
    Active flows: 0, Total flows: 1599
    Flows exported: 1599, Flows packets exported: 55
    Flows inactive timed out: 1599, Flows active timed out: 0

Passive monitoring interface: mo-4/3/0, Local interface index: 47
  Flow information
    Flow packets: 6560741, Flow bytes: 656074100
    Flow packets 10-second rate: 0, Flow bytes 10-second rate: 0
    Active flows: 0, Total flows: 1598
    Flows exported: 1598, Flows packets exported: 55
    Flows inactive timed out: 1598, Flows active timed out: 0
|
Field |
Explanation |
|---|---|
|
Allocation count |
Number of flow records allocated. |
|
Free count |
Number of flow records freed. |
|
Maximum allocated |
Maximum number of flow records allocated since the monitoring station booted. This number represents the peak number of flow records allocated at a time. |
|
Allocations per second |
Flow records allocated per second during the last statistics interval on the PIC. |
|
Frees per second |
Flow records freed per second during the last statistics interval on the PIC. |
|
Total memory used |
Total amount of memory currently used (in bytes). |
|
Total memory free |
Total amount of memory currently free (in bytes). |
user@host> show passive-monitoring memory all
Passive monitoring interface: mo-4/0/0, Local interface index: 44
  Memory utilization
    Allocation count: 1600, Free count: 1599, Maximum allocated: 1600
    Allocations per second: 3200, Frees per second: 1438
    Total memory used (in bytes): 103579176, Total memory free (in bytes): 163914184

Passive monitoring interface: mo-4/1/0, Local interface index: 45
  Memory utilization
    Allocation count: 1602, Free count: 1601, Maximum allocated: 1602
    Allocations per second: 3204, Frees per second: 1472
    Total memory used (in bytes): 103579176, Total memory free (in bytes): 163914184

Passive monitoring interface: mo-4/2/0, Local interface index: 46
  Memory utilization
    Allocation count: 1600, Free count: 1599, Maximum allocated: 1600
    Allocations per second: 3200, Frees per second: 1440
    Total memory used (in bytes): 103579176, Total memory free (in bytes): 163914184

Passive monitoring interface: mo-4/3/0, Local interface index: 47
  Memory utilization
    Allocation count: 1599, Free count: 1598, Maximum allocated: 1599
    Allocations per second: 3198, Frees per second: 1468
    Total memory used (in bytes): 103579176, Total memory free (in bytes): 163914184
|
Field |
Explanation |
|---|---|
|
Interface state |
Indicates whether the interface is monitoring (operating properly), disabled (administratively disabled), or not monitoring (not configured). |
|
Group index |
Integer that represents the monitoring group of which the PIC is a member. (This does not indicate the number of monitoring groups.) |
|
Export interval |
Configured export interval for flow records, in seconds. |
|
Export format |
Configured export format (only v5 is currently supported). |
|
Protocol |
Protocol the PIC is configured to monitor (only IPv4 is currently supported). |
|
Engine type |
Configured engine type that is inserted in output flow packets. |
|
Engine ID |
Configured engine ID that is inserted in output flow packets. |
|
Route record count |
Number of routes recorded. |
|
IFL to SNMP index count |
Number of logical interfaces mapped to an SNMP index. |
|
AS count |
Number of AS boundaries that the flow has crossed. |
|
Time set |
Indicates whether the time stamp is in place. |
|
Configuration set |
Indicates whether the monitoring configuration is set. |
|
Route record set |
Indicates whether routes are being recorded. |
|
IFL SNMP map set |
Indicates whether logical interfaces are being mapped to an SNMP index. |
user@host> show passive-monitoring status all
Passive monitoring interface: mo-4/0/0, Local interface index: 44
  Interface state: Monitoring
  Group index: 0
  Export interval: 15 secs, Export format: cflowd v5
  Protocol: IPv4, Engine type: 1, Engine ID: 1
  Route record count: 13, IFL to SNMP index count: 30, AS count: 1
  Time set: Yes, Configuration set: Yes
  Route record set: Yes, IFL SNMP map set: Yes

Passive monitoring interface: mo-4/1/0, Local interface index: 45
  Interface state: Monitoring
  Group index: 0
  Export interval: 15 secs, Export format: cflowd v5
  Protocol: IPv4, Engine type: 1, Engine ID: 2
  Route record count: 13, IFL to SNMP index count: 30, AS count: 1
  Time set: Yes, Configuration set: Yes
  Route record set: Yes, IFL SNMP map set: Yes

Passive monitoring interface: mo-4/2/0, Local interface index: 46
  Interface state: Monitoring
  Group index: 0
  Export interval: 15 secs, Export format: cflowd v5
  Protocol: IPv4, Engine type: 1, Engine ID: 3
  Route record count: 13, IFL to SNMP index count: 30, AS count: 1
  Time set: Yes, Configuration set: Yes
  Route record set: Yes, IFL SNMP map set: Yes

Passive monitoring interface: mo-4/3/0, Local interface index: 47
  Interface state: Monitoring
  Group index: 0
  Export interval: 15 secs, Export format: cflowd v5
  Protocol: IPv4, Engine type: 1, Engine ID: 4
  Route record count: 13, IFL to SNMP index count: 30, AS count: 1
  Time set: Yes, Configuration set: Yes
  Route record set: Yes, IFL SNMP map set: Yes
|
Field |
Explanation |
|---|---|
|
Uptime |
Time, in milliseconds, that the PIC has been operational. |
|
Interrupt time |
Cumulative time that the PIC spent in processing packets since the last PIC reset. |
|
Load (5 second) |
CPU load on the PIC averaged over 5 seconds. The number is a percentage obtained by dividing the time spent on active tasks by the total elapsed time. |
|
Load (1 minute) |
CPU load on the PIC averaged over 1 minute. The number is a percentage obtained by dividing the time spent on active tasks by the total elapsed time. |
user@host> show passive-monitoring usage *
Passive monitoring interface: mo-4/0/0, Local interface index: 44
  CPU utilization
    Uptime: 653155 milliseconds, Interrupt time: 40213754 microseconds
    Load (5 second): 20%, Load (1 minute): 17%

Passive monitoring interface: mo-4/1/0, Local interface index: 45
  CPU utilization
    Uptime: 652292 milliseconds, Interrupt time: 40223178 microseconds
    Load (5 second): 22%, Load (1 minute): 15%

Passive monitoring interface: mo-4/2/0, Local interface index: 46
  CPU utilization
    Uptime: 649491 milliseconds, Interrupt time: 40173645 microseconds
    Load (5 second): 22%, Load (1 minute): 10098862%

Passive monitoring interface: mo-4/3/0, Local interface index: 47
  CPU utilization
    Uptime: 657328 milliseconds, Interrupt time: 40368704 microseconds
    Load (5 second): 1%, Load (1 minute): 15%