Example: Sampling Configuration for MX Series Routers
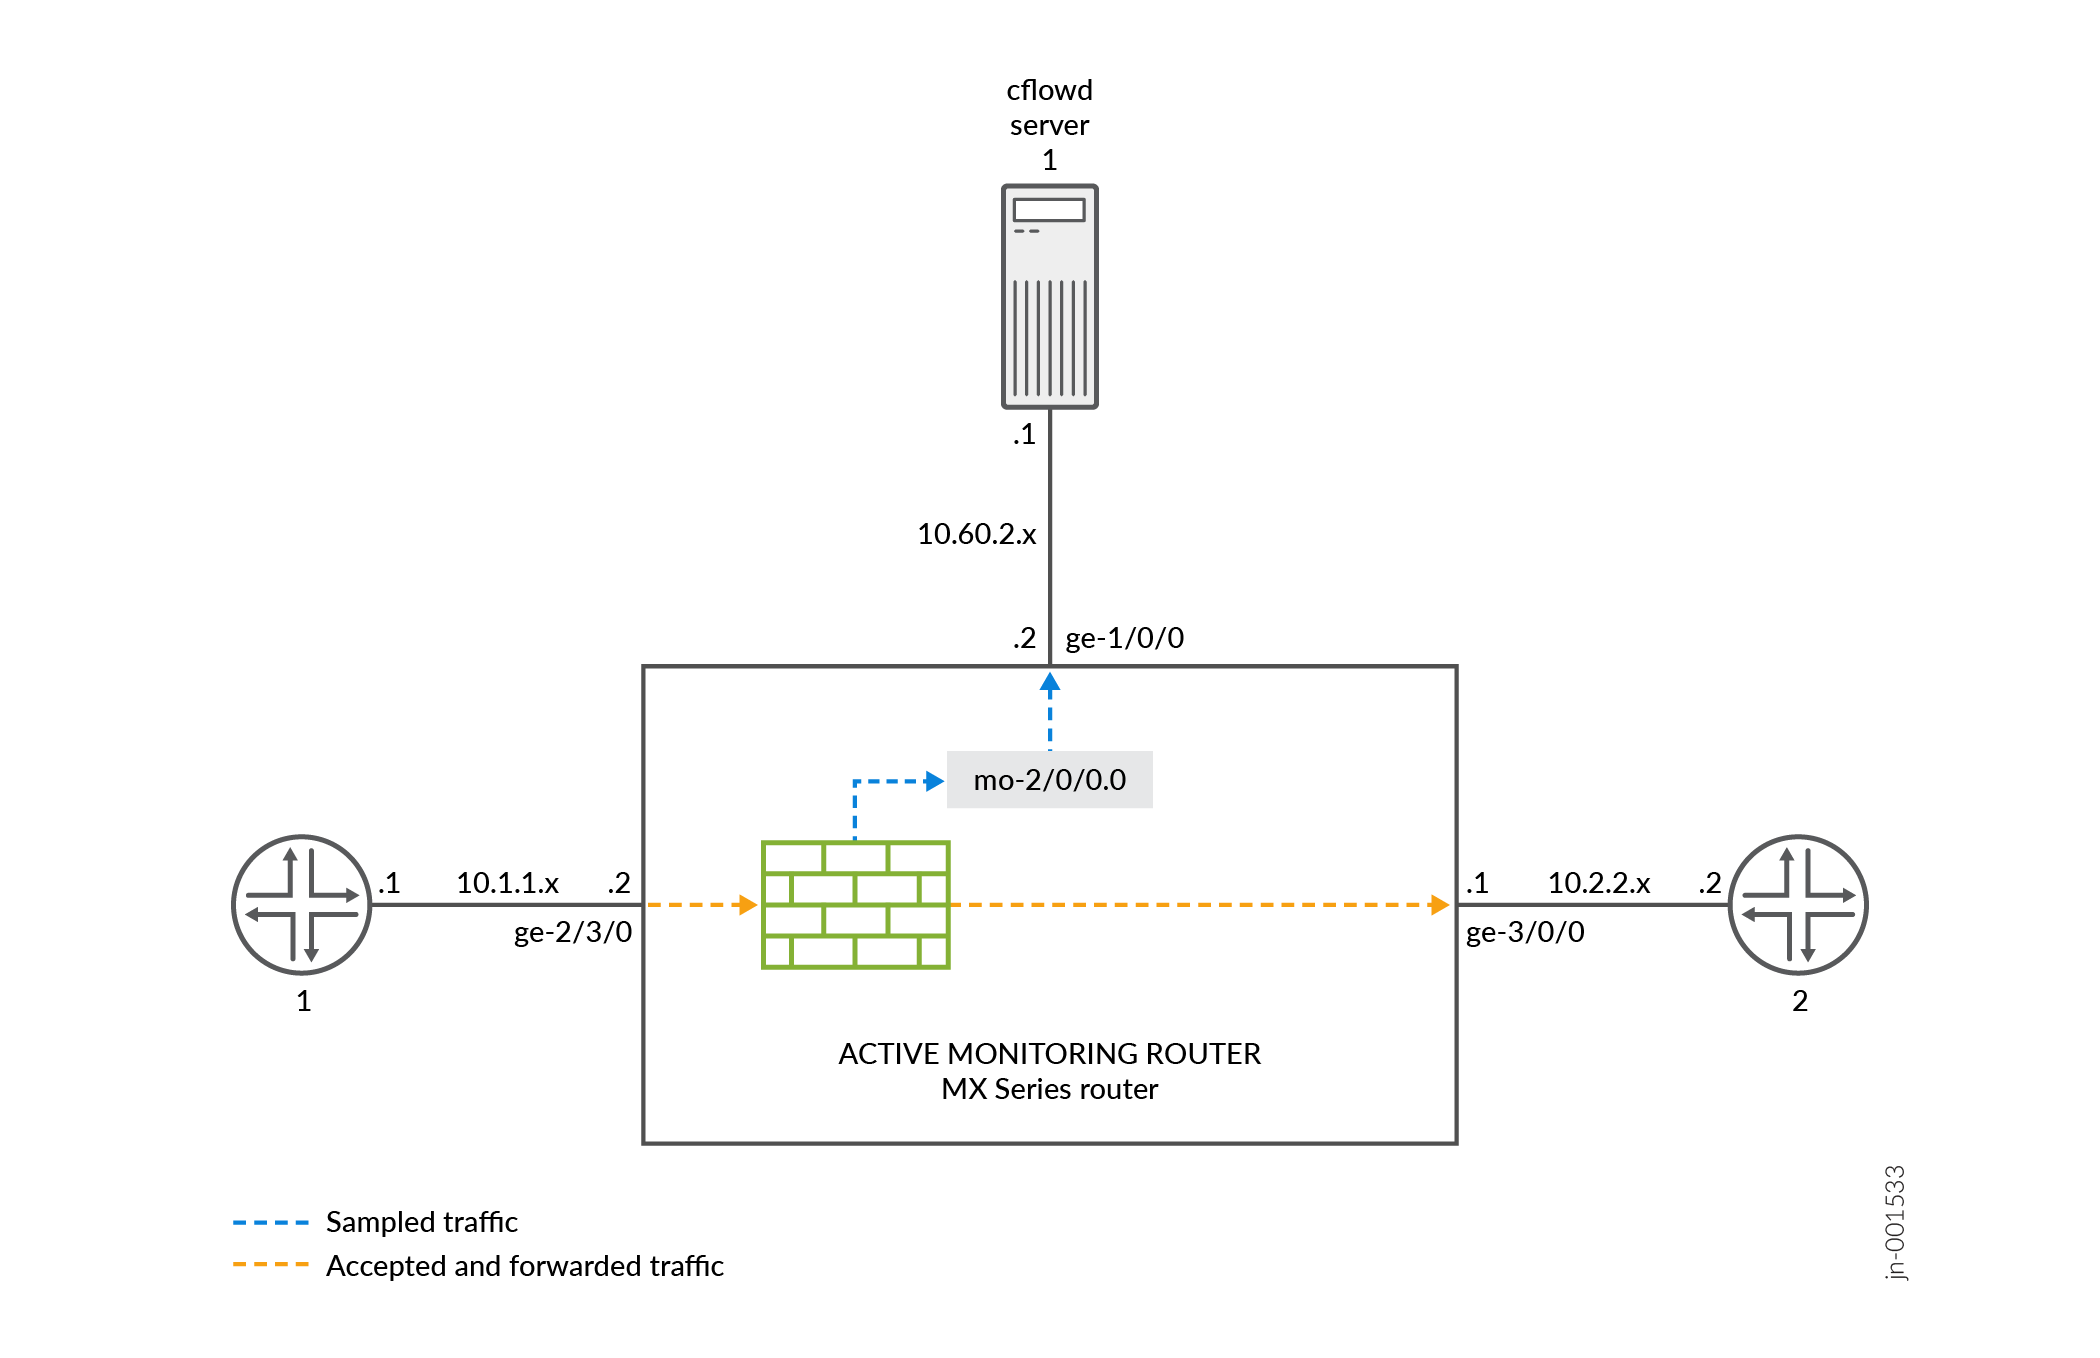
In Figure 1, traffic from Router 1 arrives on the monitoring router's Gigabit Ethernet ge-2/3/0 interface. The exit interface on the monitoring router that leads to destination Router 2 is ge-3/0/0. In active flow monitoring, both the input interface and exit interface can be any interface type (such as Gigabit Ethernet). The export interface leading to the flow server is ge-1/0/0.
Configure a firewall filter to sample, count, and accept all traffic. Apply the filter to the input interface, and configure the exit interface (for traffic forwarding), the adaptive services interface (for flow processing), and the export interface (for exporting flow records).
Configure sampling at the [edit forwarding-options] hierarchy level. Include the IP address and port of the flow server
with the flow-server statement and specify the adaptive
services interface to be used for flow record processing with the interface statement at the [edit forwarding-options sampling] hierarchy level.
Router 1
[edit]
interfaces {
   sp-2/0/0 { # This adaptive services interface creates the flow records.
        unit 0 {
            family inet {
                address 10.5.5.1/32 {
                    destination 10.5.5.2;
                }
            }
        }
    }
   ge-1/0/0 { # This is the interface where records are sent to the flow server.
        unit 0 {
            family inet {
                address 10.60.2.2/30;
            }
        }
    }
   ge-2/3/0 { # This is the input interface where all traffic enters the router.
        unit 0 {
            family inet {
                filter {
                   input catch_all; # This is where the firewall filter is applied.
                }
                address 10.1.1.1/20;
            }
        }
    }
   ge-3/0/0 { # This is the interface where the original traffic is forwarded.
        unit 0 {
            family inet {
                address 10.2.2.1/24;
            }
        }
    }
}
forwarding-options {
   sampling { # Traffic is sampled and sent to a flow server.
        input {
           rate 1; # Samples 1 out of x packets (here, a rate of 1 sample per packet).
        }
        family inet {
            output {
               flow-server 10.60.2.1 { # The IP address and port of the flow server.
                    port 2055;
                    version 5; # Records are sent to the flow server using version 5 format.
                }
                flow-inactive-timeout 15;
                flow-active-timeout 60;
                interface sp-2/0/0 { # Adding an interface here enables PIC-based sampling.
                    engine-id 5; # Engine statements are dynamic, but can be configured.
                    engine-type 55;
                    source-address 10.60.2.2; # You must configure this statement.
                }
            }
        }
    }
}
firewall {
    family inet {
        filter catch_all { # Apply this filter on the input interface.
            term default {
                then {
                    sample;
                    count counter1;
                    accept;
                }
            }
        }
    }
}
Verifying Your Work
To verify that your configuration is correct, use the following commands on the monitoring station that is configured for active flow monitoring:
show services accounting errorsshow services accounting (flow | flow-detail)show services accounting memoryshow services accounting packet-size-distributionshow services accounting statusshow services accounting usageshow services accounting aggregation template template-name name (detail | extensive | terse)(version 9 only)
Most active flow monitoring operational mode commands contain equivalent output information to the following passive flow monitoring commands:
show services accounting errors =show passive-monitoring errorshow services accounting flow =show passive-monitoring flowshow services accounting memory =show passive-monitoring memoryshow services accounting status =show passive-monitoring statusshow services accounting usage = show passive-monitoring usage
The active flow monitoring commands can be used
with most active flow monitoring applications, including sampling,
discard accounting, port mirroring, and multiple port mirroring. However,
you can use the passive flow monitoring commands only with configurations
that contain a monitoring group at the [edit forwarding-options
monitoring] hierarchy level.
The following shows the output of the show commands used with the configuration example:
user@router1> show services accounting errors
Service Accounting interface: sp-2/0/0, Local interface index: 542
Service name: (default sampling)
  Error information
    Packets dropped (no memory): 0, Packets dropped (not IP): 0
    Packets dropped (not IPv4): 0, Packets dropped (header too small): 0
    Memory allocation failures: 0, Memory free failures: 0
    Memory free list failures: 0
    Memory overload: No, PPS overload: No, BPS overload: Yes

user@router1> show services accounting flow-detail limit 10
Service Accounting interface: sp-2/0/0, Local interface index: 468
Service name: (default sampling)
Protocol   Source         Source  Destination Destination    Packet        Byte
           Address          Port  Address            Port     count       count
udp(17)    10.1.1.2           53  10.0.0.1             53      4329     3386035
ip(0)      10.1.1.2            0  10.0.0.2              0      4785     3719654
ip(0)      10.1.1.2            0  10.0.1.2              0      4530     3518769
udp(17)    10.1.1.2            0  10.0.7.1              0      5011     3916767
tcp(6)     10.1.1.2           20  10.3.0.1             20         1        1494
tcp(6)     10.1.1.2           20  10.168.80.1          20         1         677
tcp(6)     10.1.1.2           20  10.69.192.1          20         1         446
tcp(6)     10.1.1.2           20  10.239.240.1         20         1        1426
tcp(6)     10.1.1.2           20  10.126.160.1         20         1         889
tcp(6)     10.1.1.2           20  10.71.224.1          20         1        1046

user@router1>  show services accounting memory
Service Accounting interface: sp-2/0/0, Local interface index: 468
Service name: (default sampling)
  Memory utilization
    Allocation count: 437340, Free count: 430681, Maximum allocated: 6782
    Allocations per second: 3366, Frees per second: 6412
    Total memory used (in bytes): 133416928, Total memory free (in bytes): 133961744

user@router1>  show services accounting packet-size-distribution
Service Accounting interface: sp-2/0/0, Local interface index: 468
Service name: (default sampling)
Range start     Range end     Number of packets     Percentage packets
         64            96               1705156                    100

user@router1>  show services accounting status
Service Accounting interface: sp-2/0/0, Local interface index: 468
Service name: (default sampling)
  Interface state: Monitoring
  Group index: 0
  Export interval: 60 secs, Export format: cflowd v5
  Protocol: IPv4, Engine type: 55, Engine ID: 5
  Route record count: 13, IFL to SNMP index count: 30, AS count: 1
  Time set: Yes, Configuration set: Yes
  Route record set: Yes, IFL SNMP map set: Yes

user@router1>  show services accounting usage
Service Accounting interface: sp-2/0/0, Local interface index: 468
Service name: (default sampling)
  CPU utilization
    Uptime: 4790345 milliseconds, Interrupt time: 1668537848 microseconds
    Load (5 second): 71%, Load (1 minute): 63%