
Example: Select a LAG member to Test with TWAMP
TWAMP is a layer 3 protocol, which means that test probes follow the routing table. You can select an aggregated Ethernet interface for running TWAMP tests. However, when testing over aggregated links, probes are subject to hash-based load balancing, just like any other packet. If you need to manually select the LAG member for testing, both on the way out and on the way back, you can do this by taking advantage of TWAMP support for MPLS segment routing.
TWAMP is an open protocol for measuring network performance between any two devices in a network that supports the TWAMP protocol. TWAMP consists of the TWAMP-Control protocol and TWAMP-Test protocol. The TWAMP-Control protocol is used to initiate, start and stop the test sessions at the TWAMP client. TWAMP also offers a light operation mode, where the TWAMP-Control part of the protocol is skipped and the server simply reflects any probe received on a preset UDP port (port 862 is reserved to that end). The TWAMP-Test protocol exchanges the test packets between the session sender and the session reflector.
The TWAMP server is an end system that manages one or more TWAMP sessions and is capable of configuring per-session ports. The TWAMP server listens to the TCP port. The session reflector and TWAMP server make up the TWAMP responder in an IP service-level agreement operation.
By default, TWAMP test probes are distributed across LAG members using hash-based load balancing. Because you cannot predict what path the probes take, the test results vary and cannot be used to accurately measure the performance and adherence to service level agreements for the link. In this example, you can override that load balancing to gain more accurate measurements. Along with configuring the TWAMP client and server to generate probes, you override the load balancing as follows:
- Configure a LAG interface.
-
Additionally, configure MPLS static LSPs to explicitly select a specific LAG member each for the forward and for the return path, then configure source routing on the TWAMP client to enable the test probes to use these static LSPs.
Prerequisites
This example has the following requirements:
|
Hardware requirements |
PTX Series routers |
|
Software requirements |
Junos OS Evolved Release 24.4R1 or later |
|
Licensing requirements |
None |
Before You Begin
Before you begin configuring the TWAMP client and the TWAMP server, ensure that you have read Understand Two-Way Active Measurement Protocol to understand how this task fits into the overall configuration process.
Functional Overview
Here's a summary of the technologies used in this example, along with a summary the show commands you use to verify that you have configured everything correctly:
|
Technologies used |
|
|
Primary verification tasks |
|
Topology Overview
In this topology, device R1 is the TWAMP client. As such, this device initiates, starts, and stops the TWAMP test sessions. Device R2 is the TWAMP server. As such, this device manages TWAMP test sessions and reflects TWAMP probes back to the TWAMP client.
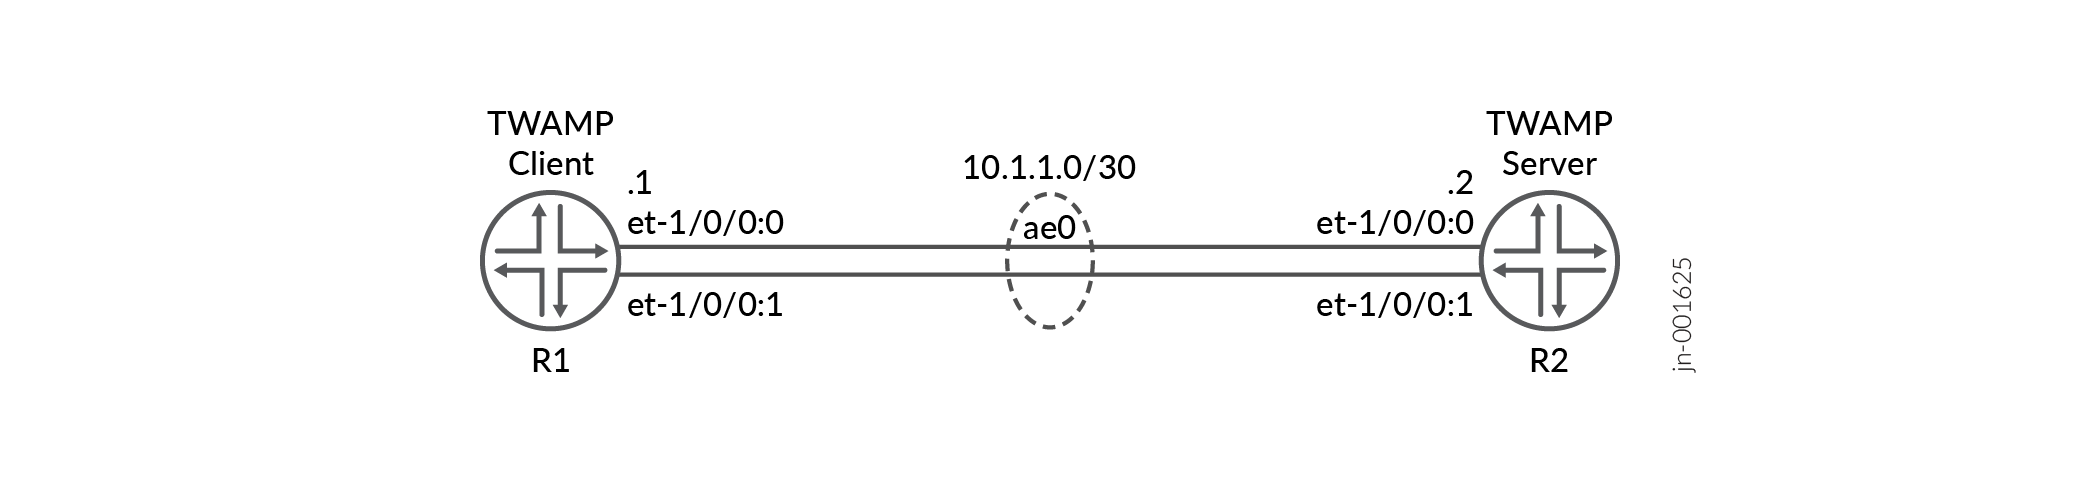
Here's a summary of the configuration tasks for this topology by device:
|
Hostname |
Role |
Function |
|---|---|---|
|
R1 |
TWAMP client |
Configure TWAMP client, test sessions, and aggregated Ethernet interfaces. Optionally, configure an MPLS static LSP and source routing for TWAMP. |
|
R2 |
TWAMP server |
Configure TWAMP test sessions, aggregated Ethernet interfaces, and the TWAMP server. Optionally, configure an MPLS static LSP for the return path. |
For sample configuration and show commands for the devices, see:
Configure R1 (TWAMP Client)
The following example shows a procedure for a TWAMP client configuration with a LAG interface to ensure that TWAMP probes follow a fixed path. In an optional step, you configure MPLS static LSPs on the LAG interface for the forward path and configure segment routing for the TWAMP test session to explicitly select a specific LAG member for the forward and return paths. For this ability, you do not need to use MPLS segment routing across the network. You simply need to set up the LAG interface on both the TWAMP client and the TWAMP server to process basic MPLS. For this example, no packet, TWAMP or otherwise, needs to leave the client or server with an MPLS tag; this is a local routing scheme.
Configure R2 (TWAMP Server)
The following example shows a procedure for a TWAMP server configuration with a LAG interface, for both the forward and return paths, to ensure that TWAMP probes follow a fixed path. In an optional step, you configure MPLS static LSPs on the LAG interface to explicitly select a specific LAG member for the return path.
Verification
Confirm that the configuration is working properly.
| Command | Task |
|---|---|
|
show services monitoring twamp client test-info |
Verify that the TWAMP client is established and active on device R1. |
|
show services monitoring twamp server test-info |
Verify that the TWAMP test sessions are established on device R2. |
|
show services monitoring twamp client probe-results |
Verify that the TWAMP test sessions are generating probes. |
|
show services monitoring twamp client history-results brief control-connection id |
Verify that a particular TWAMP control connection is established and active. |
|
show route table mpls.0 label label detail |
(Optional) If you have configured MPLS static LSPs and source routing for TWAMP, verify that the MPLS static LSPs for the paths are established and active. For the forward path, issue this command on the TWAMP client device. For the return path, issue this command on the TWAMP server device. |
- Verify TWAMP Client Sessions
- Verify TWAMP Server Test Sessions
- Verify that Probe Results are Generated
- Verify Details about a Particular Control Session
- Verify the MPLS Static LSP for the Forward or Return Path
Verify TWAMP Client Sessions
Purpose
Verify that the TWAMP client sessions are established on device R1.
Action
From operational mode, enter the show services monitoring twamp
client test-info command.
user@R1-RE0> show services monitoring twamp client test-info
Control                Test                   Client                Server                Test
name                   name                   address:port          address:port          status
c1                     member-1               10.1.1.1:39681        10.1.1.2:862          active
Meaning
The configured control and test sessions (c1 and member-1, respectively) are established on device R1.
Verify TWAMP Server Test Sessions
Purpose
Verify that the TWAMP server control sessions are established on device R2.
Action
From operational mode, enter the show services monitoring twamp
server test-info command.
user@R2-RE0> show services monitoring twamp server test-info
Control                Test                   Client                Server                Test
identifier             identifier             address:port          address:port          status
1                      34                     10.1.1.1:45183        10.1.1.2:10000        active
Meaning
The test session on device R2 is established and active, with device R1 as the client and device R2 as the server.
Verify that Probe Results are Generated
Purpose
Verify that the TWAMP test sessions are generating probes.
Action
From operational mode, enter the show services monitoring twamp
client probe-results command on device R1.
user@R1-RE0> show services monitoring twamp client probe-results
Owner: c1, Test: member-1
Target address: 10.1.1.2, Source address: 10.1.1.1, Probe type: twamp, Test size: 10
  Probe results:
    Probe response received
    Probe sent time: 08/05/25 09:07:24.202777
    Probe rcvd time: 08/05/25 09:07:24.215813, Client and server offload timestamping
    Rtt: 12023 usec, Rtt jitter: 404 usec
    Egress jitter: 282 usec, Ingress jitter: 122 usec
  Results over current test:
    Probes sent: 7, Probes received: 7, Loss percentage: 0.00
    Measurement: Round trip time (usec)
      Samples: 7, Minimum: 10434, Maximum: 12023, Average: 11104, Stddev: 552
    Measurement: Round trip jitter (usec)
      Samples: 6, Minimum: 72, Maximum: 1113, Average: 497, Stddev: 332
    Measurement: Egress delay (usec)
      Samples: 7, Minimum: 5569, Maximum: 6678, Average: 6055, Stddev: 389
    Measurement: Egress jitter (usec)
      Samples: 6, Minimum: 74, Maximum: 753, Average: 417, Stddev: 216
    Measurement: Ingress delay (usec)
      Samples: 7, Minimum: 4863, Maximum: 5345, Average: 5049, Stddev: 176
    Measurement: Ingress jitter (usec)
      Samples: 6, Minimum: 2, Maximum: 360, Average: 120, Stddev: 115
  Results over last test:
    Probes sent: 10, Probes received: 10, Loss percentage: 0.00
    Measurement: Round trip time (usec)
      Samples: 10, Minimum: 10554, Maximum: 12048, Average: 11262, Stddev: 433
    Measurement: Round trip jitter (usec)
      Samples: 9, Minimum: 39, Maximum: 1297, Average: 510, Stddev: 377
    Measurement: Egress delay (usec)
      Samples: 10, Minimum: 5570, Maximum: 6719, Average: 6127, Stddev: 365
    Measurement: Egress jitter (usec)
      Samples: 9, Minimum: 65, Maximum: 1115, Average: 396, Stddev: 298
    Measurement: Ingress delay (usec)
      Samples: 10, Minimum: 4930, Maximum: 5339, Average: 5134, Stddev: 165
    Measurement: Ingress jitter (usec)
      Samples: 9, Minimum: 90, Maximum: 355, Average: 197, Stddev: 80
  Results over all tests:
    Probes sent: 1597, Probes received: 1421, Loss percentage: 11.02
    Measurement: Round trip time (usec)
      Samples: 1421, Minimum: 9969, Maximum: 17830, Average: 11160, Stddev: 762
    Measurement: Round trip jitter (usec)
      Samples: 1420, Minimum: 0, Maximum: 6988, Average: 701, Stddev: 758
    Measurement: Egress delay (usec)
      Samples: 1421, Minimum: 5205, Maximum: 12581, Average: 6050, Stddev: 594
    Measurement: Egress jitter (usec)
      Samples: 1420, Minimum: 0, Maximum: 6783, Average: 516, Stddev: 611
    Measurement: Ingress delay (usec)
      Samples: 1421, Minimum: 4510, Maximum: 9845, Average: 5109, Stddev: 363
    Measurement: Ingress jitter (usec)
      Samples: 1420, Minimum: 0, Maximum: 4902, Average: 265, Stddev: 412
Meaning
The configured control and test sessions (c1 and member-1, respectively) on device R1 are generating probe results.
Verify Details about a Particular Control Session
Purpose
Verify that a particular TWAMP control connection is established and active.
Action
From operational mode, enter the show services monitoring twamp
client history-results brief control-connection c1 command on
device R1.
user@R1-RE0> show services monitoring twamp client history-results brief control-connection c1
Owner, Test                  Probe sent                 Probe received             Round trip time
c1, member-1                 08/05/25 09:07:45.237300   08/05/25 09:07:45.248755   10494 usec
c1, member-1                 08/05/25 09:07:44.237027   08/05/25 09:07:44.248735   10794 usec
c1, member-1                 08/05/25 09:07:43.237374   08/05/25 09:07:43.248930   10867 usec
c1, member-1                 08/05/25 09:07:42.237273   08/05/25 09:07:42.249013   11012 usec
c1, member-1                 08/05/25 09:07:41.236215   08/05/25 09:07:41.247803   10774 usec
c1, member-1                 08/05/25 09:07:40.235591   08/05/25 09:07:40.247562   11008 usec
c1, member-1                 08/05/25 09:07:39.234551   08/05/25 09:07:39.246386   11066 usec
c1, member-1                 08/05/25 09:07:38.233660   08/05/25 09:07:38.245450   10805 usec
c1, member-1                 08/05/25 09:07:37.220455   08/05/25 09:07:37.231839   10576 usec
c1, member-1                 08/05/25 09:07:36.219937   08/05/25 09:07:36.232805   12143 usec
c1, member-1                 08/05/25 09:07:35.220355   08/05/25 09:07:35.231744   10846 usec
c1, member-1                 08/05/25 09:07:34.219789   08/05/25 09:07:34.231266   10676 usec
c1, member-1                 08/05/25 09:07:33.220270   08/05/25 09:07:33.231890   10861 usec
c1, member-1                 08/05/25 09:07:32.219558   08/05/25 09:07:32.231260   10974 usec
c1, member-1                 08/05/25 09:07:31.219150   08/05/25 09:07:31.231279   11275 usec
c1, member-1                 08/05/25 09:07:30.218498   08/05/25 09:07:30.232170   12788 usec
c1, member-1                 08/05/25 09:07:29.217418   08/05/25 09:07:29.229186   10936 usec
c1, member-1                 08/05/25 09:07:28.216317   08/05/25 09:07:28.228902   11852 usec
c1, member-1                 08/05/25 09:07:27.203306   08/05/25 09:07:27.215328   11136 usec
c1, member-1                 08/05/25 09:07:26.203128   08/05/25 09:07:26.214564   10515 usec
c1, member-1                 08/05/25 09:07:25.203395   08/05/25 09:07:25.214963   10591 usec
c1, member-1                 08/05/25 09:07:24.202777   08/05/25 09:07:24.215813   12023 usec
c1, member-1                 08/05/25 09:07:23.203144   08/05/25 09:07:23.215708   11619 usec
c1, member-1                 08/05/25 09:07:22.203242   08/05/25 09:07:22.214568   10506 usec
c1, member-1                 08/05/25 09:07:21.202605   08/05/25 09:07:21.213813   10434 usec
c1, member-1                 08/05/25 09:07:20.202272   08/05/25 09:07:20.213983   10996 usec
c1, member-1                 08/05/25 09:07:19.201884   08/05/25 09:07:19.213674   10771 usec
c1, member-1                 08/05/25 09:07:18.202167   08/05/25 09:07:18.214142   11380 usec
c1, member-1                 08/05/25 09:07:17.188302   08/05/25 09:07:17.201060   12048 usec
c1, member-1                 08/05/25 09:07:16.187708   08/05/25 09:07:16.199696   11260 usec
c1, member-1                 08/05/25 09:07:15.188363   08/05/25 09:07:15.199914   10855 usec
c1, member-1                 08/05/25 09:07:14.187872   08/05/25 09:07:14.199787   11163 usec
c1, member-1                 08/05/25 09:07:13.187272   08/05/25 09:07:13.199107   11101 usec
c1, member-1                 08/05/25 09:07:12.187280   08/05/25 09:07:12.199982   11851 usec
c1, member-1                 08/05/25 09:07:11.187216   08/05/25 09:07:11.198677   10554 usec
c1, member-1                 08/05/25 09:07:10.187337   08/05/25 09:07:10.199332   11189 usec
c1, member-1                 08/05/25 09:07:09.187197   08/05/25 09:07:09.199247   11150 usec
c1, member-1                 08/05/25 09:07:08.186799   08/05/25 09:07:08.199081   11456 usec
c1, member-1                 08/05/25 09:07:07.173993   08/05/25 09:07:07.185500   10844 usec
c1, member-1                 08/05/25 09:07:06.173766   08/05/25 09:07:06.185233   10660 usec
c1, member-1                 08/05/25 09:07:05.172557   08/05/25 09:07:05.184207   10859 usec
c1, member-1                 08/05/25 09:07:04.171997   08/05/25 09:07:04.183847   10881 usec
c1, member-1                 08/05/25 09:07:03.171955   08/05/25 09:07:03.183632   10881 usec
c1, member-1                 08/05/25 09:07:02.172077   08/05/25 09:07:02.184863   12046 usec
c1, member-1                 08/05/25 09:07:01.172105   08/05/25 09:07:01.183111   10423 usec
c1, member-1                 08/05/25 09:07:00.171912   08/05/25 09:07:00.186346   13508 usec
c1, member-1                 08/05/25 09:06:59.171972   08/05/25 09:06:59.183648   10812 usec
c1, member-1                 08/05/25 09:06:58.172043   08/05/25 09:06:58.184412   11515 usec
c1, member-1                 08/05/25 09:06:57.159416   08/05/25 09:06:57.171215   10902 usec
c1, member-1                 08/05/25 09:06:56.159593   08/05/25 09:06:56.171875   11441 usec
Meaning
The configured control and test sessions (c1 and member-1, respectively) are active on device R1. The command also produces a history of what tests have run.
Verify the MPLS Static LSP for the Forward or Return Path
Purpose
(Optional) If you have configured MPLS static LSPs and source routing for TWAMP, verify that the MPLS static LSPs for the paths are established and active. For the forward path, issue this command on the TWAMP client device (R1). For the return path, issue this command on the TWAMP server device (R2).
Action
From operational mode, for the forward path, enter the show route
table mpls.0 label 700001 detail command on device R1.
user@R1-RE0> show route table mpls.0 label 700001 detail

mpls.0: 8 destinations, 8 routes (8 active, 0 holddown, 0 hidden)
700001 (1 entry, 1 announced)
        *MPLS   Preference: 6
                Next hop type: Router, Next hop index: 8028
                Address: 0x55723341ab7c
                Next-hop reference count: 2, Next-hop session id: 1
                Kernel Table Id: 0
                Next hop: 10.1.1.2 via ae0.0 -> et-1/0/0:0 weight 0x1, selected
                Label operation: Pop
                Load balance label: None;
                Label element ptr: 0x5572353c2a28
                Label parent element ptr: (nil)
                Label element references: 1
                Label element child references: 0
                Label element lsp id: 0
                Session Id: 1
                State: <Active Int Accounting>
                Age: 25:28      Metric: 1
                Validation State: unverified
                Task: MPLS
                Announcement bits (1): 1-KRT
                AS path: I
                Label 912328704
                Stats ID Group: Kernel ID = 4098, Stats IDs = { 2684354563 }
                Thread: junos-main

700001(S=0) (1 entry, 1 announced)
        *MPLS   Preference: 6
                Next hop type: Router, Next hop index: 8029
                Address: 0x55723341ac5c
                Next-hop reference count: 2, Next-hop session id: 1
                Kernel Table Id: 0
                Next hop: 10.1.1.2 via ae0.0 -> et-1/0/0:0 weight 0x1, selected
                Label operation: Pop
                Load balance label: None;
                Label element ptr: 0x5572353c4648
                Label parent element ptr: (nil)
                Label element references: 1
                Label element child references: 0
                Label element lsp id: 0
                Session Id: 1
                State: <Active Int Accounting>
                Age: 25:28      Metric: 1
                Validation State: unverified
                Task: MPLS
                Announcement bits (1): 1-KRT
                AS path: I
                Label 912328704
                Stats ID Group: Kernel ID = 4098, Stats IDs = { 2684354563 }
                Thread: junos-main
From operational mode, for the return path, you would enter the show
route table mpls.0 label 800001 detail command on device R2.
You would see similar output to the above example, except that the next hop
is device R1.
Meaning
The static LSP for the forward path is active, and the next hop is the TWAMP server device, R2.
Configuration Commands Appendix
Set command output for both device R1 (TWAMP client) and device R2 (TWAMP server):
[edit]
user@R1-RE0# show | no-more | display set
set chassis aggregated-devices ethernet device-count 1
set services monitoring twamp client control-connection c1 control-type light
set services monitoring twamp client control-connection c1 test-interval 1
set services monitoring twamp client control-connection c1 test-session member-1 target 10.1.1.2
set services monitoring twamp client control-connection c1 test-session member-1 source-address 10.1.1.1
set services monitoring twamp client control-connection c1 test-session member-1 source-routing forward srmpls-nodes 700001
set services monitoring twamp client control-connection c1 test-session member-1 source-routing return srmpls-nodes 800001
set services monitoring twamp client control-connection c1 test-session member-1 probe-count 10
set interfaces et-1/0/0:0 ether-options 802.3ad ae0
set interfaces et-1/0/0:1 ether-options 802.3ad ae0
set interfaces ae0 unit 0 family inet address 10.1.1.1/30
set interfaces ae0 unit 0 family mpls
set protocols mpls label-range static-label-range 700000 799999
set protocols mpls interface ae0.0
set protocols mpls static-label-switched-path member-1 transit 700001 next-hop 10.1.1.2
set protocols mpls static-label-switched-path member-1 transit 700001 member-interface et-1/0/0:0
set protocols mpls static-label-switched-path member-1 transit 700001 pop
[edit]
user@R2-RE0# show | display set | no-more
set chassis aggregated-devices ethernet device-count 1
set services monitoring twamp server light
set interfaces et-1/0/0:0 ether-options 802.3ad ae0
set interfaces et-1/0/0:1 ether-options 802.3ad ae0
set interfaces ae0 unit 0 family inet address 10.1.1.2/30
set interfaces ae0 unit 0 family mpls
set protocols mpls label-range static-label-range 800000 899999
set protocols mpls interface ae0.0
set protocols mpls static-label-switched-path member-1 transit 800001 next-hop 10.1.1.1
set protocols mpls static-label-switched-path member-1 transit 800001 member-interface et-1/0/0:0
set protocols mpls static-label-switched-path member-1 transit 800001 pop
Show Commands Appendix
Verifying on device R1 (TWAMP client):
user@R1-RE0> show services monitoring twamp client test-info
Control                Test                   Client                Server                Test
name                   name                   address:port          address:port          status
c1                     member-1               10.1.1.1:39681        10.1.1.2:862          active


user@R1-RE0> show services monitoring twamp client probe-results
Owner: c1, Test: member-1
Target address: 10.1.1.2, Source address: 10.1.1.1, Probe type: twamp, Test size: 10
  Probe results:
    Probe response received
    Probe sent time: 08/05/25 07:18:15.528555
    Probe rcvd time: 08/05/25 07:18:15.540105, Client and server offload timestamping
    Rtt: 11310 usec, Rtt jitter: 0 usec
    Egress jitter: 0 usec, Ingress jitter: 0 usec
  Results over current test:
    Probes sent: 1, Probes received: 1, Loss percentage: 0.00
    Measurement: Round trip time (usec)
      Samples: 1, Minimum: 11310, Maximum: 11310, Average: 11310, Stddev: 0
    Measurement: Egress delay (usec)
      Samples: 1, Minimum: 5798, Maximum: 5798, Average: 5798, Stddev: 0
    Measurement: Ingress delay (usec)
      Samples: 1, Minimum: 5512, Maximum: 5512, Average: 5512, Stddev: 0
  Results over last test:
    Probes sent: 10, Probes received: 10, Loss percentage: 0.00
    Measurement: Round trip time (usec)
      Samples: 10, Minimum: 11034, Maximum: 12762, Average: 11582, Stddev: 569
    Measurement: Round trip jitter (usec)
      Samples: 9, Minimum: 6, Maximum: 1728, Average: 779, Stddev: 674
    Measurement: Egress delay (usec)
      Samples: 10, Minimum: 5800, Maximum: 7323, Average: 6167, Stddev: 475
    Measurement: Egress jitter (usec)
      Samples: 9, Minimum: 73, Maximum: 1456, Average: 636, Stddev: 522
    Measurement: Ingress delay (usec)
      Samples: 10, Minimum: 5167, Maximum: 5756, Average: 5415, Stddev: 159
    Measurement: Ingress jitter (usec)
      Samples: 9, Minimum: 32, Maximum: 589, Average: 226, Stddev: 183
  Results over all tests:
    Probes sent: 322391, Probes received: 322391, Loss percentage: 0.00
    Measurement: Round trip time (usec)
      Samples: 322391, Minimum: 9590, Maximum: 86924, Average: 11732, Stddev: 839
    Measurement: Round trip jitter (usec)
      Samples: 322390, Minimum: 0, Maximum: 75497, Average: 714, Stddev: 872
    Measurement: Egress delay (usec)
      Samples: 321549, Minimum: 4505, Maximum: 80734, Average: 6399, Stddev: 1024
    Measurement: Egress jitter (usec)
      Samples: 322390, Minimum: 0, Maximum: 75004, Average: 497, Stddev: 643
    Measurement: Ingress delay (usec)
      Samples: 321549, Minimum: 1, Maximum: 34051, Average: 5334, Stddev: 927
    Measurement: Ingress jitter (usec)
      Samples: 322390, Minimum: 0, Maximum: 28341, Average: 299, Stddev: 511

user@R1-RE0> show services monitoring twamp client history-results brief control-connection c1
Owner, Test                  Probe sent                 Probe received             Round trip time
c1, member-1                 08/05/25 07:18:39.563872   08/05/25 07:18:39.575713   11576 usec
c1, member-1                 08/05/25 07:18:38.563778   08/05/25 07:18:38.575398   11378 usec
c1, member-1                 08/05/25 07:18:37.563729   08/05/25 07:18:37.576173   12193 usec
c1, member-1                 08/05/25 07:18:36.564407   08/05/25 07:18:36.575987   11341 usec
c1, member-1                 08/05/25 07:18:35.564391   08/05/25 07:18:35.575946   11303 usec
c1, member-1                 08/05/25 07:18:34.552123   08/05/25 07:18:34.563284   10916 usec
c1, member-1                 08/05/25 07:18:33.552361   08/05/25 07:18:33.563889   11327 usec
c1, member-1                 08/05/25 07:18:32.551670   08/05/25 07:18:32.563409   11573 usec
c1, member-1                 08/05/25 07:18:31.550787   08/05/25 07:18:31.563868   12944 usec
c1, member-1                 08/05/25 07:18:30.550536   08/05/25 07:18:30.562029   11190 usec
c1, member-1                 08/05/25 07:18:29.549721   08/05/25 07:18:29.561502   11576 usec
c1, member-1                 08/05/25 07:18:28.548392   08/05/25 07:18:28.560735   12096 usec
c1, member-1                 08/05/25 07:18:27.547860   08/05/25 07:18:27.559780   11413 usec
c1, member-1                 08/05/25 07:18:26.547545   08/05/25 07:18:26.559946   12115 usec
c1, member-1                 08/05/25 07:18:25.547329   08/05/25 07:18:25.558985   11342 usec
c1, member-1                 08/05/25 07:18:24.532568   08/05/25 07:18:24.545064   12058 usec
c1, member-1                 08/05/25 07:18:23.532310   08/05/25 07:18:23.544175   11563 usec
c1, member-1                 08/05/25 07:18:22.532162   08/05/25 07:18:22.543797   11388 usec
c1, member-1                 08/05/25 07:18:21.532432   08/05/25 07:18:21.543711   11048 usec
c1, member-1                 08/05/25 07:18:20.531904   08/05/25 07:18:20.543920   11776 usec
c1, member-1                 08/05/25 07:18:19.531585   08/05/25 07:18:19.543593   11691 usec
c1, member-1                 08/05/25 07:18:18.531048   08/05/25 07:18:18.543315   11924 usec
c1, member-1                 08/05/25 07:18:17.530596   08/05/25 07:18:17.542382   11562 usec
c1, member-1                 08/05/25 07:18:16.528830   08/05/25 07:18:16.540085   10992 usec
c1, member-1                 08/05/25 07:18:15.528555   08/05/25 07:18:15.540105   11310 usec
c1, member-1                 08/05/25 07:18:14.515302   08/05/25 07:18:14.526860   11367 usec
c1, member-1                 08/05/25 07:18:13.514902   08/05/25 07:18:13.526486   11361 usec
c1, member-1                 08/05/25 07:18:12.514510   08/05/25 07:18:12.526362   11666 usec
c1, member-1                 08/05/25 07:18:11.512921   08/05/25 07:18:11.524554   11476 usec
c1, member-1                 08/05/25 07:18:10.511708   08/05/25 07:18:10.523276   11312 usec
c1, member-1                 08/05/25 07:18:09.511533   08/05/25 07:18:09.524527   12762 usec
c1, member-1                 08/05/25 07:18:08.511198   08/05/25 07:18:08.522518   11034 usec
c1, member-1                 08/05/25 07:18:07.510583   08/05/25 07:18:07.523400   12498 usec
c1, member-1                 08/05/25 07:18:06.510579   08/05/25 07:18:06.521849   11047 usec
c1, member-1                 08/05/25 07:18:05.509754   08/05/25 07:18:05.521301   11304 usec
c1, member-1                 08/05/25 07:18:04.497345   08/05/25 07:18:04.508855   11233 usec
c1, member-1                 08/05/25 07:18:03.497203   08/05/25 07:18:03.508512   11069 usec
c1, member-1                 08/05/25 07:18:02.497402   08/05/25 07:18:02.510709   13135 usec
c1, member-1                 08/05/25 07:18:01.497144   08/05/25 07:18:01.508245   10722 usec
c1, member-1                 08/05/25 07:18:00.497367   08/05/25 07:18:00.509596   11945 usec
c1, member-1                 08/05/25 07:17:59.496917   08/05/25 07:17:59.508461   11344 usec
c1, member-1                 08/05/25 07:17:58.495818   08/05/25 07:17:58.507581   11465 usec
c1, member-1                 08/05/25 07:17:57.494720   08/05/25 07:17:57.506627   11639 usec
c1, member-1                 08/05/25 07:17:56.494643   08/05/25 07:17:56.506367   11370 usec
c1, member-1                 08/05/25 07:17:55.493962   08/05/25 07:17:55.505208   10975 usec
c1, member-1                 08/05/25 07:17:54.480395   08/05/25 07:17:54.491640   10939 usec
c1, member-1                 08/05/25 07:17:53.480338   08/05/25 07:17:53.491912   11302 usec
c1, member-1                 08/05/25 07:17:52.479867   08/05/25 07:17:52.491764   11120 usec
c1, member-1                 08/05/25 07:17:51.478918   08/05/25 07:17:51.490479   11336 usec
c1, member-1                 08/05/25 07:17:50.479401   08/05/25 07:17:50.491294   11604 usec

user@host-RE0> show route table mpls.0 label 700001 detail     # if you configured MPLS to choose an LSP

mpls.0: 8 destinations, 8 routes (8 active, 0 holddown, 0 hidden)
700001 (1 entry, 1 announced)
        *MPLS   Preference: 6
                Next hop type: Router, Next hop index: 8028
                Address: 0x55723341ab7c
                Next-hop reference count: 2, Next-hop session id: 1
                Kernel Table Id: 0
                Next hop: 10.1.1.2 via ae0.0 -> et-1/0/0:0 weight 0x1, selected
                Label operation: Pop
                Load balance label: None;
                Label element ptr: 0x5572353c2a28
                Label parent element ptr: (nil)
                Label element references: 1
                Label element child references: 0
                Label element lsp id: 0
                Session Id: 1
                State: <Active Int Accounting>
                Age: 25:28      Metric: 1
                Validation State: unverified
                Task: MPLS
                Announcement bits (1): 1-KRT
                AS path: I
                Label 912328704
                Stats ID Group: Kernel ID = 4098, Stats IDs = { 2684354563 }
                Thread: junos-main

700001(S=0) (1 entry, 1 announced)
        *MPLS   Preference: 6
                Next hop type: Router, Next hop index: 8029
                Address: 0x55723341ac5c
                Next-hop reference count: 2, Next-hop session id: 1
                Kernel Table Id: 0
                Next hop: 10.1.1.2 via ae0.0 -> et-1/0/0:0 weight 0x1, selected
                Label operation: Pop
                Load balance label: None;
                Label element ptr: 0x5572353c4648
                Label parent element ptr: (nil)
                Label element references: 1
                Label element child references: 0
                Label element lsp id: 0
                Session Id: 1
                State: <Active Int Accounting>
                Age: 25:28      Metric: 1
                Validation State: unverified
                Task: MPLS
                Announcement bits (1): 1-KRT
                AS path: I
                Label 912328704
                Stats ID Group: Kernel ID = 4098, Stats IDs = { 2684354563 }
                Thread: junos-main
Verifying on device R2 (TWAMP server):
user@R2-RE0> show services monitoring twamp server test-info
Control                Test                   Client                Server                Test
identifier             identifier             address:port          address:port          status
1                      34                     10.1.1.1:45183        10.1.1.2:10000        active

user@R2-RE0> show route table mpls.0 label 800001 detail  # if you configured MPLS to choose an LSP
...[output truncated]...
800001 (1 entry, 1 announced)
        *MPLS   Preference: 6
                ... [output truncated]...
                Next hop: 10.0.1.1 via ae0.0 -> et-1/0/0:0 weight 0x1, selected
                Label operation: Pop
                ... [output truncated]...