ON THIS PAGE
Working with Topology
On the Topology page in the Network Monitoring workspace, you can view nodes and node links, information about nodes and node status, and perform actions on nodes.
On the Topology page, the term node refers to Junos Space nodes, FMPM nodes, or devices discovered by Junos Space Network Management Platform. The term node link refers to the link between the nodes.
Clicking a node or a node link highlights the node or node link. You can view the management IP address, name, and status for any node in the topology by hovering over the node, and the type of link, the name, the link bandwidth, and the endpoints by hovering over a node link. When you select a node or node link on the topology, the node or node link is highlighted. You can select multiple nodes by holding down the Ctrl key and selecting the nodes. You can use the zoom slider to zoom in and zoom out of the selected topology view. You can also use the semantic zoom-level functionality on the topology to display nodes one or more hops away from the selected nodes.
This topic contains the following sections:
Using the Search Option to View Nodes
You can use the Search option to search for and add nodes that you want to view in the topology. By default, no nodes are displayed in the topology and a warning message is displayed explaining how to add nodes to the topology.
Do one or more of the following:
Enter Nodes in the Search field to select nodes from the list of all available nodes in the network topology.
Enter Category in the Search field to select nodes by device category (Routers, Switches, Security Devices, and so forth).
Note:Categories can be collapsed and expanded.
To display all nodes in the topology, select the Monitor_SNMP category.
Enter the name of a specific device in the Search field to display a specific device.
Working with Topology Views
You can use the GUI controls, shown in Figure 1 and described in Table 1 to control the display of the nodes on the Topology page.
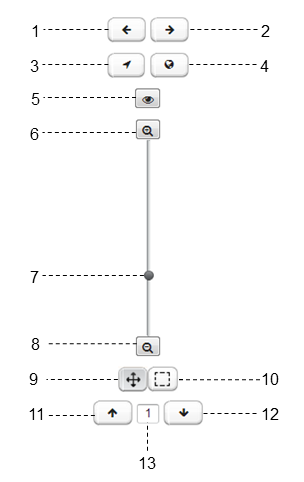
1 — Click to go back button | 8 — Zoom slider |
2 — Click to go forward button | 9 — Pan button |
3 — Center on selection button | 10 — Selection button |
4 — Show entire map button | 11 — Expand semantic zoom button |
5 — Toggle highlight focus nodes button | 12 — Collapse semantic zoom button |
6 — Zoom in button | 13 — Number of connected hops from the node in focus |
7 — Zoom out button |
| Option | Description |
Click to go back button |
View the previous topology view history. |
Click to go forward button |
View the more recent topology view history, after viewing the past history. |
Center on selection button |
Display the selected nodes in the center of the topology view. |
Show entire map button |
Display all the (filtered) nodes in the topology view. |
Toggle highlight focus nodes button |
When you add a node to focus, nodes connected to the focus node might also be displayed. When you click the Toggle highlight focus nodes button, only focus node icons are highlighted, and icons are dimmed for non-focus nodes that are connected to the focus nodes. |
Zoom in button |
Click to zoom in to the topology |
Zoom slider |
Move the slider up to zoom in or down to zoom out. |
Zoom out button |
Click to zoom out to the topology |
Pan Tool button |
Select on a node to reposition in topology view, or select between nodes (in white space) to pan all nodes in the topology view (up, down, left, or right) as a single image. To disable the Pan Tool function, click the Selection Tool button. |
Selection Tool button |
Perform operations on individual nodes (add node to focus, ping node, view node information, view events/alarms, and so forth). To disable the Selection Tool function, click the Pan Tool button. |
Expand Semantic Zoom Level/Collapse Semantic Zoom Level |
Expand or collapse the semantic zoom level by using the Up arrow key to increase the hop count or the Down arrow key to decrease the hop count. For example, select a hop count of 2 to display the network nodes two hops away from the focus nodes. Note:
The topology view displays a line to show connections to nodes that are one or more hops away from a focus node. |
Viewing the Events and Alarms Associated with a Node
In the Topology page, you can view the events and alarms associated with a node.
Do the following
Viewing Alarms and Node Details
To view details for a category of nodes or selected nodes:
Viewing Nodes with Active Alarms
To view nodes with active alarms:
Managing Alarms Associated with Nodes
To acknowledge, unacknowledge, escalate, or clear the alarms associated with a node:
- Select Network Monitoring > Topology.
- From the topology page, select the nodes for which you want to manage alarms.
- Select the Alarms tab.
- Select the check box to the left of the alarm ID for each alarm listing you want to manage, or click Select All to manage all the listed alarms.
- Select the action (Acknowledge, Unacknowledge, Escalate, or Clear) that you want to perform on the selected alarms.
- Select Submit to complete the action.
Viewing the Topology with Different Layouts
To view the topology with different layouts:
Automatic Refresh of the Topology
By default, the topology is not automatically refreshed.
To initiate an automatic refresh of the topology:
The View menu is closed and you are taken back to the Topology page. The topology is automatically refreshed every 60 seconds.
If there are changes to the status of nodes, node links, and logical entities, these changes are displayed in the topology automatically.
Viewing the Status of Node Links
By default, the topology does not display the status of the node links.
To display the status of the node links in the topology:
The View menu is closed and you are taken back to the Topology page. The topology now displays the status of the node links:
Green indicates that the link is up.
Red indicates that the link is down.
If the Link Status check box is not selected, then the links are displayed in gray.
Viewing the Alarm State of Services Links
By default, the topology does not display the current alarm state of the services links within the topology.
To display the alarm state of the services links in the topology:
The View menu is closed and you are taken back to the Topology page. The topology now displays the alarm state of the services links:
Green indicates that the services link is up and that no service-impacted alarm was found.
Red indicates that the service status is down and that a service-impacted alarm is found for that service.
If the Link Status check box is not selected, then the links are displayed in gray.
If the NCS Link Status check box is cleared, then the link color is not changed automatically (dynamically) on the Topology page. If the NCS Link Status check box is selected, the color of the link changes automatically and dynamically based on the related alarms.
When you mouse over a link, a tooltip displays the service information including the service status.
Pinging a Node
To ping a node:
Viewing the Resource Graphs Associated with the Node
On the Topology page, you can view the resource graphs associated with a node.
Do the following:
Connecting to a Device by Using SSH
On the Topology page (Network Monitoring > Topology), you can connect to one or more devices using SSH. You can also connect to the same device one or more times; a new SSH window is created for each connection.
The following is applicable irrespective of the type of authentication configured (credential-based or key-based) in Junos Space Platform:
If the option to allow users to automatically log in is configured, then users can automatically log in without providing a username and password. (You can configure the option to allow users to automatically log in to devices on the Device page (Administration > Applications > Modify Application Settings > Device). For more information, see the Modifying Junos Space Network Management Platform Settings topic.)
If the option to allow users to automatically log in is not configured, then, you are prompted to enter a username and password.
When you connect to a device by using SSH, Junos Space Platform validates the device fingerprint against the fingerprint stored in the database. If the fingerprints are the same, then Junos Space Platform allows you to connect to the device. If the fingerprints are not the same, then the behavior depends on the state of the Manually Resolve Fingerprint Conflict check box on the Modify Application Settings (Modify Network Management Platform Settings) page in the Administration workspace (Administration > Applications > Network Management Platform > Modify Application Setting).
If the check box is selected, an error message is displayed indicating that there is a device fingerprint mismatch and the connection is dropped. The conflicted fingerprint value is updated in the database and the device’s authentication status is marked Fingerprint Conflict. You must resolve the fingerprint conflict manually in order to connect to the device by using SSH. For more information, see Acknowledging SSH Fingerprints from Devices.
If the check box is cleared, Junos Space Platform updates the new fingerprint in the database and allows a connection to the device; the device’s authentication status is changed to Credential Based – Unverified or Key Based – Unverified.
To connect to a device by using SSH:
If you do not disconnect the session, the session is automatically disconnected by Junos Space in the following cases:
When the user logs out
When the user is logged out due to inactivity
When the authentication is changed to certificate mode
When the user is disabled or deleted
When the user’s session is terminated