
Detect Anomalies for Device Hardware, Interface, and Protocol KPIs
Use this topic to understand how Routing Director monitors key performance indicators (KPIs) fpr device hardware, interfaces, and protocols and detects anomalies, and how you can use the GUI to view anomalies related the KPIs.
Detect Anomalies Overview
To assess the overall health of a network, you must monitor the health of devices, their interfaces, and the operation of network protocols. Routing Director uses artificial intelligence and machine learning (AI-ML) to continuously monitor KPIs related to device hardware, interface health, and protocol performance. Using AI-ML, Routing Director learns about the dynamic behavior of the KPIs, identifies changes in threshold patterns, and generates alerts when anomalies are detected.
In addition, Routing Director performs root-cause analysis (RCA) for device temperature anomalies that occur during device operation, helping you to quickly identify and address underlying issues.
After a device is onboarded successfully, Routing Director monitors the KPI, forecasts the range, and detects any anomalies that occur. During device operation, Routing Director detects device health anomalies (within 30 minutes) based on historical data for that device and the forecasted range. After a KPI value changes, the forecasted range takes approximately three hours to adapt and stabilize, after which anomaly detection continues based on the updated forecasted range.
To detect anomalies based on the dynamic thresholds for KPIs:
-
AI-ML must be enabled in the Routing Director cluster.
set deployment cluster applications aiops install-aiml true
See Deploy the Cluster for details.
-
Dynamic Threshold must be enabled in the device profile assigned to the device. See Table 8.
Note:Enabling AI-ML operations require additional CPU, memory, and storage resources. For detailed information on the required capacity for AI-ML use cases, see Hardware Requirements.
When you upgrade to Routing Director 2.9.0 from an older release, Dynamic Threshold is disabled even if it is enabled in the older release. To view dynamic thresholds for KPIs, ensure to enable Dynamic Threshold in the device profile, after the upgrade. See Table 8
Detecting anomalies based on dynamic threshold of KPIs is supported on the following device families—ACX, MX, and PTX.
RCA of Temperature Anomalies
When a device is in operation, Routing Director provides RCA for issues related to the Routing Engine temperature and Routing Engine CPU temperature. Routing Director analyzes the different attributes (CPU utilization percentage, fan RPM percentage, and inlet temperature) that could cause a temperature issue. Routing Director also compares the device's temperature to an expected range. Based on the analysis and comparison, Routing Director provides an alert, an expected reason for the issue, and details on the events that might have caused the issue. Figure 1 displays a sample page showing the RCA logs for an anomaly in the Routing Engine temperature.
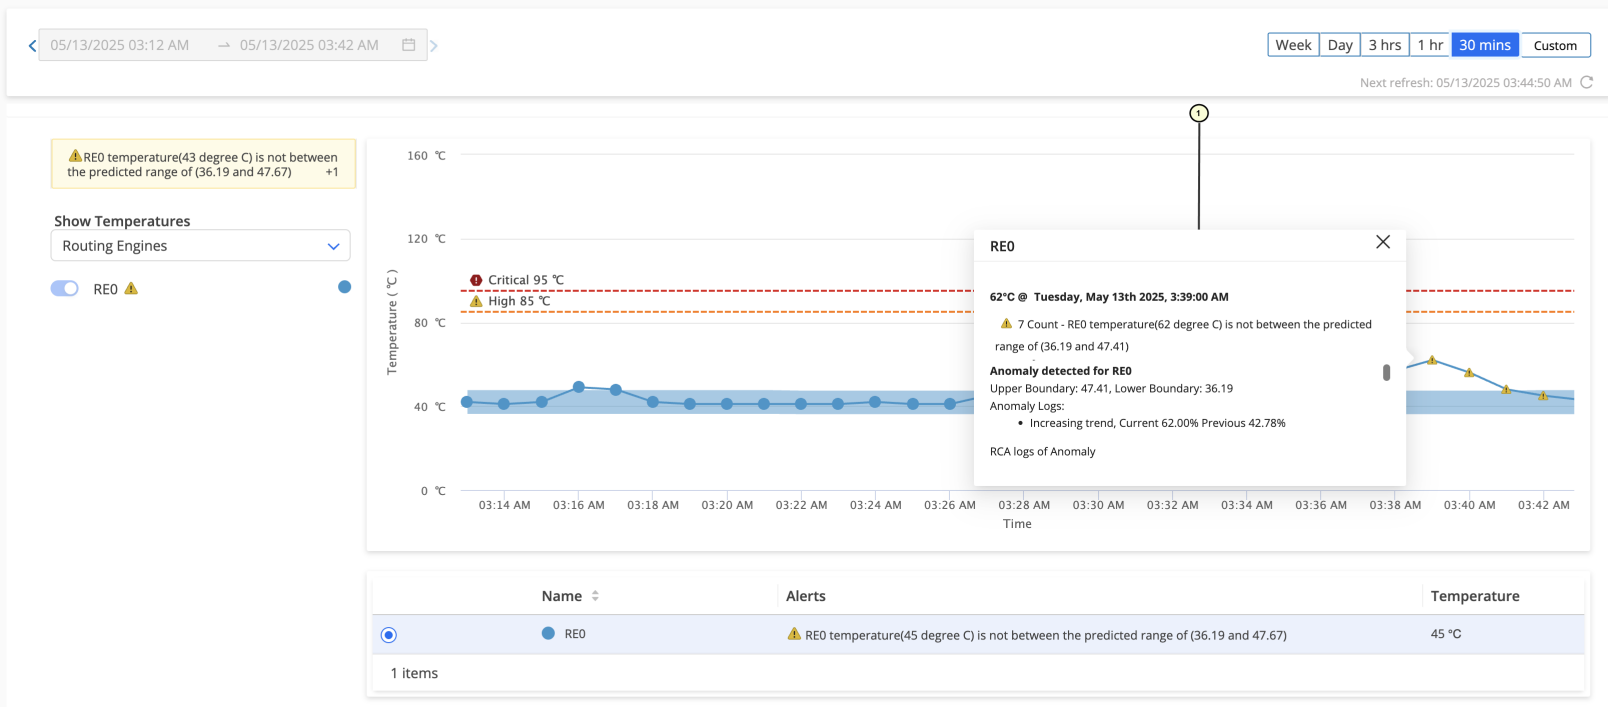
1 — Device Temperature RCA Details |
Device Hardware, Interface, and Protocol KPIs
Table 1 displays the device health KPIs that Routing Director monitors for each device.
| KPI | Component | Parameters |
|---|---|---|
| CPU |
Routing Engine Line card |
CPU Utilization Percentage (%) |
| Memory |
Routing Engine Line card |
Memory Utilization Percentage (%) |
| Fan | Not applicable |
RPM Percentage (%) |
| Temperature |
|
Current temperature |
| Power supply unit (PSU) | Power | Power usage percentage (%) of the PSU. |
For more information on the device hardware KPIs, see Hardware Data and Test Results.
Table 2 lists the KPIs related to interface health that Routing Director monitors for each interface.
| KPI | Description |
|---|---|
|
Optics Rx power Optics Tx power |
Current optics power level in dBm. |
|
Input traffic Output traffic |
Current traffic in Mbps. |
|
Optical/Module temperature |
Current optics temperature in ℃. |
For more information on interface KPIs, see Interfaces Data and Test Results.
Table 3 lists the KPIs related to protocol performance detected using AI-ML.
| KPI | Parameters |
|---|---|
| BGP |
|
| RIB |
Route count You can view dynamic threshold for route count. |
| FIB |
Route count You can view dynamic threshold for route count. |
For more information on Protocol KPIs, see Routing and MPLS Data and Test Results.
View Device Hardware, Interface, and Protocol KPI Anomalies on the GUI
You can view and monitor the device hardware, interface, and protocol KPI anomalies for a device respectively on the Hardware accordion, Interface accordion, and the Routing and MPLS accordion of the Device-Name page.
To view and monitor device hardware, interface, and protocol KPI anomalies:
For more information on the hardware accordion, see Hardware Data and Test Results and on interface accordion, see Interfaces Data and Test Results.
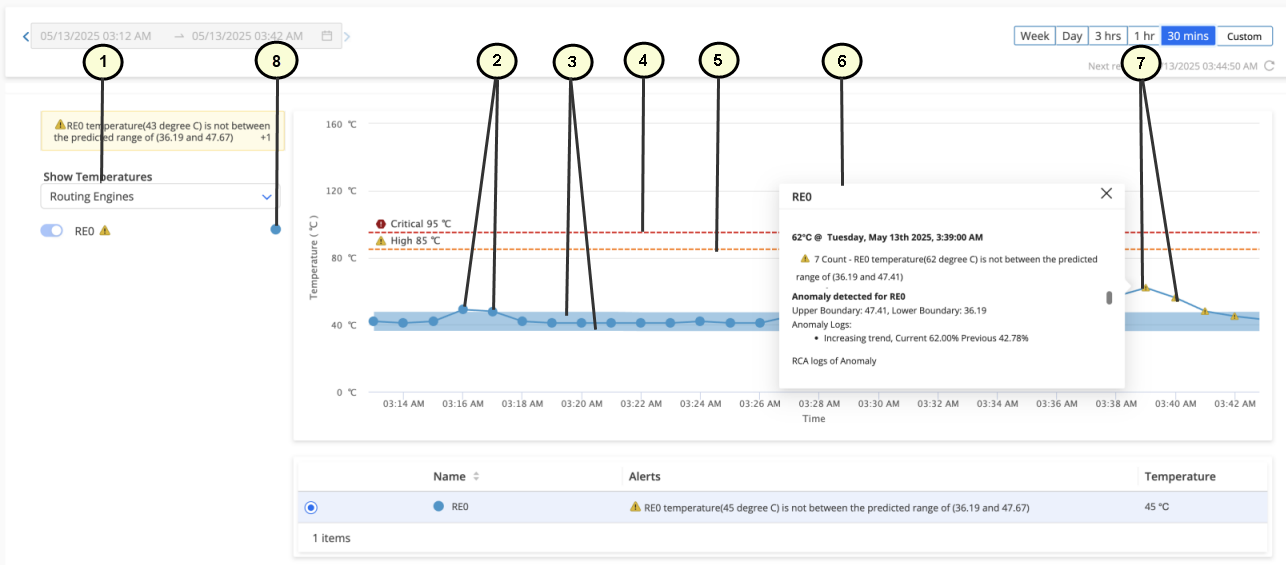
1 — KPI | 5 — High threshold marker |
2 — Circle icons indicating that the KPI is normal | 6 — Pop-up showing details of device health anomaly. |
3 — Upper and lower boundaries (dynamic thresholds) for the data displayed in the graph | 7 — Triangle icons indicating an anomaly when the dynamic threshold is breached. |
4 — Critical threshold marker | 8 — Legend showing the colors for different sub-components used in the graphs |
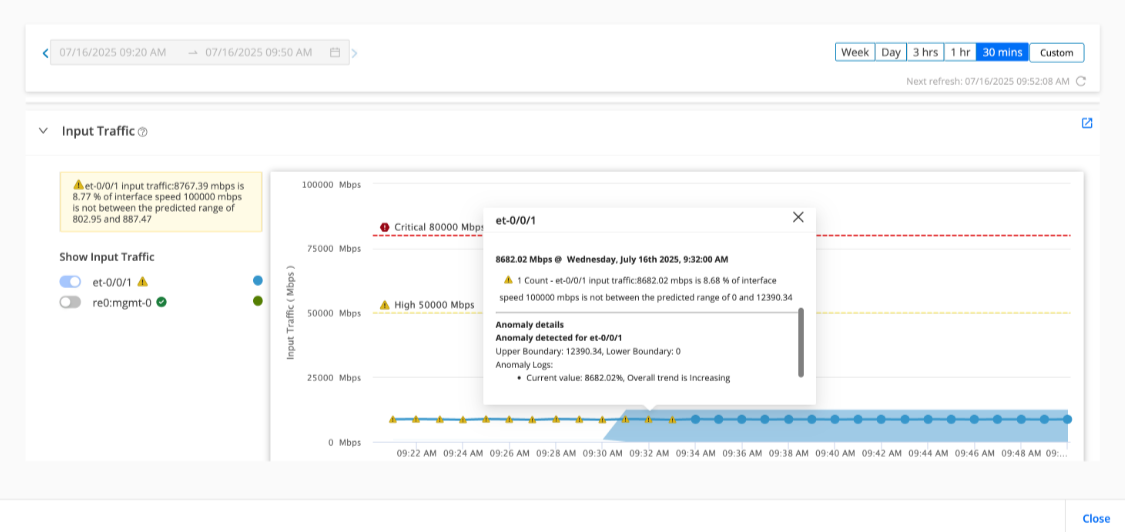
Figure shows the input traffic through et-0/0/1 interface on a device during a 30 minute interval. A warning (indicated by the yellow triangle icon) is raised to indicate an anomaly in the projected input traffic rate,
A KPI value is considered:
-
Anomalous if the KPI value is outside the dynamic threshold (shaded area of the map) for nine continuous minutes of data collection.
-
Normal if the KPI value falls within the dynamic threshold for six continuous minutes of data collection.
If the KPI value continues to be outside the dynamic threshold for more than nine consecutive minutes, the dynamic threshold adapts to the new values and a new dynamic threshold is created. An alert is raised if the KPI value crosses the High or Critical values irrespective of whether the value falls within the dynamic threshold or not.
For an oscillating KPI pattern, the dynamic threshold boundaries initially adapts correctly to KPI, but the boundaries begin to re-adjust and oscillate after a few hours, even when the KPI pattern remains unchanged, triggering false-positive alerts.