
About the Link Tab (Network Optimization)
To access the Link tab, click Network Optimization > Network > Network Optimization Intent.
On this tab, you can view information about the links in the network. Table 1 provides information about the fields in the Link tab.
To perform common actions such as filtering using advanced filter criteria, downloading link details, and resetting preferences, see Network Table Overview.
Tasks You Can Perform
-
From the More list, you can perform the following tasks:
Note:You can also right-click a link to view the same options.
-
View details about a link—To view the details tab:
-
Hover over a link row in the table and click the Details icon. The Link - Device A to Device Z appears. On the Link - Device A to Device Z page that appears, you can view the Details tab.
-
Select the link on the table and click More > Show Detail. On the Link - Device A to Device Z page that appears, you can view the Details tab.
On the Details tab, you can view the link ID, link index, live status, operational status, and properties of ingress device (Node A) and egress device (Node Z) in detail. See Table 1
The Link - Device A to Device Z page is movable so, you can pin it anywhere on the screen.
-
-
Filter links on the topology map—To display only the selected link in the topology map, select Filter Selected Link. To undo the filter, right click a blank space on the topology map and click Reload Network.
-
Zoom in on a link—To zoom in on a link in the topology map, select the link and click Zoom to Selected Link. The topology map is enlarged to zoom in on the selected link.
-
Configure table settings—Select Table Settings to change the display format of utilization values (Decimal or Percentage) in the table.
-
-
Download link-related information—Click Download to download detailed information about all the existing links in the topology in CSV format.
-
View historical data—Routing Director enables you can view the historical data. Historical data provides you valuable insights into past trends and patterns.
Note:For Routing Director to collect historical data, you need to do the following:
You need to enable the collection of statistics.
To collect historical data for interface traffic, you need to enable traffic engineering while creating a device profile. For more information, see Add a Device Profile.
To collect historical data for interface delay, you need to enable link delay measurements. For more information, see https://www.juniper.net/documentation/us/en/software/junos/is-is/topics/topic-map/enable-link-delay-advertise-in-is-is.html and https://www.juniper.net/documentation/us/en/software/junos/ospf/topics/topic-map/enable-link-delay-advertise-in-ospf.html.
To collect historical data for packet loss, you need to enable active assurance and packet loss while creating a device profile. For more information, see Add a Device Profile. You also need to enable packet loss in the Organization Settings page. For more information, see Manage Organization Settings.
Enable dynamic topology so that you can view real-time changes in your network. For more information, see Dynamic Topology Workflow.
You can view the historical data for the following:
-
Interface Traffic—View a graphical representation of the link traffic (in bps) for interface A and Z based on the time range selected from the Period list. A Link Traffic pop-up appears, which you can pin anywhere on the screen using the pin icon. From the Period list, you can select an option to view the traffic data for Previous 3 Hours, 1 day, 1 Week, or Custom time ranges.
You can choose to auto refresh the data or manually refresh the data.
Figure 1: Sample Link Traffic Graph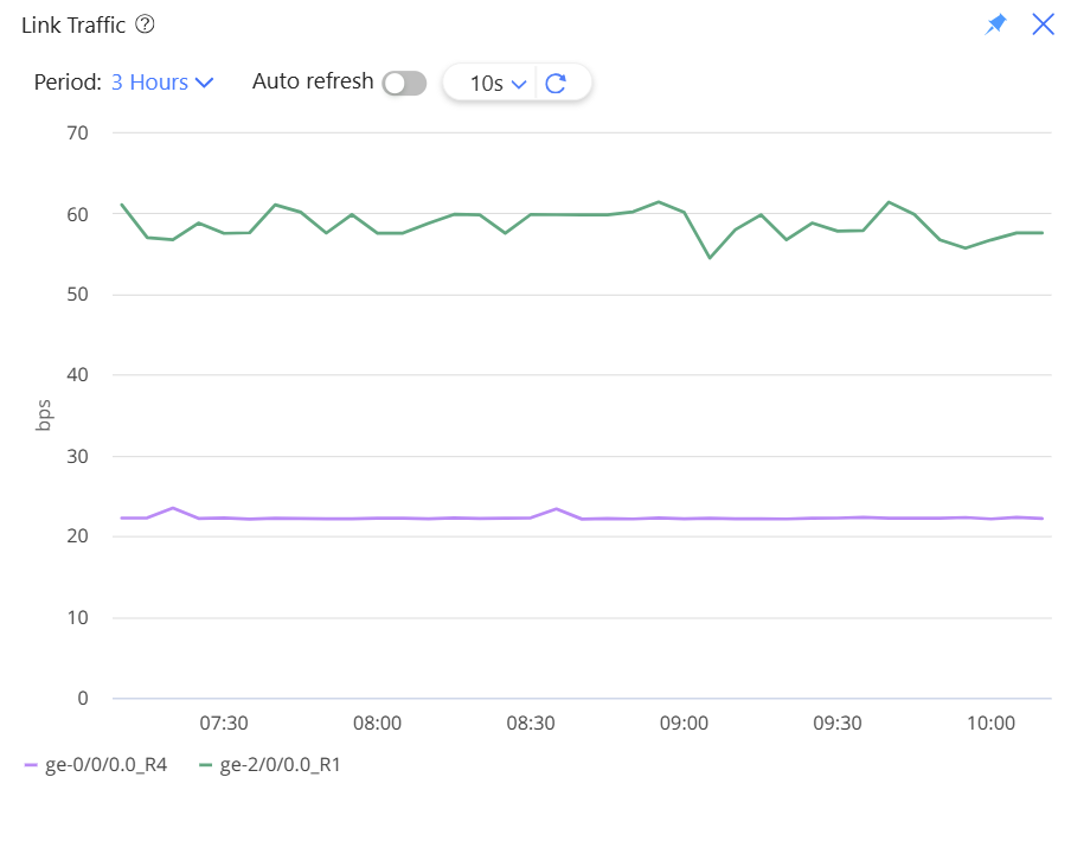
-
Interface delay—View a graphical representation of the link delay (in milliseconds) for interface A and Z based on the time range selected from the Period list. A Link Delay pop-up appears, which you can pin anywhere on the screen using the pin icon. From the Period list, you can select an option to view the delay data for Previous 3 Hours, 1 day, 1 Week, or Custom time ranges.
You can choose to auto refresh the data or manually refresh the data.
Figure 2: Sample Link Delay Graph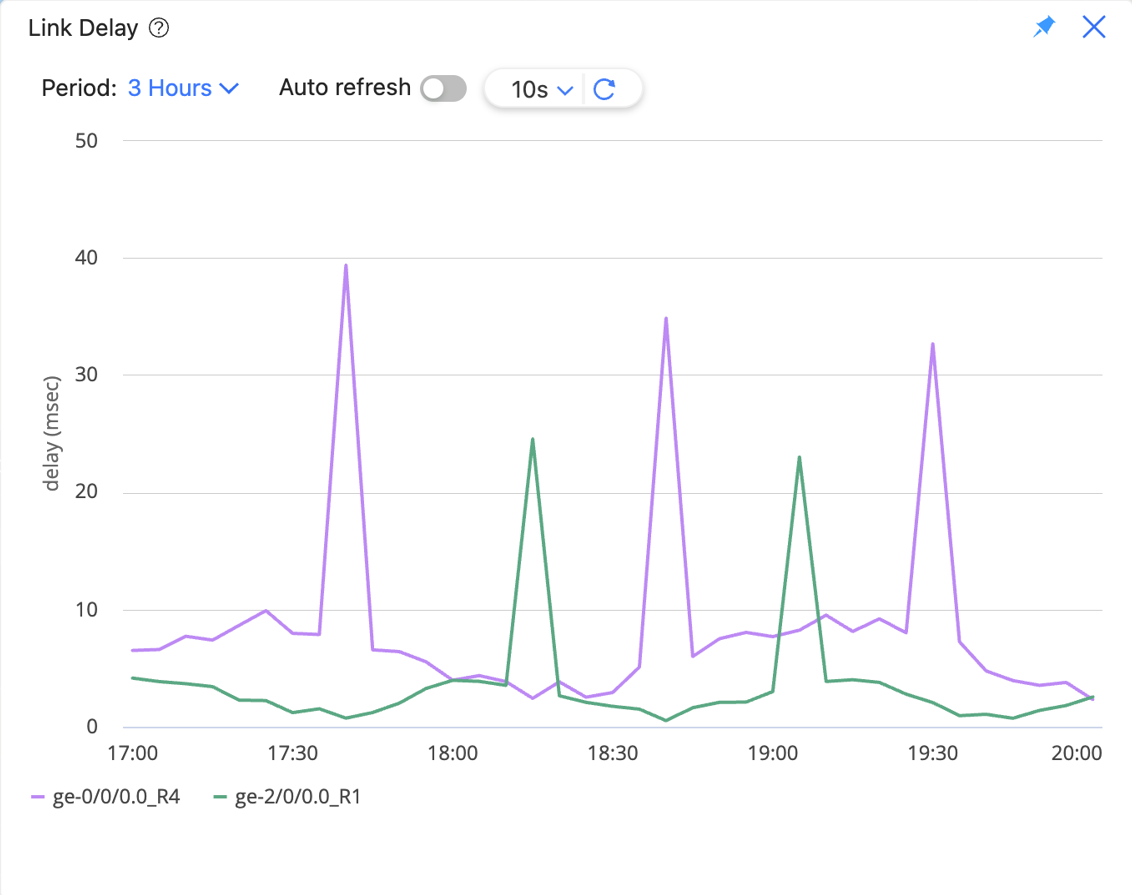
-
Packet loss—View a graphical representation of the packet loss (in percentage) on the link from interface A to interface Z based on the time range selected from the Period list. A Packet Loss pop-up appears, which you can pin anywhere on the screen using the pin icon. From the Period list, you can select an option to view the delay data for Previous 3 Hours, 1 day, 1 Week, or Custom time ranges.
You can choose to auto refresh the data or manually refresh the data.
Figure 3: Sample Link Packet Loss Graph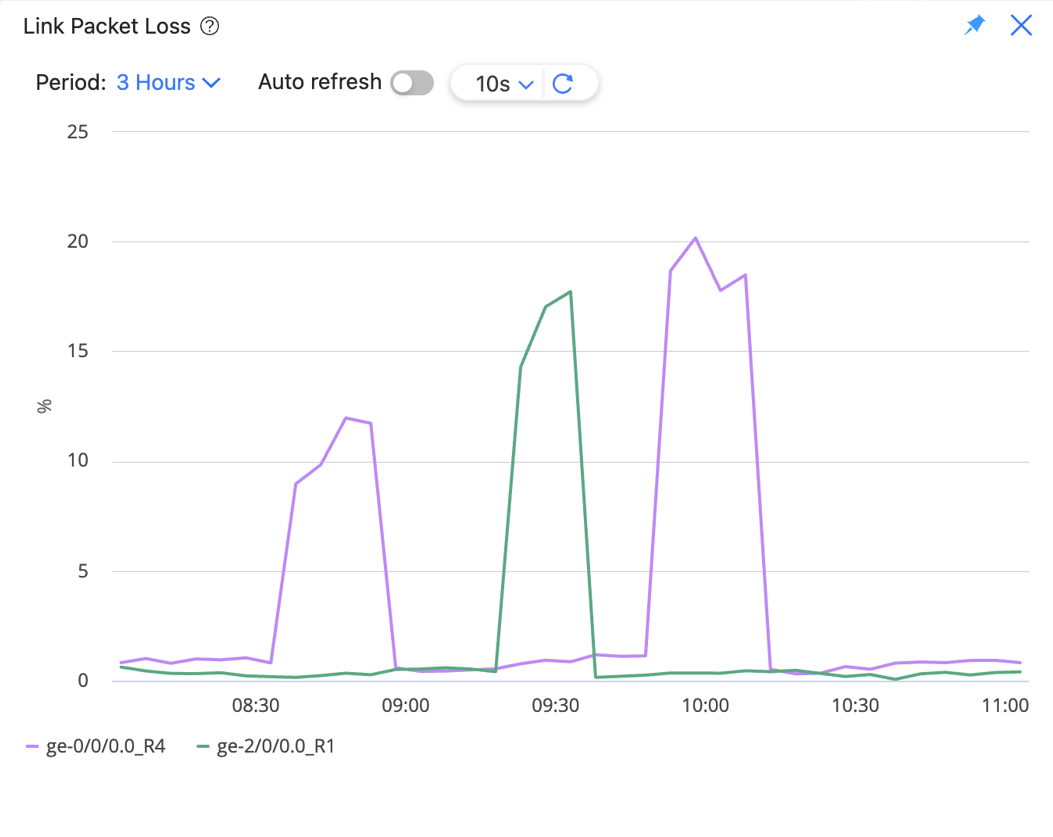
| Fields | Description |
|---|---|
| Device A | Displays the device at which traffic enters. |
| Device Z | Displays the device at which traffic exits. |
| Status | Displays the status of the link. |
| IP A | Displays the IPv4 address of the interface from which device A
sends traffic. Routing Director displays the IPv4 address of IP A based on device A's active configuration. If the IPv4 addresses of IP A and IP Z are in the same subnet, Routing Director forms an interface between devices A and Z. |
| IP Z | Displays the IPv4 address of device Z interface that receives
traffic. Routing Director displays the IPv4 address of IP Z based on device Z's active configuration. If the IPv4 addresses of IP A and IP Z are in the same subnet, Routing Director forms an interface between devices A and Z. |
| Interface A | Displays the interface name of device A. |
| Interface Z | Displays the interface name of device Z. |
| Bandwidth A | Displays the bandwidth (in bps) of the ingress device. |
| Bandwidth Z | Displays the bandwidth (in bps) of the egress device. |
| TE Metric A | Displays the traffic engineering-related metrics for the device A. |
| TE Metric Z | Displays the traffic engineering-related metrics for the device B. |
| Admin Group AZ | Displays the admin group selected for the traffic to traverse between device A and device Z. |
| Admin Group ZA | Displays the admin group selected for the traffic to traverse between device Z and device A. |
| Live Interface Utilization AZ | Displays the ratio of the actual measured traffic traversing the link from device A to device Z to the total bandwidth of device A's interface. |
| Live Interface Utilization ZA | Displays the ratio of the actual measured traffic traversing the link from device Z to device A to the total bandwidth of device Z's interface. |
| RSVP BW AZ | Displays the RSVP bandwidth between device A and device Z. |
| RSVP BW ZA | Displays the RSVP bandwidth between device Z and device A. |
| RSVP Utilization AZ | Displays the RSVP utilization between device A and device Z. |
| RSVP Utilization ZA | Displays the RSVP utilization between device Z and device A. |
| Computed Tunnel Utilization AZ | Displays the ratio of the sum of planned bandwidth of all TE tunnels traversing the link from A to Z to the RSVP bandwidth of device A's interface. |
| Computed Tunnel Utilization ZA | Displays the ratio of the sum of planned bandwidth of all TE tunnels traversing the link from Z to A to the RSVP bandwidth of device Z's interface. |
| Measured Delay AZ | Displays the delay metrics between device A and device Z. |
| Measured Delay ZA | Displays the delay metrics between device Z and device A. |
| SRLG | Displays information about shared risk link group (SRLG). |
| SID A | Displays the SID label for the ingress device. |
| SID Z | Displays the SID label for the egress device. |
| ISIS1 AZ | Displays the IS-IS area level (L1) metric between device A and device Z. |
| ISIS1 ZA | Displays the IS-IS area level (L1) metric between device Z and device A. |
| ISIS2 AZ | Displays the IS-IS area level (L2) metric between device A and device Z. |
| ISIS1 ZA | Displays the IS-IS area level (L2) metric between device Z and device A. |
| OSPF AZ | Displays the OSPF metric between device A and device Z. |
| OSPF ZA | Displays the OSPF metric between device Z and device A. |
| Packet Loss AZ |
Displays the packet loss metric observed on the link from interface A to interface Z. Packet Loss AZ indicates the measured percentage of packets that are lost on the link from interface A to interface Z. |
| Packet Loss ZA |
Displays the packet loss metric observed on the link from interface Z to interface A. Packet Loss ZA indicates the measured percentage of packets that are lost on the link from interface Z to interface A. |
| Faulty |
If Link Packet Loss Violation Count, Link Packet Loss Violation Interval, and Link Packet Loss Threshold are configured, then a link is marked faulty when the count of consecutive violations of Link Packet Loss Threshold exceeds the specified packet loss violation count within the specified packet loss violation interval. |
| Packet Loss Threshold AZ |
Displays the packet loss threshold configured on the link from interface A to interface Z. Packet Loss Threshold AZ is a configured value and the maximum acceptable packet loss percentage before the system considers the link from interface A to interface Z to be in violation. |
| Packet Loss Threshold ZA |
Displays the packet loss threshold configured on the link from interface Z to interface A. Packet Loss Threshold ZA is a configured value and the maximum acceptable packet loss percentage before the system considers the link from interface Z to interface A to be in violation. |