Detect Physical Layer Faults
Use this topic to understand how Juniper Routing Director automatically detects physical layer faults (bad or faulty cables) and how you can use the GUI to view alerts and information related to the faults.
Physical Layer Fault Detection Overview
When a network cable is unplugged or breaks, it is easy for an operator to pinpoint the issue because all traffic transmitted through the cable drops. However, when a cable degrades or is not plugged in properly, the signal carried by the cable is attenuated or weakened. This can cause some traffic through the cable to drop. Because the cable is partially functional, it is difficult for operators to detect that the traffic drops are caused by a faulty cable.
Routing Director enables you to automatically detect faults in cables (also called bad cables or physical layer faults) by using AI/ML (artificial intelligence [AI] and machine learning [ML]) techniques. Routing Director uses trained ML models to analyze the data received from network devices and detects when a cable has turned faulty. It then raises an alert in the GUI, which enables you to easily identify the faulty cables. You can replace such faulty cables before they cause traffic disruption.
Routing Director automatically detects physical layer faults on 100G CWDM and LR4 optical cables connected to ACX7100-48L.
Routing Director detects physical layer faults in the following scenarios:
-
During device onboarding—When a device is being onboarded, Routing Director can detect if a cable connected to the device is not working properly, and then alert the field technician advising a replacement. However, because this detection takes place during device onboarding, when the device has a short history, the accuracy of the prediction is limited. During device onboarding, Routing Director triggers an alert for faulty cables in approximately 10 minutes after the neighbor ping test is initiated.
-
During device operation—After the device is onboarded successfully and is managed, Routing Director monitors the device continuously. It then uses the historical data to detect physical layer faults, and triggers an alert within 30 minutes of the cable turning faulty.
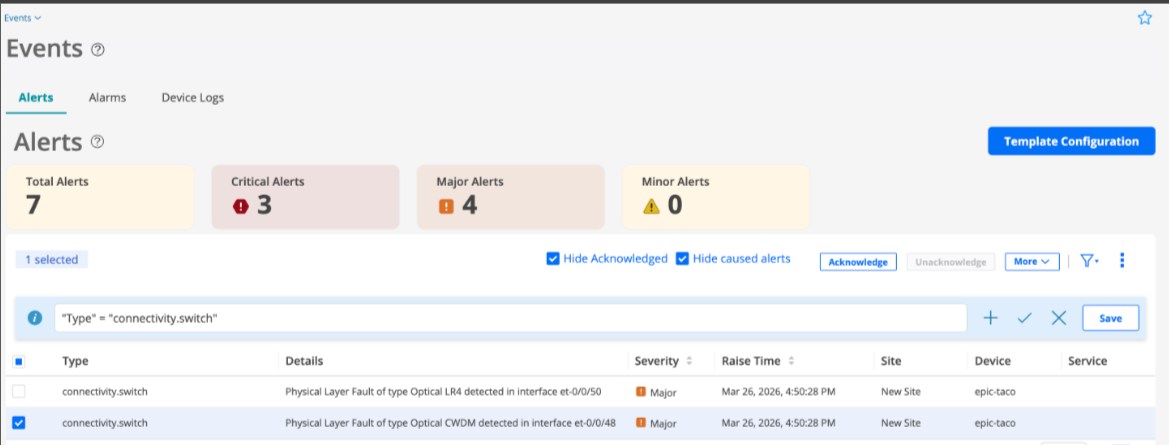
Physical Layer Fault Notifications in the GUI
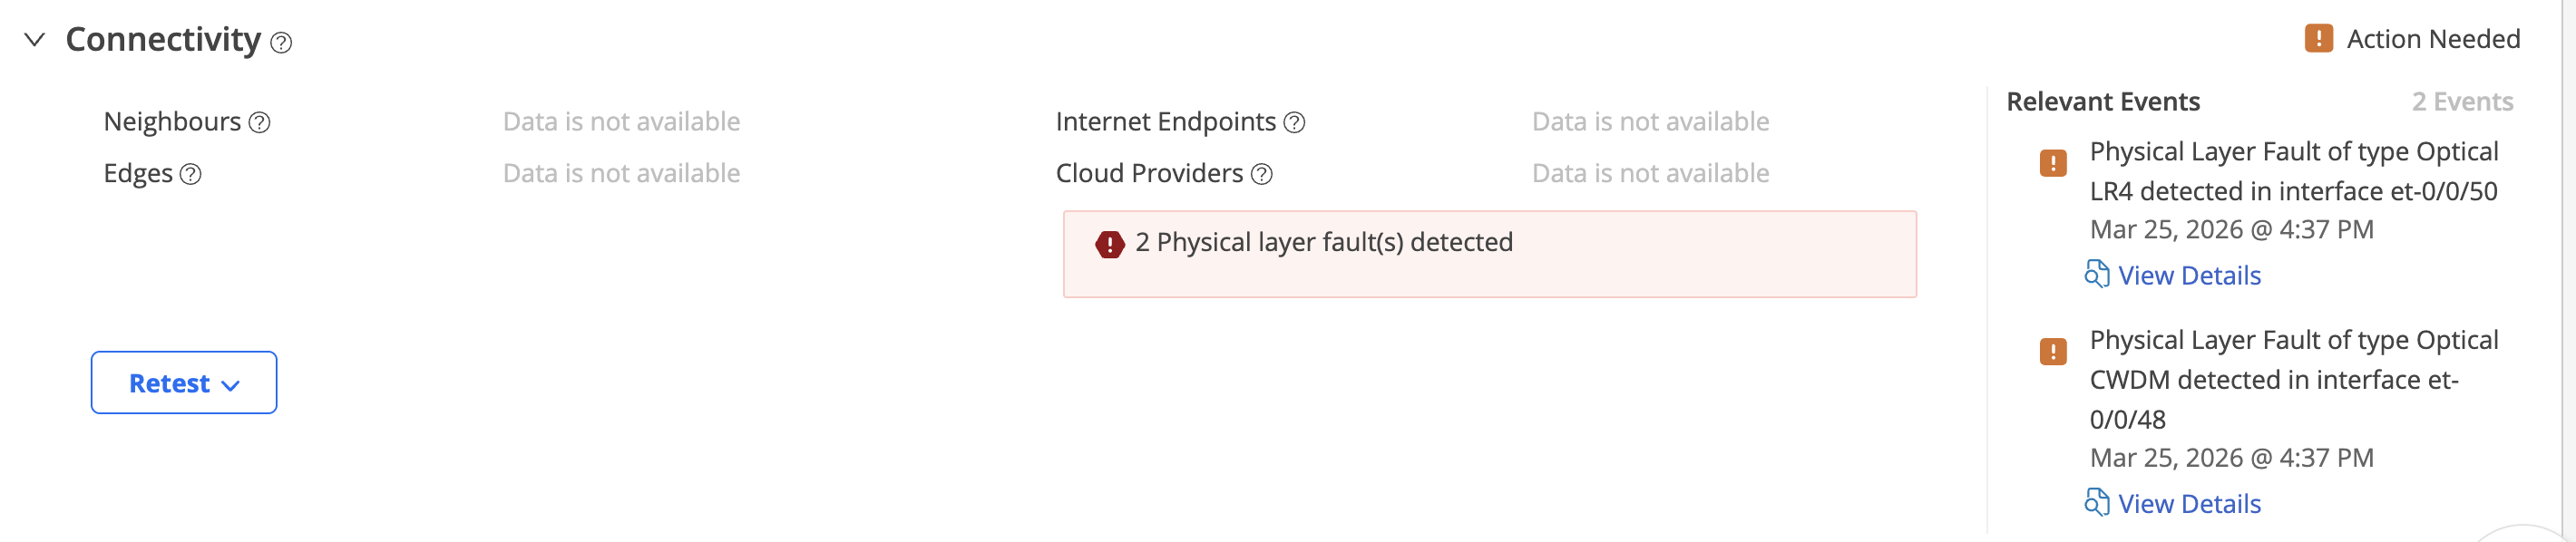
In the Routing Director GUI, physical layer fault notifications for a device are shown on the Connectivity accordion of the Device-Name page as shown in Figure 1.
To view physical layer fault notifications in the GUI:
-
(Optional) Click View All Relevant Events to view
all the connectivity-related events for the device, including physical layer
fault events.
The events are listed as alerts on the Events page (Observability > Health > Events.) as shown in figure.
Figure 2: Alerts Indicating Physical Layer Faults