Detect Blackholes
Use this topic to understand how Juniper Routing Director provides notifications about blackholes and information for root cause analysis of the blackhole events.
A traffic blackhole occurs when transit traffic is consistently or intermittently dropped before reaching an intended destination. Blackholes may arise due to several underlying issues, including:
- Hardware errors (for example, interface failures, fabric issues, or queuing-related drops)
- Software issues
- Cascading effects from events such as BFD session flaps, link flaps, line card restart, GRES, NSR, Configuration Change
- Resource exhaustion
- Incorrect or suboptimal configuration
Routing Director leverages AI/ML analytics to automatically detect blackholes triggered by these conditions. Blackhole detection is supported on:
-
MX204, MX240, MX10008
-
PTX10004 and PTX10008 with BT line cards LC1201 and LC1202
When blackhole detection is enabled on Routing Director, sensors are initialized to capture critical forwarding‑plane metrics—specifically input packet rates, output packet rates, and packet drop rates. A blackhole condition is flagged when the packet drop rate persistently exceeds configured thresholds.
To detect blackholes:
-
PTX Series devices must run Junos OS Evolved Release 24.4R2 or later and MX Series devices must run Junos OS Release 24.4R2 or later.
-
Blackhole detection must be enabled in Routing Director.
Use the following commands to configure blackhole detection in Routing Director:
For Routing Director to detect and display blackholes, the following commands must be configured in the Routing Director installation:
set deployment cluster applications aiops install-aiml true
set deployment cluster applications aiops enable-blackhole true
See Deploy the Cluster for details.
Note:Enabling AI/ML requires additional system resources (CPU, storage, and memory). We recommend that
install-aimlandenable-blackholeare set totrueonly if sufficient CPU, memory, and storage are present in the Routing Director cluster. For information about the additional resources required for AI/ML, see Hardware Requirements.When you enable blackhole detection on Routing Director, playbook rules for collecting KPIs (packet drops, software errors, and hardware interrupts) to detect blackholes are applied to the devices.
View Blackhole Details
Routing Director identifies blackholes based on changes in the number of packets dropped over a period of time. If the number of packets dropped exceeds a specified threshold, Routing Director generates a critical alarm indicating blackhole. This information is displayed as Traffic Loss in the Alerts table (Observability > Events > Alerts tab) and the Routing and MPLS accordion of the Device-Name page. To access the Device-Name page, click Observability > Health > Troubleshoot Devices > Device-Name > Overview > Routing and MPLS accordion > click Traffic Loss Alert link.
Figure 1 displays the Blackhole Detected alert on the Routing and MPLS accordion.
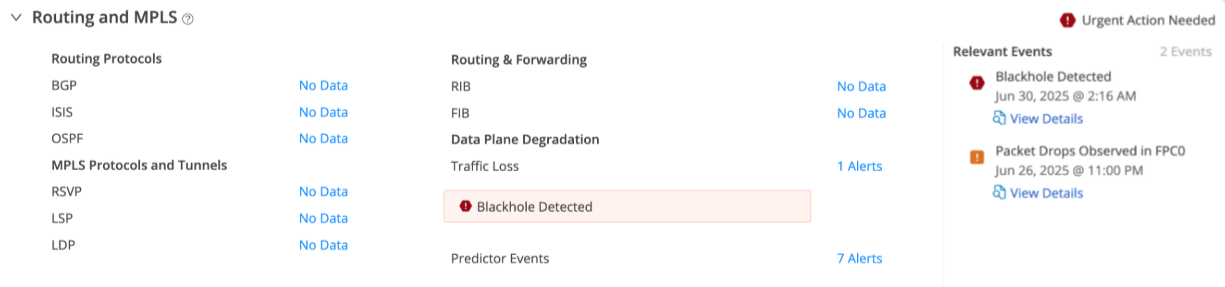
Click the Alerts link to view the details of the alerts on the Traffic Loss page. The alerts are listed in a table with
-
A red alert icon (critical) indicating that blackhole is detected. A blackhole is detected when the captured packet drop rate exceeds the defined threshold.
-
An orange alert icon (major) indicating that packet drop anomalies are present. A major alert is raised when the packet drop rate exceeds the defined threshold.
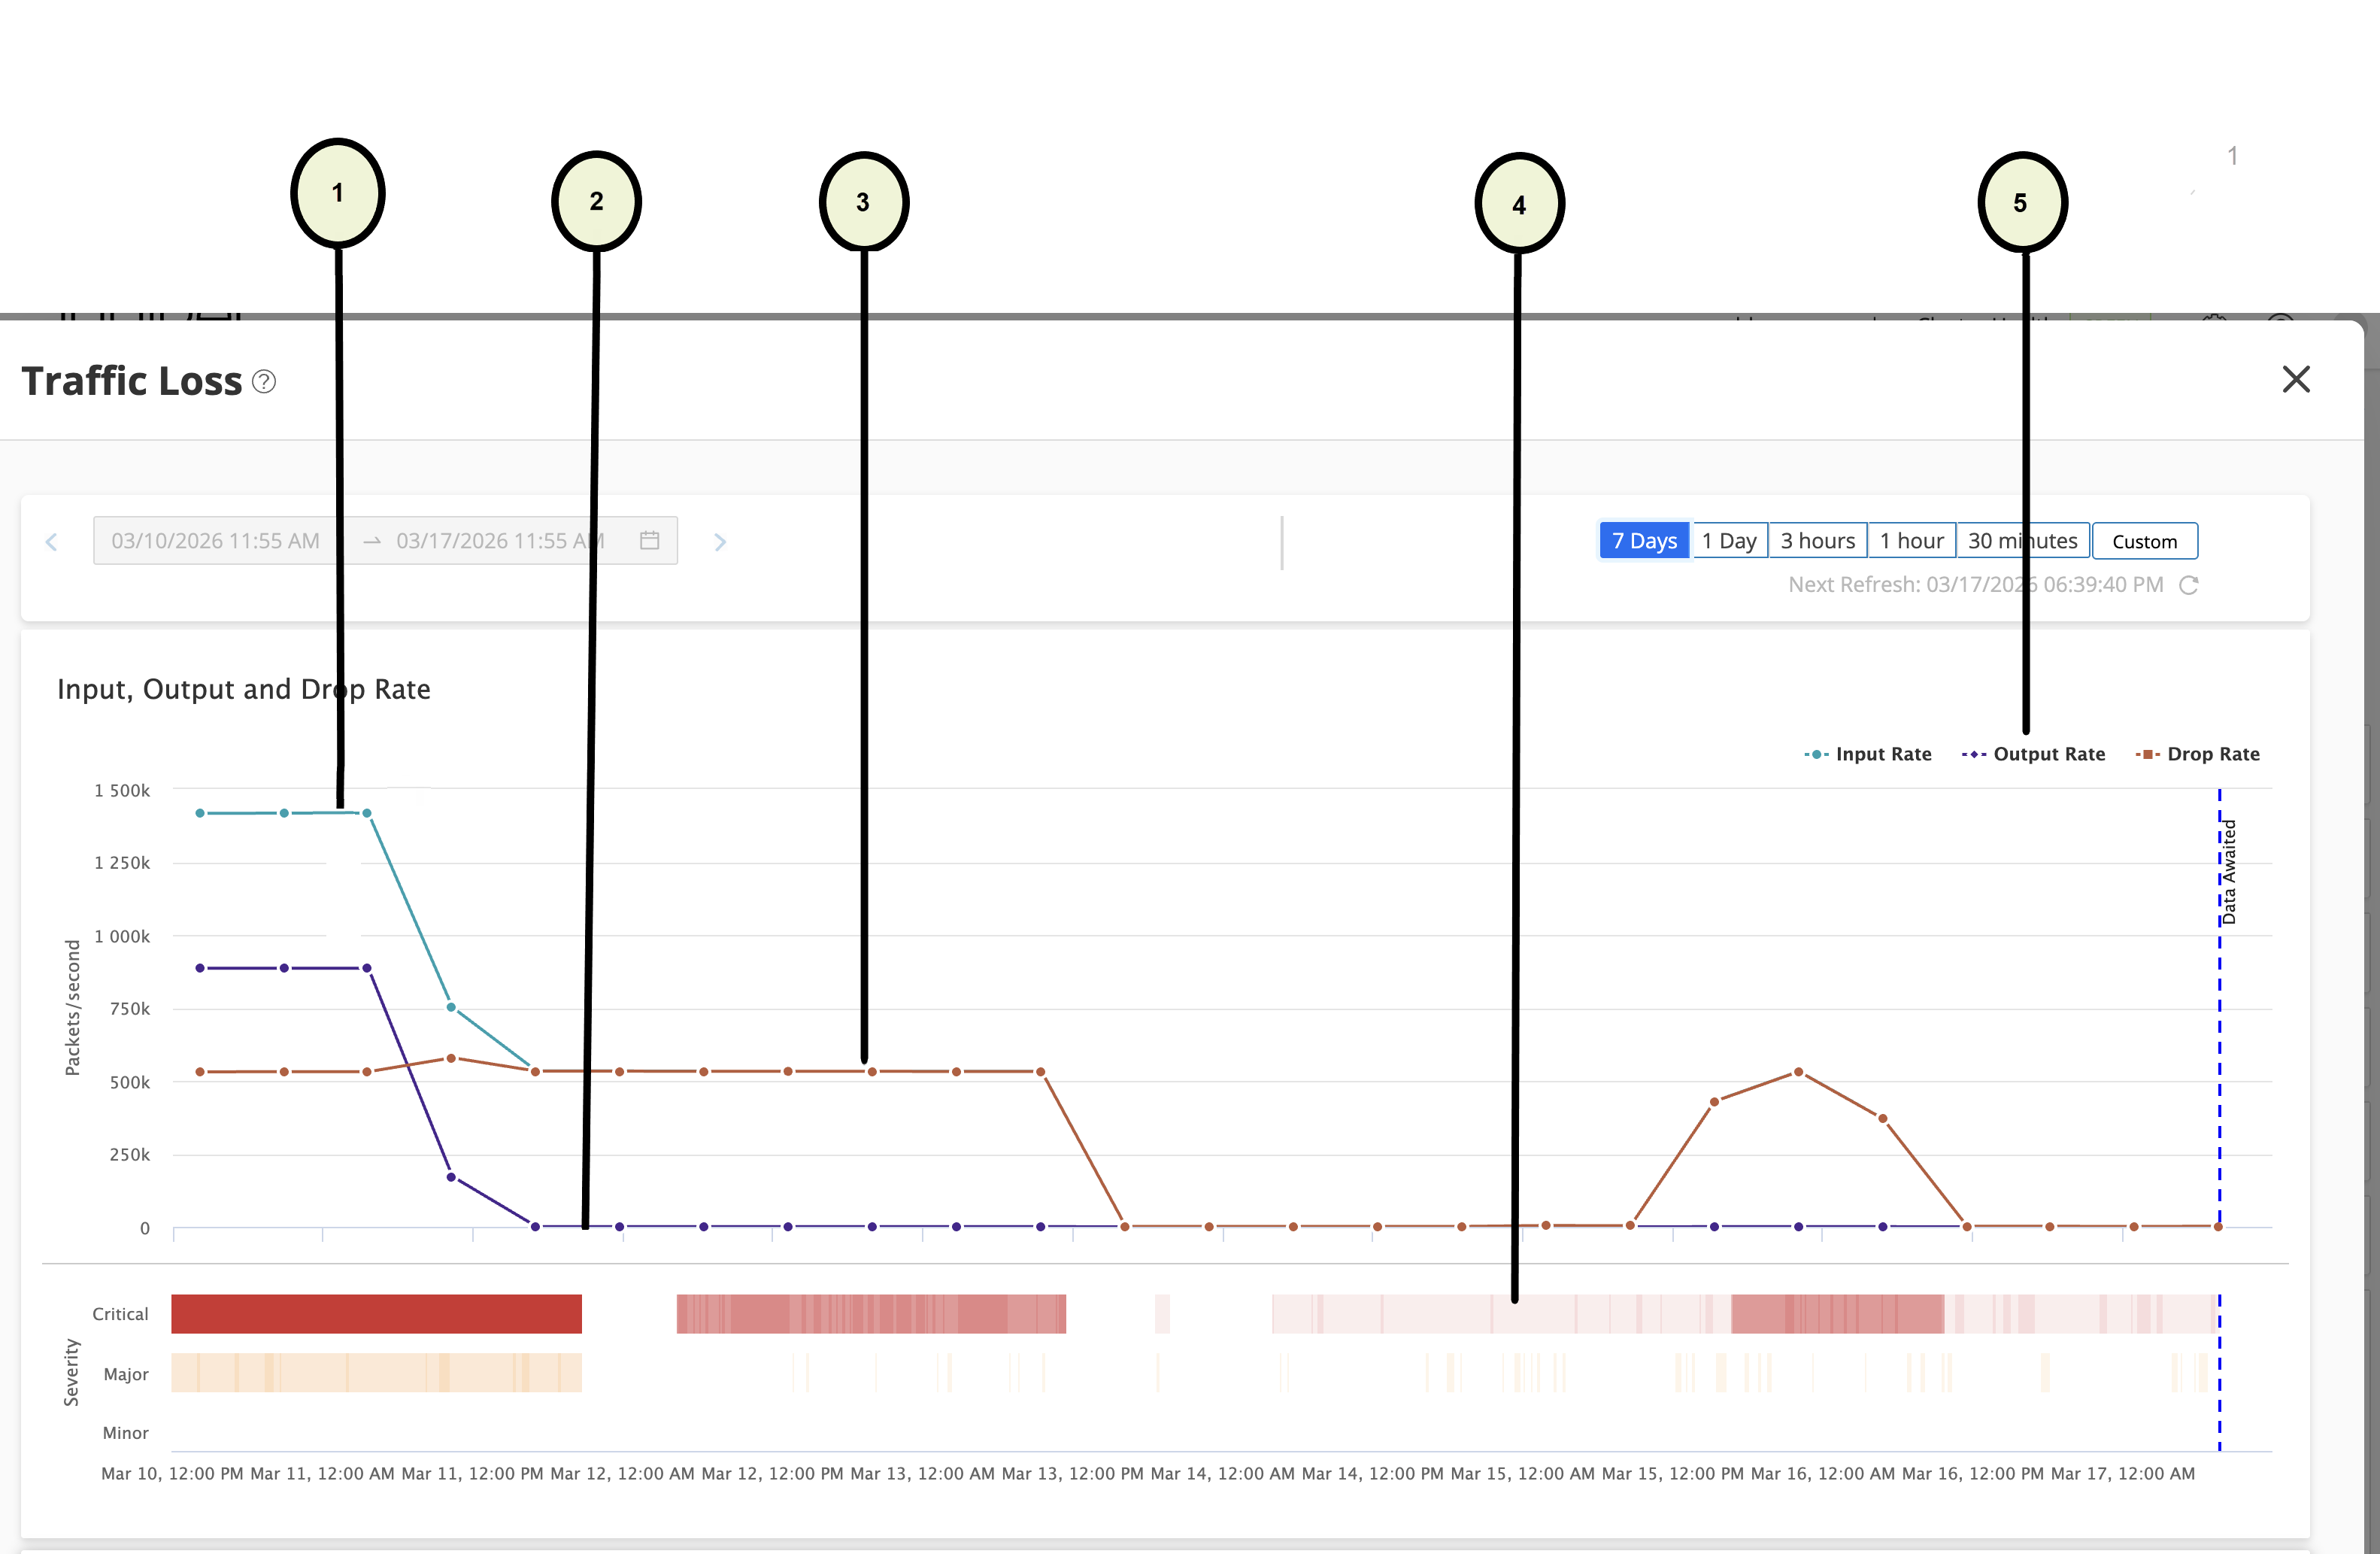
figure shows the graphs on the Traffic Loss page. You can view the following on the Traffic Loss page:
-
A graph showing packet input rate, packet output rate, and drop rate on the same graph. Click a label to turn off the graph for that KPI. For example, clicking input rate turns of the graph of for input packet rate.
-
A graph showing the severity of the drop rate.
-
List of alerts below the graph.
For more information on the Traffic Loss page, see Traffic Loss.