View Stream Details
Streams Overview
At the time of Test or Monitor creation, you can configure evaluation criteria for various metrics.
When you run a Test or a Monitor, Routing Director instructs the Test Agents to send or receive traffic in the network by using the selected protocols. Each measurement produces one or more Stream of metrics.
The Test and Monitor evaluate these Streams and present a summary in the respective Measurement-Name Details pages. On violation of a configured evaluation criterion, an event is generated. You can view the Stream graphs on Measurement-Name Details page and identify the cause of violation.
Access Measurement-Name Details Page
To access the Measurement-Name Details page:
-
Select Observability > Active Assurance > Tests or Observability > Active Assurance > Monitors, and click a Test-Name or a Monitor-Name.
The Test-Name or Monitor-Name page appears.
-
Click a Stream-Name from the Streams table.
The Measurement-Name Details page appears.
Tasks You Can Perform
On the Measurement-Name Details page, you can:
-
View Stream results for a specific period—You can select a predefined period (15m, 2h, 4h, 8h, 16h, 24h, 1w) for which you want to view the results of all Streams. You can also click Custom to set a custom time range for which you want to view the results of all Streams. When the Custom Time Range selection page appears, specify the day and time in the From and To fields, respectively.
-
View the list of events—You can view the events generated by the Streams, and the date and time at which the event has occurred. The Event bar displays events based on the severity levels. The high-priority event, Critical, is displayed at the top of the events list, while the low-priority event, Information, is displayed at the end of the list.
To view the list of all the events generated in the order of occurrence, click the More option. When you click More, the Events page appear. You can also sort the columns in the Events page. For more information on the events generated by the Streams, see Table 1.
-
View the events on an event bar—You can view all the events generated on an event bar. The event bar is a color-driven bar graph that indicates events and the time at which the event has occurred. The colors represent the severity of events. That is, critical events are represented in red, errors are represented in orange, warnings are represented in yellow, information is represented in blue.
You can also hover over an event generated on the event bar to view the start time, end time, total number of events generated, and the number of events generated in each type.
-
View the status of the selected Stream—You can view the status of the selected Stream. The Stream is displayed as an event bar. Click > to view the event bar for the Stream. When you hover over the event bar, you can view the events generated for the Stream.
-
View the configurations details—You can view all the parameters you specified for a Task when you created a Test or a Monitor. Click Config to view all the parameters you have configured. For more information, see Create a Test and Create a Monitor.
-
View the stream graph for a specific metric—You can view a stream graph of a specific metric. To view a stream graph, enable the Metric-Name toggle button for which you want to view the stream graph. The Metric-Name can vary based on the Tasks you have selected. A list of all the metrics are defined in Supported Plug-ins.
-
View stream graphs for all metrics—You can view the stream graphs of all the metrics. To display stream graphs of all the generated metrics, click the Show All button.
-
Group stream graphs by metrics—You can organize the stream graphs logically to get a coherent view of metrics.
When you enable the Group Metrics toggle button, the metrics are logically categorized. That is, all the related metrics are grouped under a primary stream graph. For example, for a ping Task, metrics such as minimum time response, maximum time response, and average time responses will be grouped under Response (primary metric).
Once enabled, you can select and deselect the individual metrics in an stream graph. The data related to the metrics you selected will be displayed on the stream graph.
When you disable the Group Metrics toggle button, all the metrics are displayed. By default, this toggle button is disabled.
-
View stream graphs in compact view—You can view all the stream graphs in compact mode to navigate easily between individual graphs. The compact view provides a streamline view of multiple graphs. To view the stream graphs in compact mode, enable the Compact view toggle button.
All the stream graphs for the metrics you toggled on will be displayed in compact view. The compact view provides a concise display of all the stream graphs that helps you to analyze various metrics simultaneously.
| Field | Description |
|---|---|
| Severity |
The type of severity level of the event that is raised when there is a criteria violation. The following are the severity levels: Critical—Indicates that the event is critical and needs immediate attention. Warning—Indicates that the event needs to be fixed but does not require immediate attention. Info—Indicates that an event is raised that provides information on progress of the Task and does not require attention. Error—Indicates that the event needs to be fixed and requires immediate attention and troubleshooting. |
| Description |
The description that you specified when you configured the evaluation criteria for a Monitor. |
| Raise Time |
The date and time when the event was generated. The timestamp is displayed in the following format: Month DD, YYYY, HH:MM:SS AM/PM. The date and time is displayed according to the Raise delay you specified when you configured the evaluation criteria for a Monitor. For example, Mar 5, 2024, 4:29:52 PM. |
| Clear Time |
The date and time when the event was cleared. The timestamp is displayed in the following format: Month DD, YYYY, HH:MM:SS AM/PM. The date and time is displayed according to the clear delay you specified when you configured the evaluation criteria for a Monitor. For example, Mar 5, 2024, 4:29:52 PM. |
|
Subject |
The details of the event generated is displayed in JSON format. It displays various IDs related to the event like Test Agent ID, Monitor ID, Task ID, Stream ID, and so on. To view the details, click show hyperlink. |
|
Data |
The details of the evaluation criteria associated with the event generated. To view data, click show hyperlink. |
Analyze the Stream Graph
A stream graph is a graphical representation of a metric generated by a Stream over a period of time. You can generate multiple stream graphs for various metrics by enabling the corresponding toggle button.
In the stream graph, the X axis (horizontal) always represents the time duration of Test or Monitor. The Y axis (vertical) represents the metric value that is being measured.
For example, create a Test by adding an RPM Ping Task with the threshold value for Round Trip Time (RTT) set to 10 seconds (s). When you run this Test, the following graph is displayed in the Stream-Name Details page.
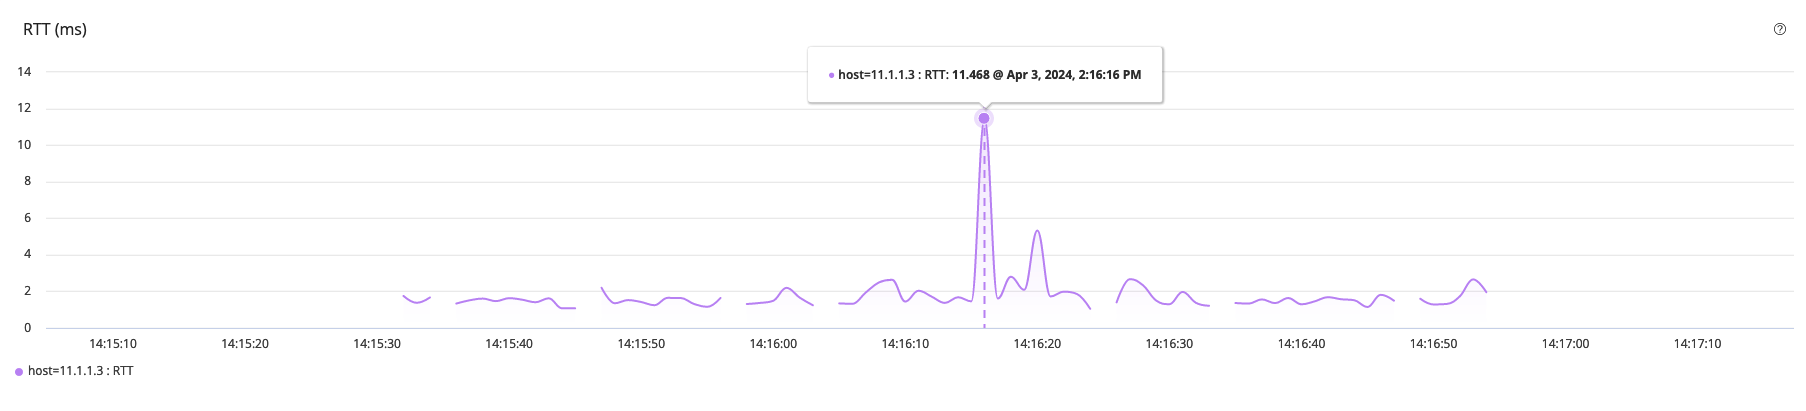
In this stream graph (Figure 1), the X axis represents the time duration of the Test (14:15:10 through 14:17:10) and the Y axis displays the RTT value (0 through 14 milliseconds).
From the stream graph, you can infer that the RTT has exceeded the threshold (> 10) value at 14:16:16. At this moment, because the RTT value reached 11.468 ms, which is greater than the specified threshold value, an event is generated.