About the Topology Tab (Path Trace)
To access the Topology tab, select Observability > Active Assurance > Monitors > Monitor-Name > Measurement-Name > Path Trace > Topology.
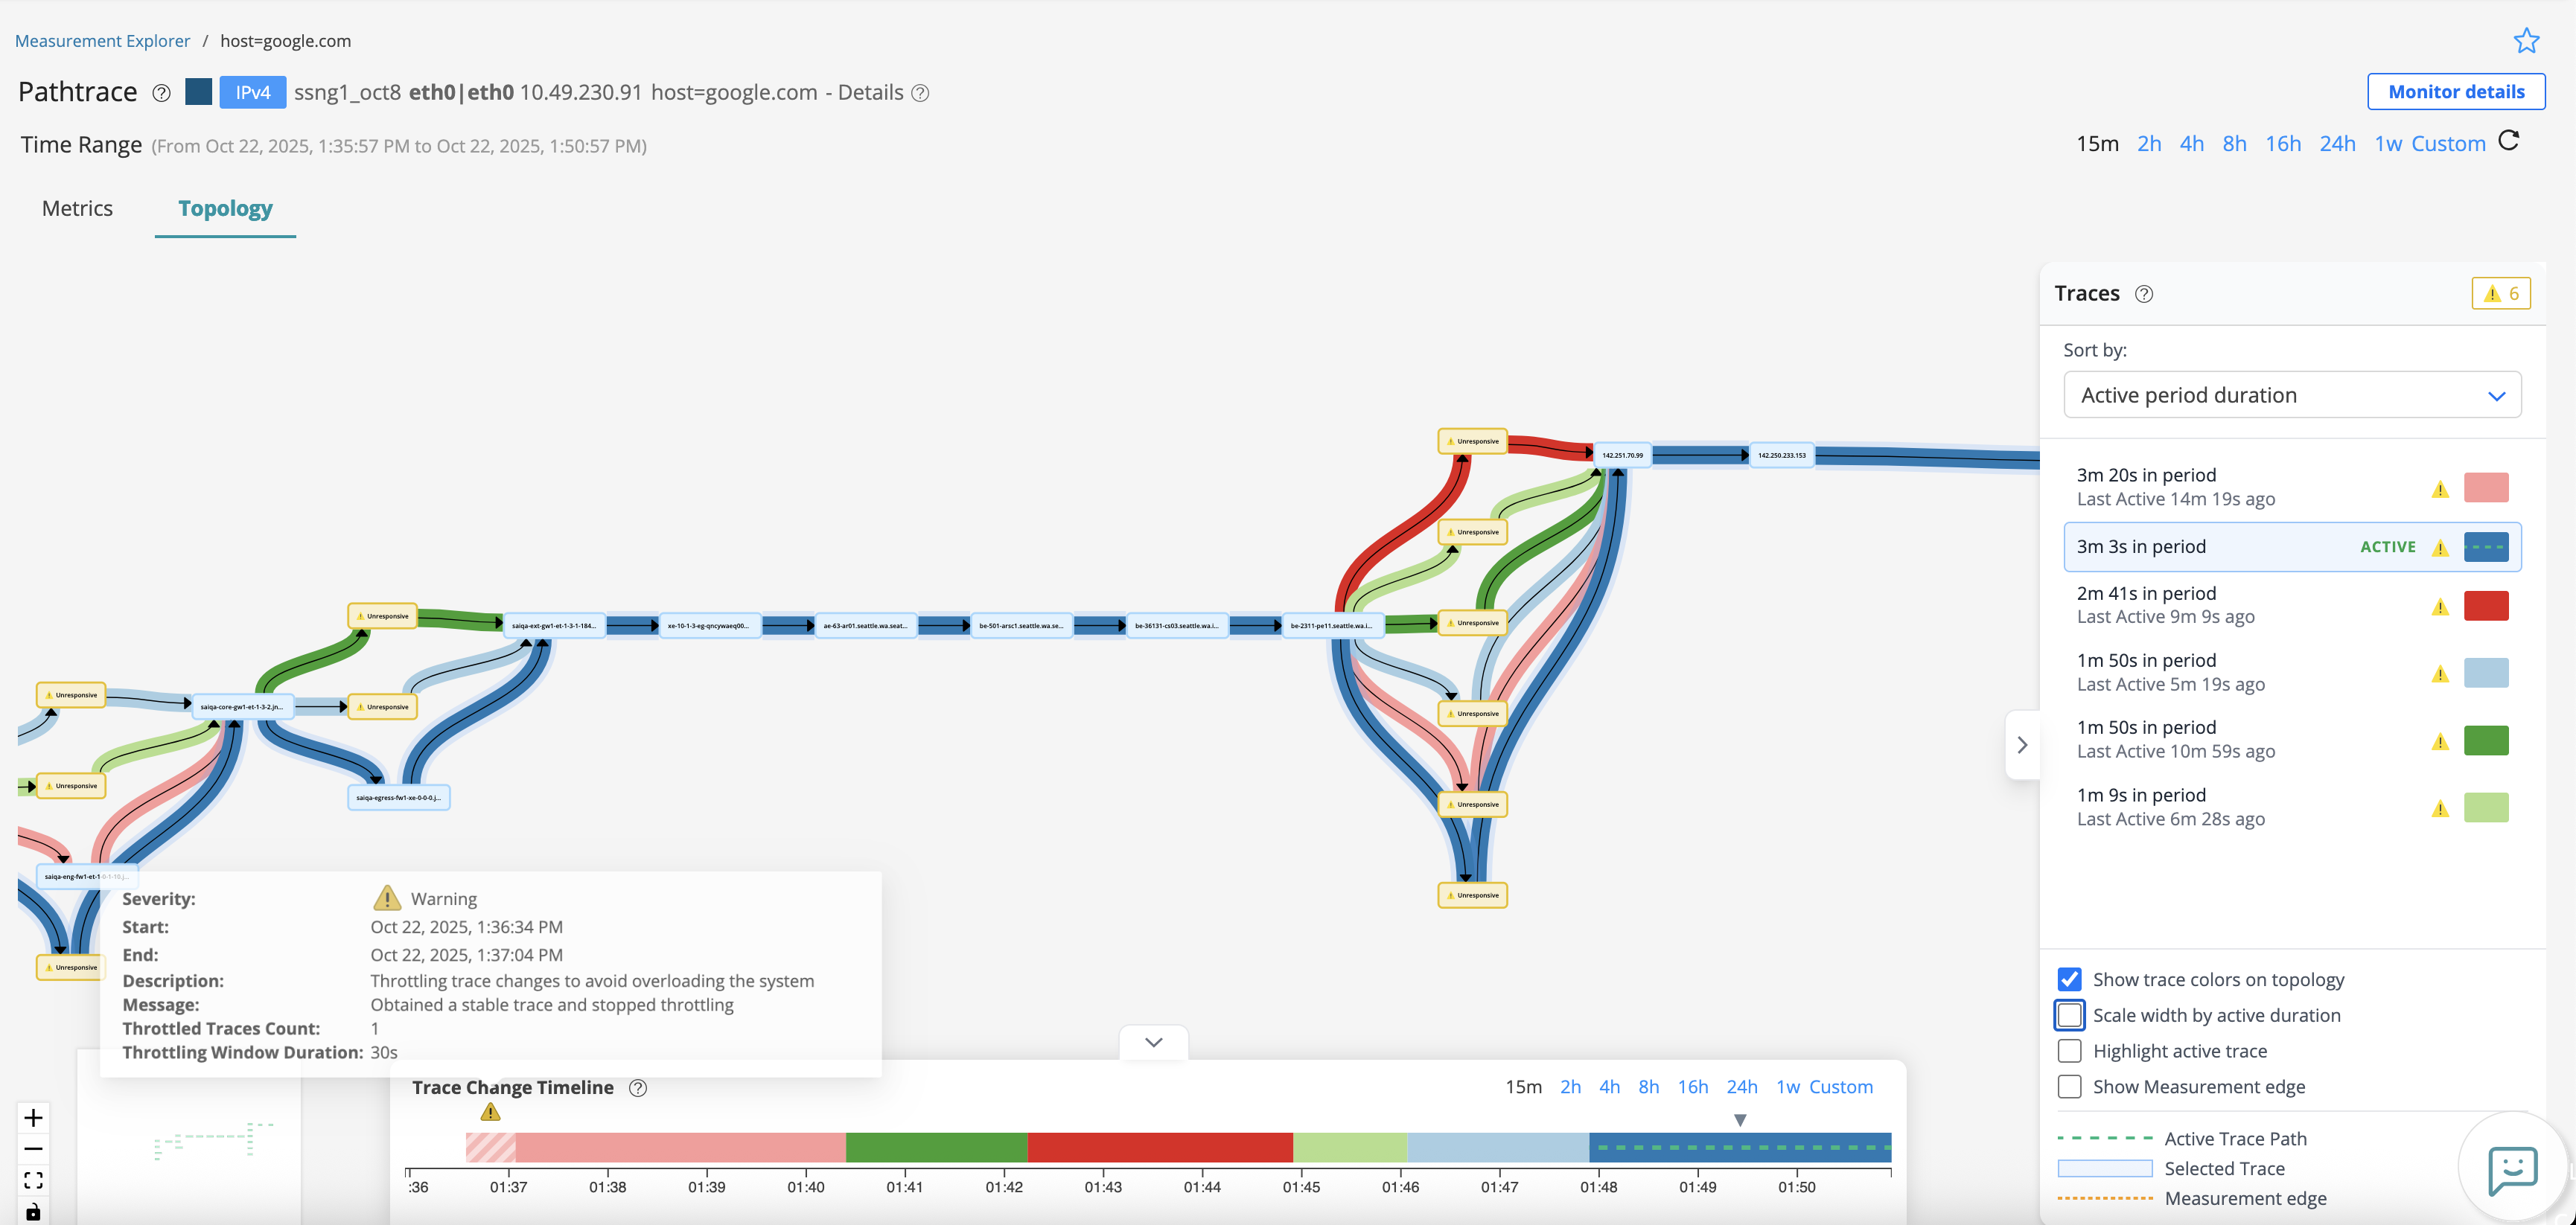
The topology view provides a visual representation of end-to-end path between Test Agent Interfaces (source) and Endpoints (destination). It also displays the successive hops between intermediate routers taken by the traffic. Use this tab to track Trace changes over time.
Path Trace is based on the functionality of the traceroute CLI command,
which uses the ICMP protocol. Please note that packets using other protocols may follow
different routes depending on the network configuration.
The Topology tab contains three components—Interactive topology view, topology traces view, and trace changes timeline.
Task You Can Perform
-
View interactive topology —The interactive topology view enables you to view details of the end-to-end trace between the source and destination, including intermediates hops taken by the traffic. You can identify the active trace currently in use, view measurement edges and their details, and detect unresponsive hops. The colour assigned in each trace is also reflected in the traces view and timeline view to identify each trace easily. For more information, view Table 1.
-
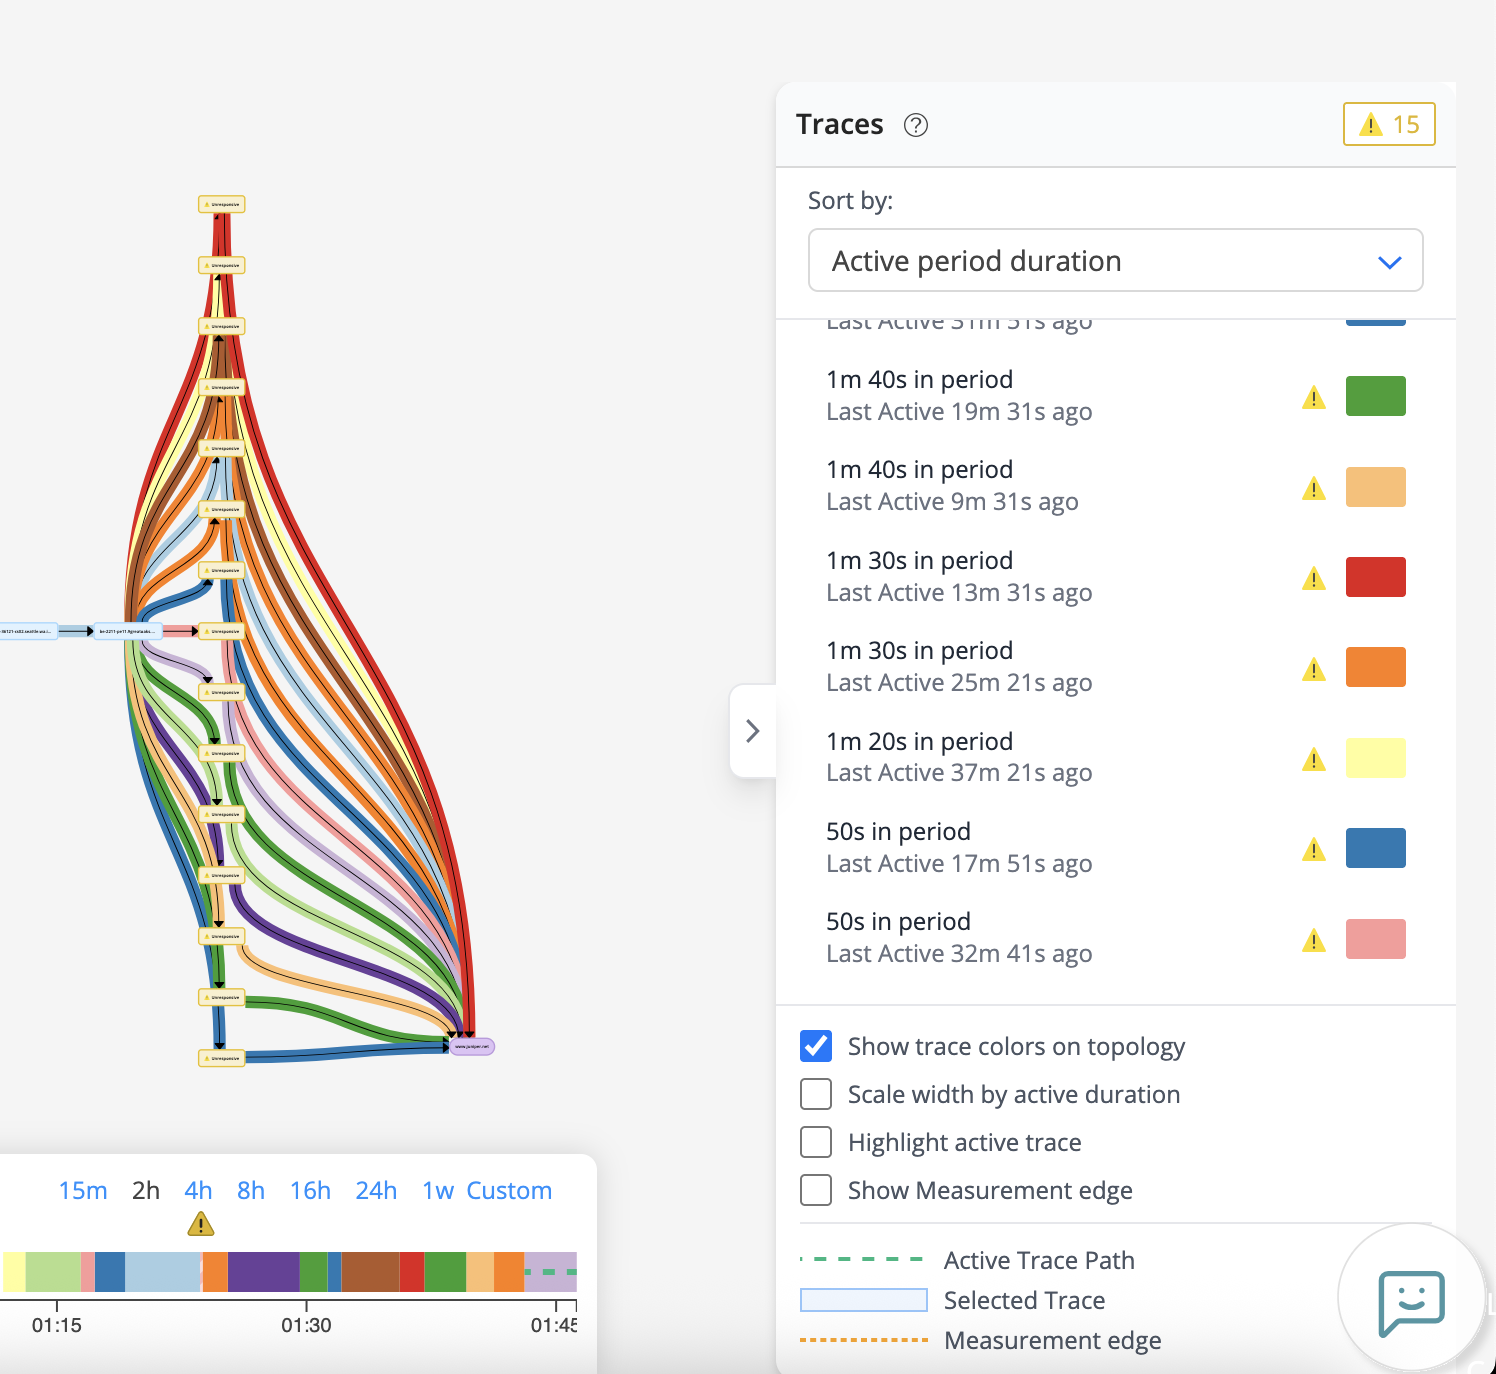
View topology traces details—The topology traces view enables you to view the list of traces captured during a selected period of time. You can sort each trace entry by the last active time, total active duration, and total active period duration. You also view the total number of unresponsive hops, and customize the topology view. The colour assigned in each trace is also reflected in the topology view and timeline view to identify each trace easily. For more information, view Table 2.
-
View topology timeline—The topology timeline view enables you to view the history of trace changes within the selected time range. You can select a range, track routing changes, and preview traces on the topology view. The timeline helps to understand when the routing changes occurred and how frequently different paths were taken. The colour assigned in each traces is also reflected in the topology view and traces view to identify each trace easily. For more information, view Table 3.
Interconnected Behavior Across Topology Components
The three views in the Topology tab are highly correlated and interact dynamically to enhance trace analysis:
-
Clicking a Trace in the Topology Traces View on the right highlights the corresponding trace in the Topology Diagram view and also highlights the traces in the Trace changes timeline by showing a small arrow for each time that Trace was active.
-
Hovering over a trace in the Traces View highlights the path in the Topology Diagram View and shows a faded arrow in the Timeline View, helping you preview without selecting.
-
The color assigned to each trace is consistent across all three views, making it easy to track and correlate data visually.
The interconnected behavior between the Topology Diagram view, Topology Traces View, and Trace changes timeline enables users to analyze routing behavior more effectively. This allows you to correlate trace changes with specific time periods, visually identify which paths were active at any given time, and understand how routing changes impact end-to-end connectivity.
| Tasks | Descriptions |
|---|---|
|
Customize Time Range |
You can select a predefined period (15m, 2h, 4h, 8h, 16h, 24h, 1w) for which you want to view the results in the topology view. You can also click Custom to set a custom time range for which you want to view the results. When the Custom Time Range selection page appears, specify the day and time in the From and To fields, respectively. |
|
View time range |
View the time range (From and To) selected for displaying the Path Trace details. |
|
View Test Agent Interface details |
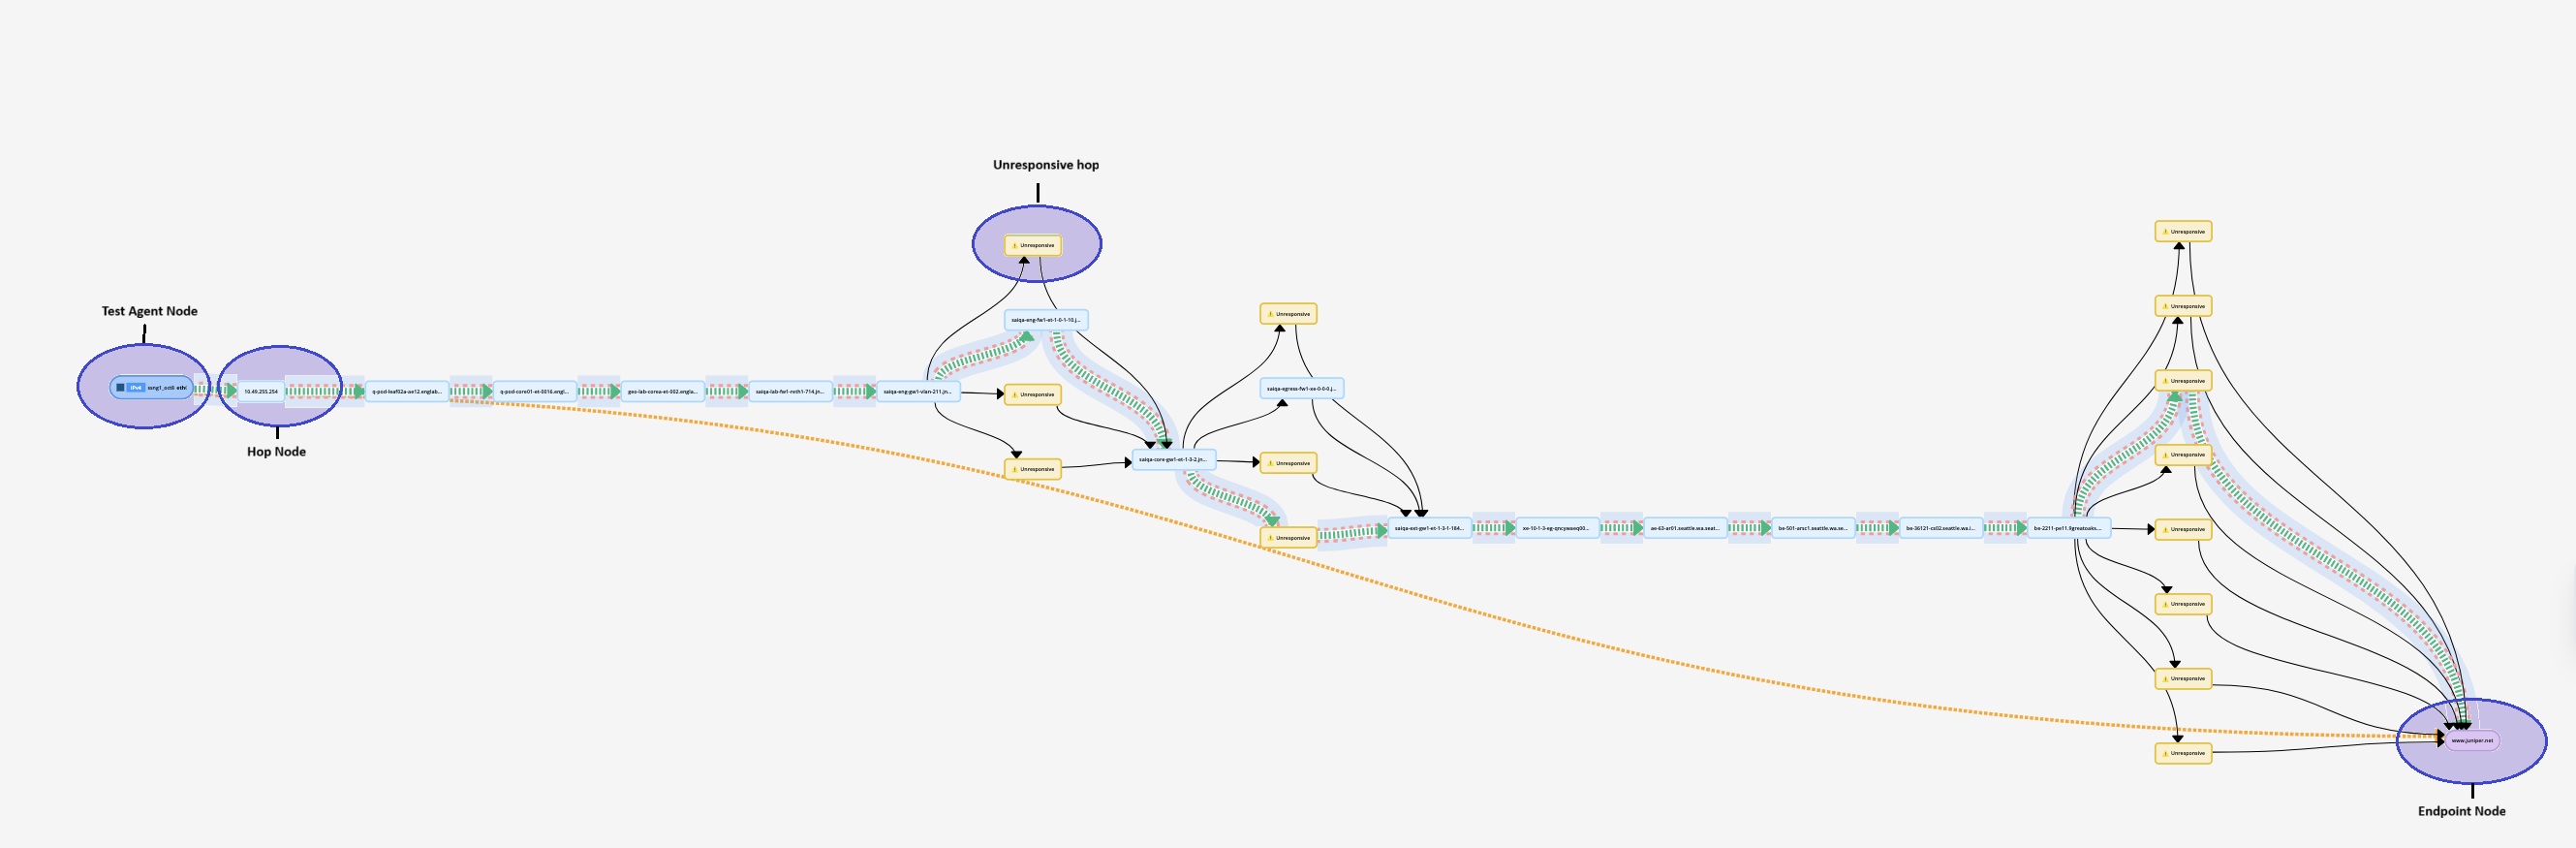
Click sender-name in the topology view to display the details of Test Agent interfaces used as sender. You can view details such as Test Agent name and type, the timestamps when the hop that represents sender was first detected and last active in any route. It contains Test Agent interface details such as bind interface and address, namespace, bind family, and whether the interface runs on a device. For pictorial representation, see Figure 3. |
|
View intermediate hop details |
Click a hop in the topology view to display details of the intermediate node between the source and destination. The hop details include the host name with its IP address in brackets, the timestamps when the hop was first detected and last active, and additional information whether if the hop was associated with concrete domain. For pictorial representation, see Figure 3. |
| View unresponsive hop details |
Click an unresponsive hop in the topology view to display details of a hop that did not respond during the trace. An unresponsive hop is displayed in yellow as a warning alert. You can view details such as the timestamps when the hop was first detected and was last active in the network, the trace route IP reported by the trace, the hop index in the trace, the latest result with the domain name, and whether the hop is the last hop in the trace sequence. The details also includes a message indicating that the hop is not responding to test packets. For pictorial representation, see Figure 3. |
|
View endpoint details |
Click endpoint-name in the topology view to display the details of the destination endpoint. You can view details such as when the endpoint was first detected and last active in the network, the plug in name and plug in version used for the measurement, and the host name. For pictorial representation, see Figure 3. |
|
Zoom in |
Click the Zoom in (plus) icon to zoom in the topology view. |
|
Zoom out |
Click the Zoom out (minus) icon to zoom out the topology view. |
|
Fit in |
Click the Fit view (box) icon to fit the topology view to the page size. |
|
Toggle interactivity |
Click the Toggle interactivity (lock) icon to lock or unlock the topology view. When you lock the Toggle interactivity icon, you can drag the topology anywhere on the Topology tab. When you unlock the Toggle interactivity icon, you cannot drag the topology anywhere on the Topology tab. |
|
Drag measurement edges |
Reposition the measurement edges for better view and to avoid overlap. |
| Highlight active path | Click a path to visually differentiate the selected path over other paths. |
| Tasks | Description |
|---|---|
|
Show/Hide traces |
Click the Trace selector icon to view or hide the Traces View. |
|
View unresponsive nodes |
Click the Warning (yellow) icon to view the number of traces that were unresponsive during the selected period. |
|
Sort by |
Sort traces based on last active time, total active duration, or overall active period.
|
| Customize topology view |
Customize the topology display using the following options:
|
|
View trace indicators |
View the topology trace indicators:
|
| Tasks | Descriptions |
|---|---|
|
Show/Hide Timeline |
Click the down arrow to expand or collapse the topology timeline view. |
|
Customize time range |
Select a predefined period (15m, 2h, 4h, 8h, 16h, 24h, 1w) for which you want to view the results in the timeline view. You can also click Custom to set a custom time range for which you want to view the results. When the Custom Time Range selection page appears, specify the day and time in the From and To fields, respectively. |
|
Highlight trace in topology View |
Click a specific trace colour in the timeline view to highlight the selected path in the topology view. |