Router Throughput SLE
Throughput is the speed at which a data packet can move from one node to another on a network. A high throughput value indicates that data is being routed rapidly and effectively.
Many factors, such as MTU mismatch, cable issues and so on impact a router's throughput. Juniper Routing Assurance continuously monitors these factors, and when they cross a predefined threshold, the router throughput SLE records failure minutes. Failure minutes is the duration in minutes during which the throughput was degraded.
Juniper Routing Assurance then performs root cause analysis and identifies the specific classifiers that caused throughput degradation. The Router Throughput SLE provides visualizations of these classifiers and enables administrators to assess the routing efficiency and the network's overall performance.
To access the Router Throughput SLE page, click Monitor > Service Levels > Routing > Router Throughput.
Click the site drop-down list to select a site. The Router Throughput page displays the SLE metric for the selected site. You can also switch to a router-specific view to analyze the SLE metric in detail. To view the SLE for a specific router at a site, select the router from the site > Router drop-down list.
What Does the Router Throughput SLE Measure?
The Router Throughput SLE measures the percentage of time when the network throughput was optimal. The Router Throughput SLE is a measure of the network's ability to transmit and to receive traffic without impedance.
Classifiers
A classifier is a parameter that indicates whether a router is performing optimally or not. When the network's throughput success threshold is not met, Juniper Routing Assurance collects and classifies the factors contributing to failures, into classifiers (also referred to as health indicators). The router throughput SLE monitors the following classifiers:
-
Congestion─Monitors the impact of congestion on throughput. This classifier provides information about the duration of time that throughput is affected by congestion in the network.
Congestion in the network occurs because of various reasons. As a consequence, some packets must be dropped to prevent network saturation and to facilitate easy flow of traffic in the network. Tail drop profile is one such congestion management mechanism that allows the router to drop arriving packets when the output queue buffers become full or begin to overflow. Random early detection (RED) drop profiles is another congestion management mechanism that prevents buffer overflow. RED drop profiles help manage network congestion by dropping packets before queues become full. In Junos OS, a RED drop profile is defined by two important components:
-
Queue fullness─Represents the percentage of a queue that is currently occupied by packets. It ranges from 0 percent (empty queue) to 100 percent (full queue).
-
Drop Probability─The likelihood that a packet will be dropped when the queue reaches a certain level of fullness. It ranges from 0 percent (no packets dropped) to 100 percent (all packets dropped).
You can control congestion by configuring RED drop profiles, if the device supports assured forwarding. RED drop profiles use drop probabilities for different levels of buffer fullness to determine which scheduling queue on the device is likely to drop assured forwarding packets under congested conditions. The device can drop packets when the queue buffer utilization exceeds the configured percentage.
Randomly dropped packets are counted as RED-dropped, while packets dropped for other reasons are counted as tail-dropped.
You can configure the scheduling priority of individual queues by specifying the priority in a scheduler, and then associating the scheduler with a queue by using a scheduler map. High priority queues receive preferential treatment over all other queues and utilize all of their configured bandwidth before other queues are serviced. Thus, failure minutes for congestion classifier are calculated by analyzing only the high priority queues. If all the queues of an interface have the same priority, the queue with the most number of drops becomes the most impacted queue. Juniper Routing Assurance determines the SLE score by considering the most impacted queue.
Note: ACX platforms that support Junos OS Evolved have zero tail drops. So, RED-dropped packets are considered for calculating the SLE score on these platforms. For other platforms, tail drops are considered instead.Juniper Routing Assurance highlights the most impacted queue in the Root Cause Analysis section. You can use the insights in the Root Cause Analysis section to decide whether a queue needs optimization. Optimizing output queue properties can significantly reduce the number of drops in a queue. Output queue properties include the amount of interface bandwidth assigned to the queue and the size of the memory buffer allocated for storing packets. You can configure the output queue properties from the router's CLI.
Note: By default, all queues are low priority queues. -
-
Interface Anomalies─Monitors minutes when the throughput is affected by errors at the router's interface. The Interface Anomalies classifier has three sub-classifiers that help you identify issues:
-
MTU Mismatch─Displays minutes affected by Maximum Transmission Unit (MTU) errors and input errors on the router interfaces. MTU errors in interfaces occur when a packet size exceeds the maximum allowed size for a specific interface. MTU mismatch errors occur due to oversized data packets or incorrectly configured interface settings.
You must ensure that the MTU value is consistent along the packet's path to avoid MTU mismatch errors. MTU mismatch will result in discarded or fragmented packets. In Juniper Networks routers, you can check for MTU mismatches in the MTU Errors and Input Errors sections in the output of the following CLI command:
user@host> show interfaces xe-2/1/0 extensive Physical interface: xe-2/1/0, Enabled, Physical link is Up Interface index: 258, SNMP ifIndex: 762, Generation: 2046 Link-level type: Ethernet, MTU: 1514, LAN-PHY mode, Speed: 10Gbps, BPDU Error: None, Loopback: None, Source filtering: Disabled, Flow control: Enabled Device flags : Present Running Interface flags: SNMP-Traps Internal: 0x4000 Link flags : None CoS queues : 8 supported, 8 maximum usable queues Hold-times : Up 0 ms, Down 0 ms Current address: 00:00:5E:00:53:00, Hardware address: 00:00:5E:00:53:00 Last flapped : 2011-12-17 00:19:02 PST (07:36:37 ago) Statistics last cleared: 2011-12-17 07:55:24 PST (00:00:15 ago) Traffic statistics: Input bytes : 110000 0 bps Output bytes : 0 0 bps Input packets: 1000 0 pps Output packets: 0 0 pps IPv6 transit statistics: Input bytes : 110000 Output bytes : 0 Input packets: 1000 Output packets: 0 Input errors: Errors: 0, Drops: 0, Framing errors: 0, Runts: 0, Policed discards: 0, L3 incompletes: 0, L2 channel errors: 0, L2 mismatch timeouts: 0, FIFO errors: 0, Resource errors: 0 Output errors: Carrier transitions: 0, Errors: 0, Drops: 0, Collisions: 0, Aged packets: 0, FIFO errors: 0, HS link CRC errors: 0, MTU errors: 0, Resource errors: 0 Egress queues: 8 supported, 4 in use Queue counters: Queued packets Transmitted packets Dropped packets 0 best-effort 0 0 0 1 expedited-fo 0 0 0 2 assured-forw 0 0 0 3 network-cont 0 0 0 Queue number: Mapped forwarding classes 0 best-effort 1 expedited-forwarding 2 assured-forwarding 3 network-control Active alarms : None Active defects : None PCS statistics Seconds Bit errors 0 Errored blocks 0 MAC statistics: Receive Transmit Total octets 128000 0 Total packets 1000 0 Unicast packets 1000 0 Broadcast packets 0 0 Multicast packets 0 0 CRC/Align errors 0 0 FIFO errors 0 0 MAC control frames 0 0 MAC pause frames 0 0 Oversized frames 0 Jabber frames 0 Fragment frames 0 VLAN tagged frames 0 Code violations 0 Filter statistics: Input packet count 1000 Input packet rejects 0 Input DA rejects 0 Input SA rejects 0 Output packet count 0 Output packet pad count 0 Output packet error count 0 CAM destination filters: 0, CAM source filters: 0 Packet Forwarding Engine configuration: Destination slot: 2 CoS information: Direction : Output CoS transmit queue Bandwidth Buffer Priority Limit % bps % usec 0 best-effort 95 9500000000 95 0 low none 3 network-control 5 500000000 5 0 low none Interface transmit statistics: Disabled Logical interface xe-2/1/0.0 (Index 83) (SNMP ifIndex 1677) (Generation 10082) Flags: SNMP-Traps 0x4004000 Encapsulation: ENET2 Traffic statistics: Input bytes : 110000 Output bytes : 0 Input packets: 1000 Output packets: 0 IPv6 transit statistics: Input bytes : 55000 Output bytes : 0 Input packets: 500 Output packets: 0 Local statistics: Input bytes : 55000 Output bytes : 0 Input packets: 500 Output packets: 0 Transit statistics: Input bytes : 55000 0 bps Output bytes : 0 0 bps Input packets: 500 0 pps Output packets: 0 0 pps IPv6 transit statistics: Input bytes : 55000 Output bytes : 0 Input packets: 500 Output packets: 0 Protocol inet6, MTU: 1500, Generation: 23739, Route table: 0 Addresses, Flags: Is-Preferred Is-Primary Destination: 2001:0db8:0a0b:12f0:0000:0000:0000/112, Local: 2001:0db8:0a0b:12f0:0000:0000:0000:0001 Generation: 506 Addresses, Flags: Is-Preferred Destination: Odb8::/64, Local: Odb8::21d:b5ff:fef8:6deb Protocol multiservice, MTU: Unlimited, Generation: 508 Generation: 23740, Route table: 0 Policer: Input: __default_arp_policer__ -
Cable Issues─Displays minutes affected by faulty cables in the network.
-
Negotiation Failed─Displays minutes affected by failure of auto-negotiation. Auto-negotiation allows two devices to automatically agree upon communication parameters like speed and duplex communication. If auto-negotiation is not complete, it could mean:
-
One or both routers might have auto-negotiation disabled in their configuration settings.
-
The Ethernet cable between the routers might be defective, preventing proper auto-negotiation.
-
There might be a misconfiguration on either router that is causing problems with auto-negotiation (for example, incorrect speed or duplex settings).
Failure of auto-negotiation and duplex conflicts can lead to latency on ports. Older models of routers might fail to achieve maximum speed and could operate at a lower link speed. This sub-classifier displays failure minutes that are caused by these issues.
-
-
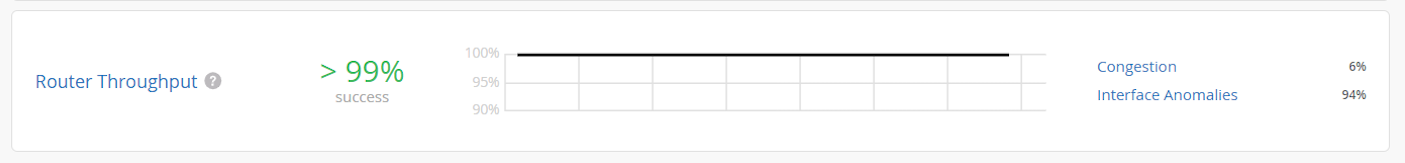
In Figure 1, the Router Throughput SLE met the service level goal for more than 99 percent of the time. Interface Anomalies contributed to degraded router throughput 94 percent of the time. Congestion contributed to degraded router throughput 6 percent of the time.
Analyze Router Throughput SLE Score
The Root Cause Analysis section provides visualizations for distribution, timeline, and statistics for service level failures and enables administrators to understand the impact of these issues.
Click the View Insights button to navigate to the Router Insights page which gives you fine-grained details of the router events. You can use the Router Insights page to correlate router events that could have impacted the Throughput SLE.
Click the Router Throughput widget to navigate to the root cause analysis page. Click a classifier to view its sub-classifiers.
-
Statistics─The Statistics tab displays the success rate of the Throughput SLE metric and the average throughput of a router. The Router Throughput Success Rate indicates the percentage of time the router throughput was optimal. It is calculated based on the duration for which the router throughput was optimal with respect to the total time the router was monitored.
For example, in Figure 2, the router throughput was optimal for more than 99 percent of the time and the router operated with degraded throughput for less than 1 percent of the total time that it was monitored.
Administrators can also view the distribution graph to understand the trend of throughput. You can view the Statistics tab only when you click the Router Throughput widget.
Figure 2: Root Cause Analysis of Router Throughput SLE Score 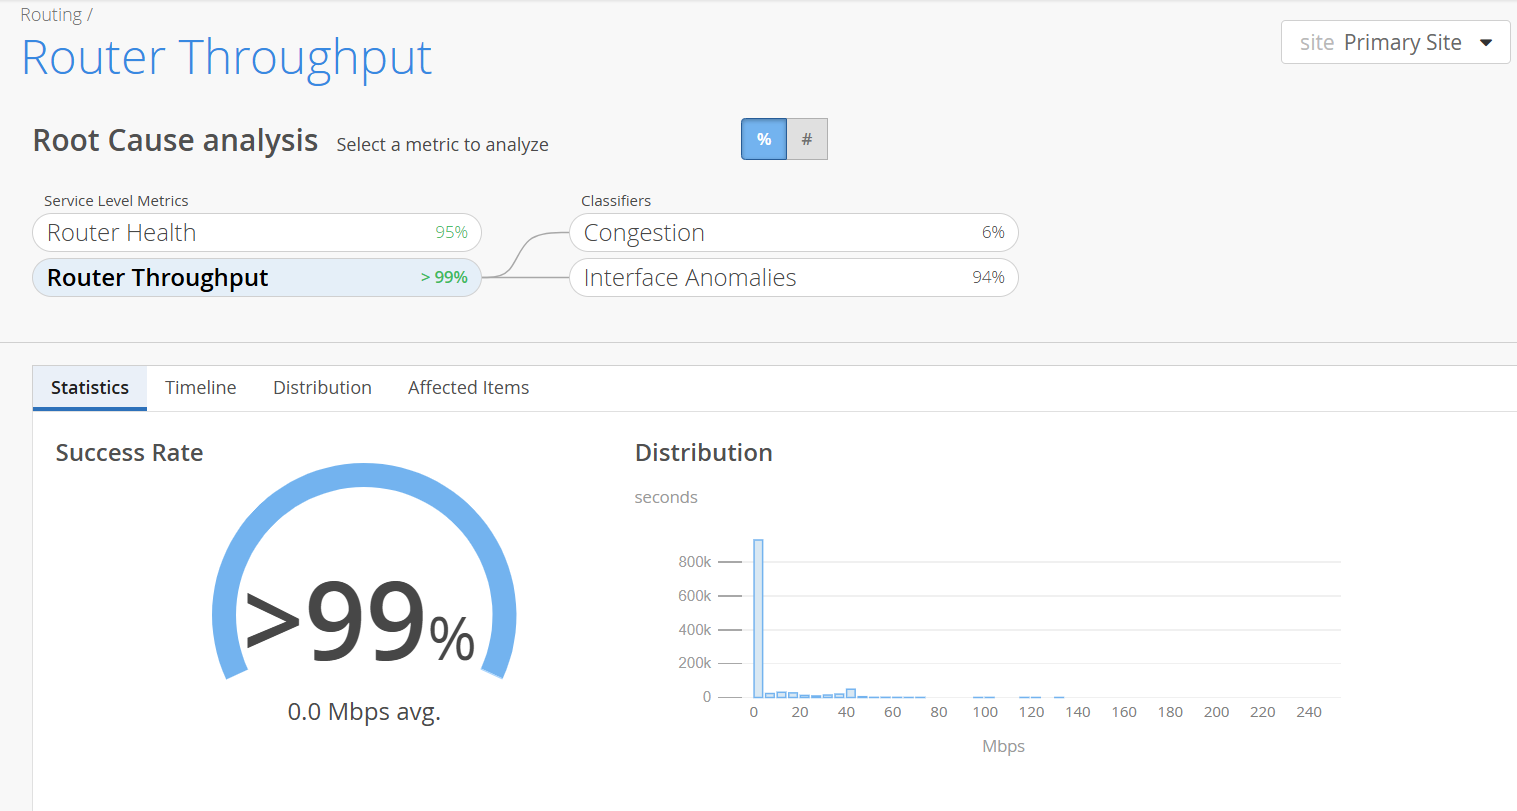
-
Timeline─The Timeline graph represents the trend of SLE failure minutes over a period. You can view the timeline graph for the SLE, every classifier and sub-classifier.
You can move the slider across the graph. As you hover over the graph, a pop-up on the slider displays the failure minutes of every classifier and sub-classifier during the period. Colored vertical bars on the graph indicate various sub-classifiers.
You can view the legend on the graph to interpret the plotted lines. Drag an area of interest to zoom in to the graph.
Figure 3: Timeline 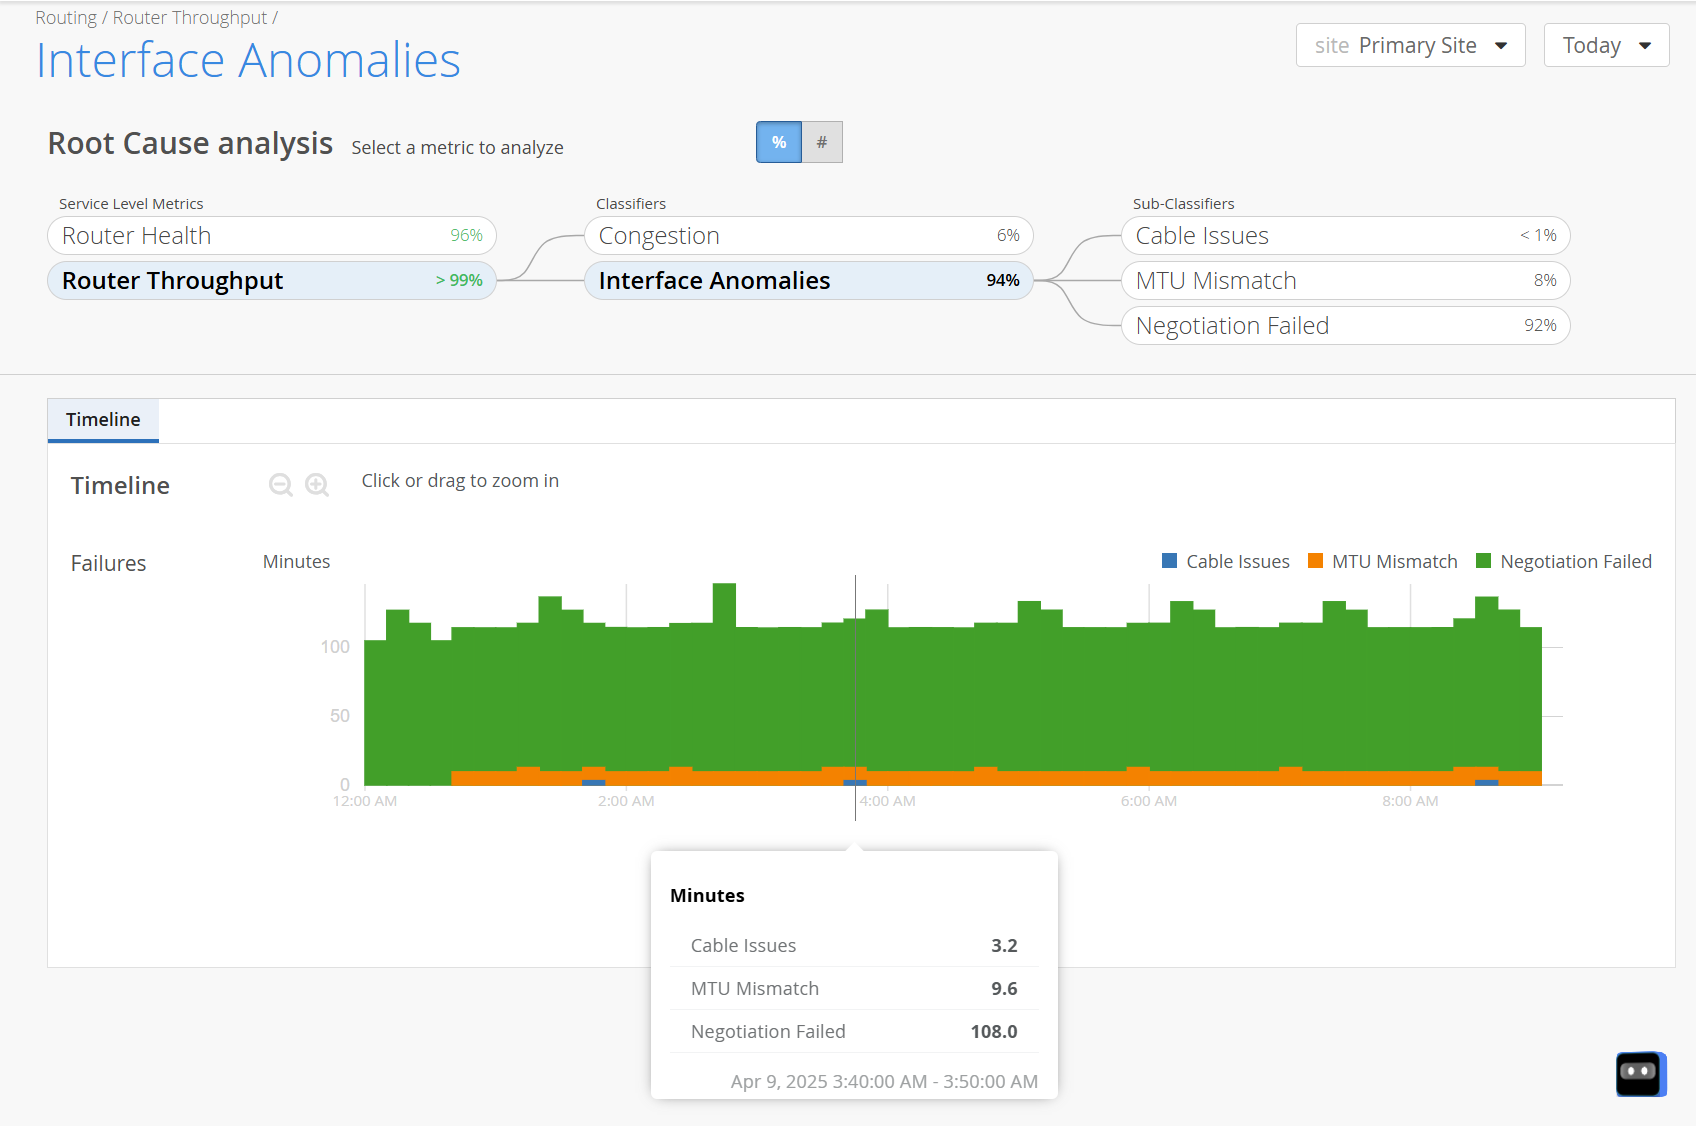
-
Distribution─Use the Distribution tab to analyze service level failures by various attributes such as overall impact, failure rate and anomaly. The distribution tab displays these attributes for all the routers and their interfaces. Click Interfaces to analyze the attributes at an interface level. Click Routers to analyze service level failures by various attributes at router level.
You can sort the columns in the table by the column header. Click any column header to sort its entries. By default, the attributes are sorted by most anomalous.
For field descriptions, see Table 1.
Table 1: Fields on the Distribution Tab Fields
Description
Name
Name of the interface.
Router Name
Name of the router.
Overall Impact
Interfaces tab─Contribution (in percentage) of an interface's failure minutes to the total failure minutes.
Routers tab─Contribution (in percentage) of a router’s failure minutes to the total failure minutes of all the routers at a specific site.
This helps you identify routers with disproportionately long durations of failure.
Failure Rate
Interfaces tab─Interface failure rate (in percentage).
Failure rate of an interface is a measure of failure minutes of an interface with respect to the total time the router was monitored.
Routers tab─Router failure rate (in percentage).
Failure rate of a router is a measure of failure minutes of a router with respect to the total time the router was monitored.
Anomaly
Interfaces tab─Correlation metric that compares an interface's individual failure rate to the average failure rate across the site.
Routers tab─A correlation metric that compares a router’s individual failure rate to the average failure rate across the site.
It helps you identify routers that are underperforming or outperforming relative to other routers at a site.
The correlation coefficients are:
-
Anomaly > 1─Interface or router has a higher failure rate than the network average (underperforming).
-
Anomaly < 1─Interface or router has a lower failure rate than the site average. This means that the interface or router is healthier than the network average.
-
Anomaly = 1─Interface or router is performing exactly in line with the network average.
Figure 4: Distribution > Interfaces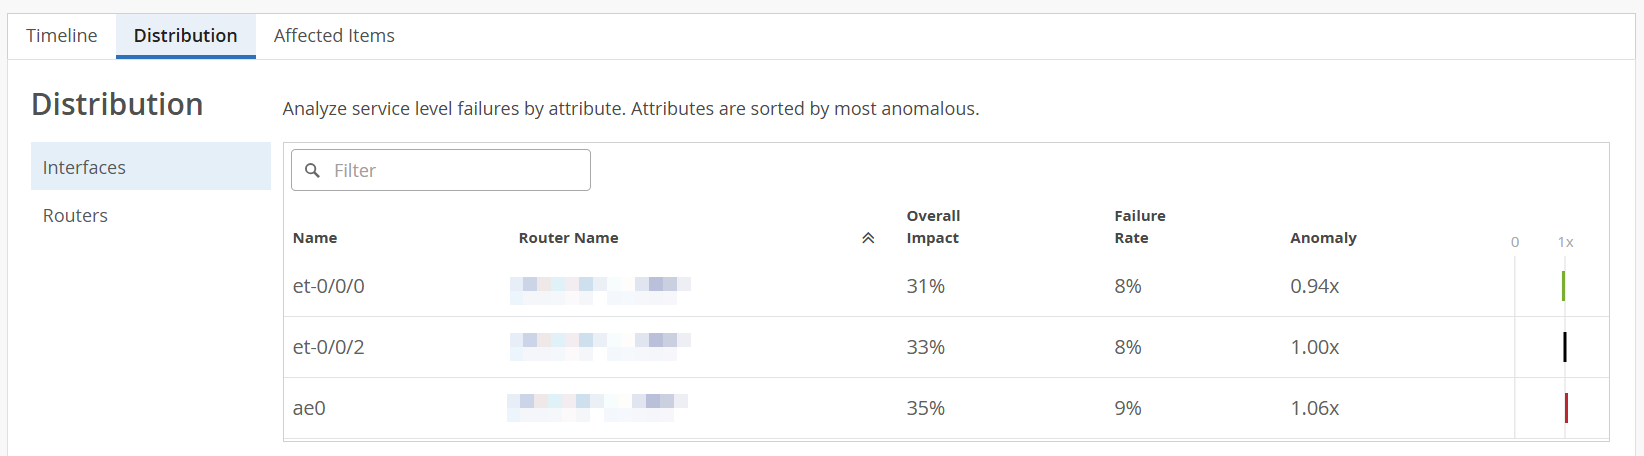 Figure 5: Distribution > Routers
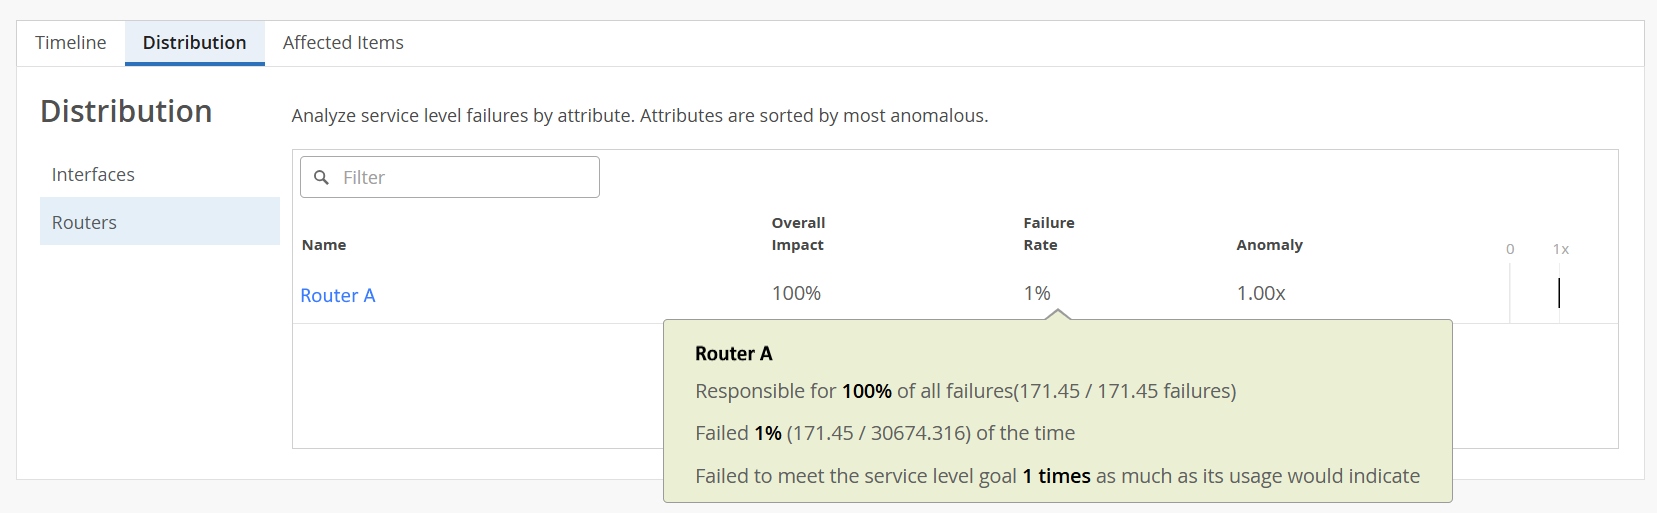
For example, in Figure 5, you can see that:
-
Router A failed to meet service level goals for a total of 171.45 minutes, all of which were due to congestion. This means congestion accounted for 100 percent of the service level violations for Router A.
-
Router A contributed 171.45 minutes of failure during the 30674.316 minutes that it was monitored, resulting in a failure rate of 1 percent.
-
Router A has an anomaly factor of one indicating that it performed exactly in line with the network average.
In router-specific view, overall impact is the contribution (in percentage) of an interface's (or queue's) failure minutes to the total failure minutes of all the interfaces (or queues) of the router.
For example, in Figure 6, you can see that, Queue 0 on interface xe-0/0/5:0 of router A contributed 898.667 minutes of failure during the 898.667 minutes that it was monitored, resulting in a failure rate of 100 percent.
Figure 6: Router-Specific View: Distribution > Queues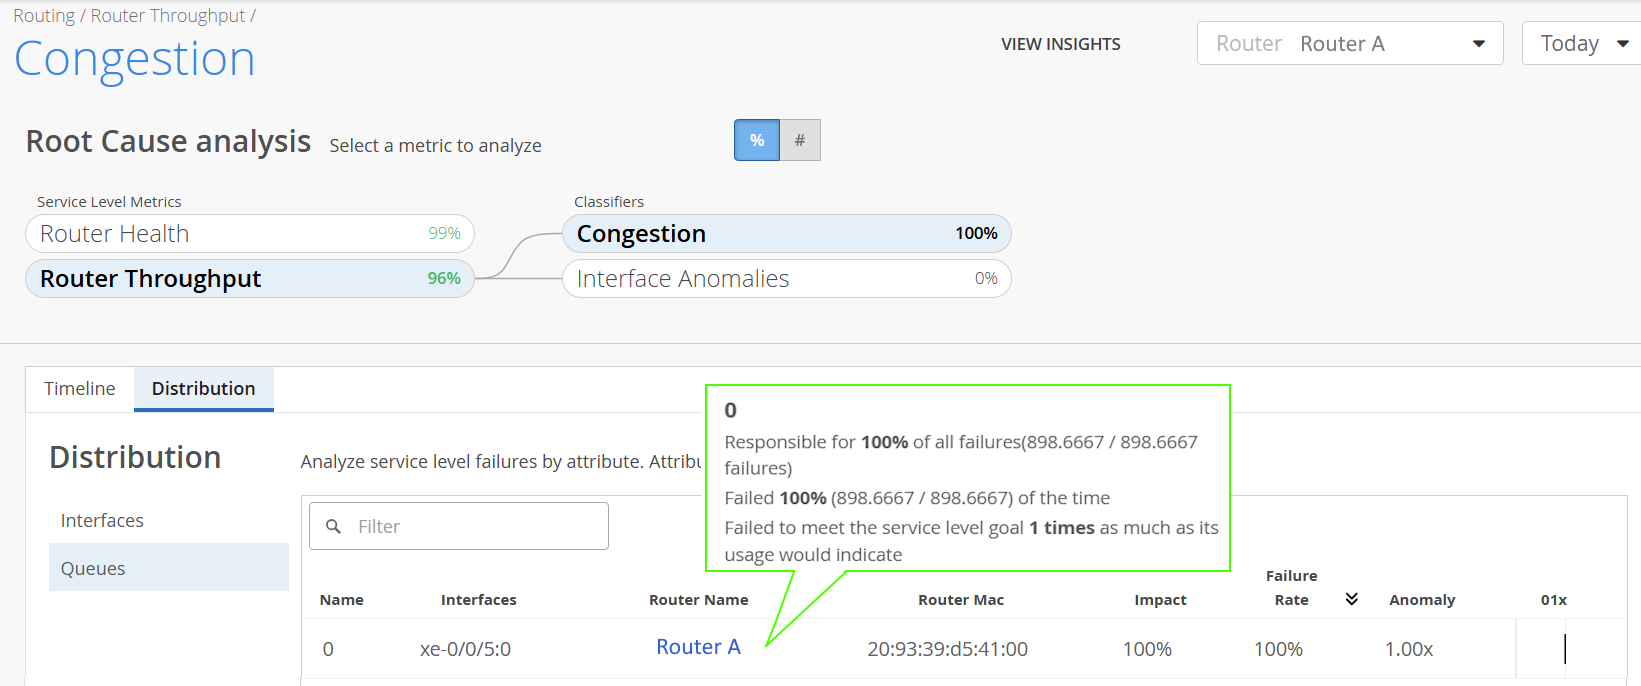
-
-
Affected Items─The Affected items tab lists all routers, with their interfaces and output queues that failed to meet the service level goal. From this tab, you can view affected routers' details such as MAC address, model number, failure rate and so on. The affected item tab also displays the count of routers and output queues that failed to meet the service level goal.
Click Queues to view the specific queues and interfaces that failed to meet the service level goal. Click Routers to view specific routers that failed to meet the service level goal.
You can sort the columns in the table by the column header. Click any column header to sort its entries. Table 2 describes the fields on the Affected Items tab.
Click a router to view the Root Cause Analysis section for a specific router. The Root Cause Analysis section now displays the SLE metrics for the router. Click the View Insights tab to navigate to the Router Insights page. Use the Router Charts, the Router Interface Queues, and the BGP summary information of the router to debug the issues further.
Note: You can access the Affected Items tab only in the site-specific view.Table 2: Fields on Affected Items Tab Fields
Description
Name
Name of the Router.
Queue
Number of the CoS queue (0 through 7).
Interfaces
List of interfaces that failed to meet the service-level goal.
MAC
MAC address of the router.
Overall Impact
Routers tab─Contribution (in percentage) of a router’s failure minutes to the total failure minutes of all the routers at a specific site.
This helps you identify routers with disproportionately long durations of failure.
Queues tab─Contribution (in percentage) of a queue's failure minutes to the total failure minutes.
Note: The Queues tab displays data only for the Congestion classifier.Failure Rate
Routers tab─Router failure rate (in percentage).
Failure rate is a measure of the failure minutes of a router with respect to the total monitored time.
Queues tab─Queue failure rate (in percentage).
Failure rate is a measure of the failure minutes of a specific queue with respect to the total time the interfaces were monitored.
Note: The Queues tab displays data only for the Congestion classifier.Model
Router model name.
Version
Version of Junos OS or Junos OS Evolved running on the router.
Figure 7: Affected Items > Routers 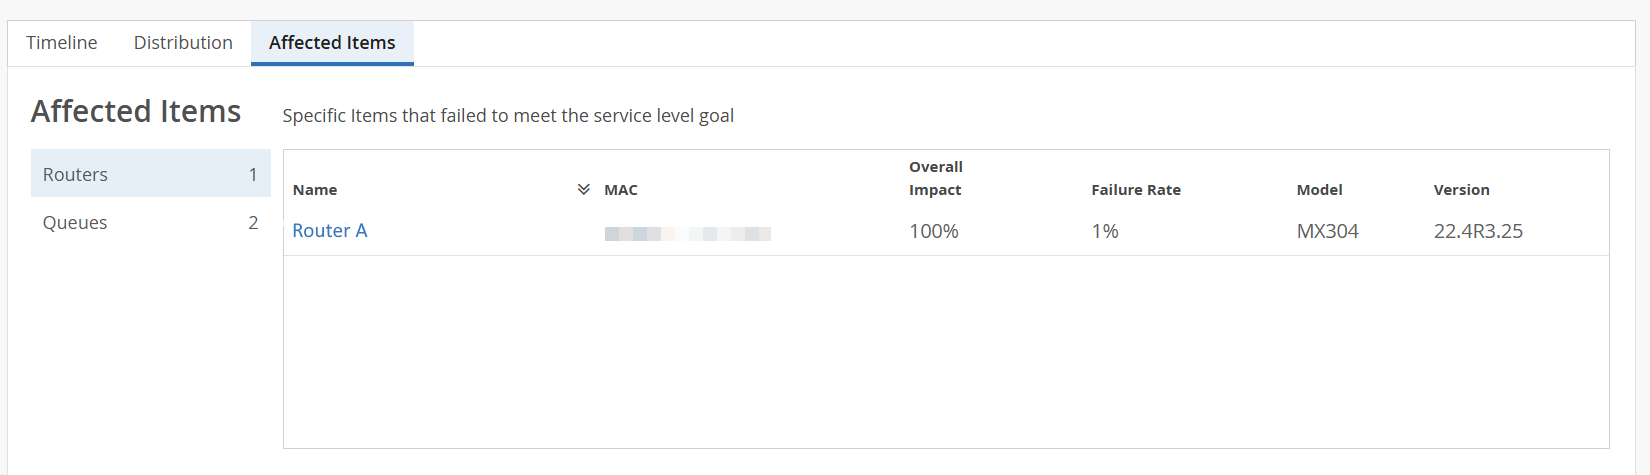 Figure 8: Affected Items > Queues
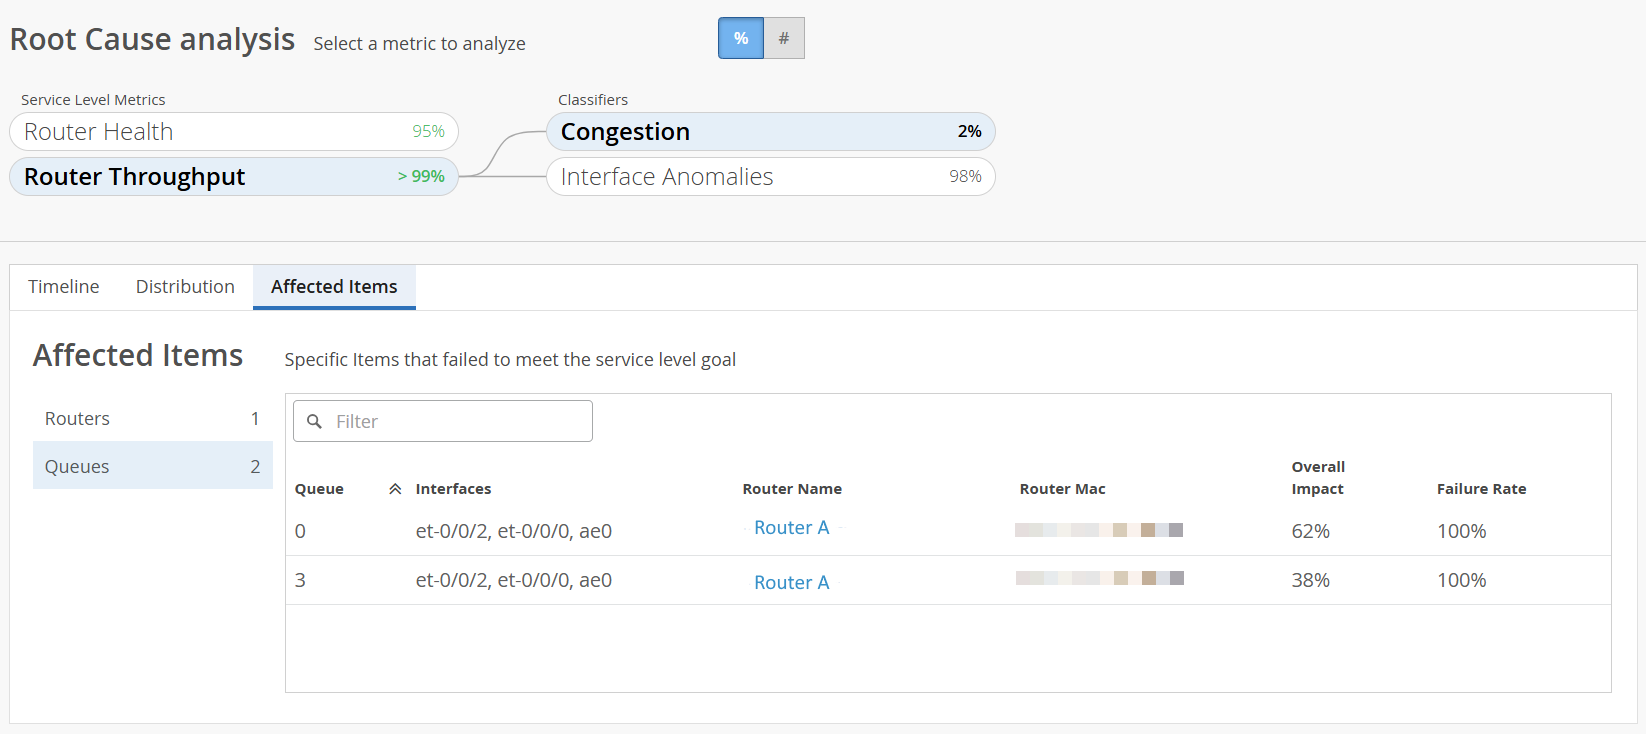
For example, in Figure 8, you can see that:
-
CoS queues 0 and 3 on the interfaces et-0/0/2, et-0/0/0 and, ae0 of Router A have the most number of tail drops.
-
Queue 0 of Router A contributed 62 percent of the total failure minutes across all queues.
-
Queue 3 of Router A contributed 38 percent of the total failure minutes across all queues.
-