Congestion
Use the Marvis Actions dashboard to assess link utilization and evaluate queue performance.
Marvis continuously monitors interface bandwidth utilization and queue performance to detect congestion. Marvis evaluates link performance over a seven-day period. It recommends bandwidth upgrades if bandwidth capacity thresholds are exceeded. Marvis also predicts potential congestion levels, and alerts users with recommendations, ensuring optimal network performance by forecasting congestion and facilitating timely bandwidth upgrades. Furthermore, Marvis evaluates queue performance to determine where queue optimization can minimize congestion. Administrators can use these actionable insights to reduce congestion and improve data flow efficiency.
Marvis reports a congestion event when a link's bandwidth utilization exceeds the configured threshold of 70 percent for seven or more days or if an interface drops packets.
To view the Congestion event, click Marvis > Router > Congestion.
Bandwidth Utilization
High bandwidth utilization occurs when an interface or a link is nearing its capacity. Consistently high-bandwidth utilization might lead to congestion and degraded network performance. Large file transfers, backups, streaming services, peak usage time (business hours or scheduled tasks), and increased control traffic are some of the factors that increase the bandwidth utilization of an interface. A consistently high bandwidth utilization indicates possible congestion and signals the need for a bandwidth upgrade. Therefore, early detection of these utilization trends is critical to preventing performance issues such as packet drops, latency, and jitter.
To analyze an interface's bandwidth usage, Marvis collects bandwidth-utilization samples at short, periodic intervals for an hour and calculates the hourly average. Similarly, samples are collected for each hour throughout the day. For every hour, Marvis records the average bandwidth utilization. At the end of the day, the maximum hourly average bandwidth utilization is recorded.
Juniper Routing Assurance leverages a seven-day analysis period to assess the performance of a link. Marvis generates a congestion event when a link's bandwidth utilization exceeds the configured threshold of 70 percent for seven or more days. Marvis also recommends a bandwidth upgrade to ensure optimal performance.
The use of maximum hourly average instead of a simple daily average is insightful for proactive network capacity planning and troubleshooting performance issues. The goal of capacity planning is to avoid network performance issues. You must scale the link capacity to handle the predictable peak load. By monitoring the maximum hourly average bandwidth utilization that exceeds the threshold, you can determine the additional bandwidth that the interface requires to prevent congestion during peak traffic periods.
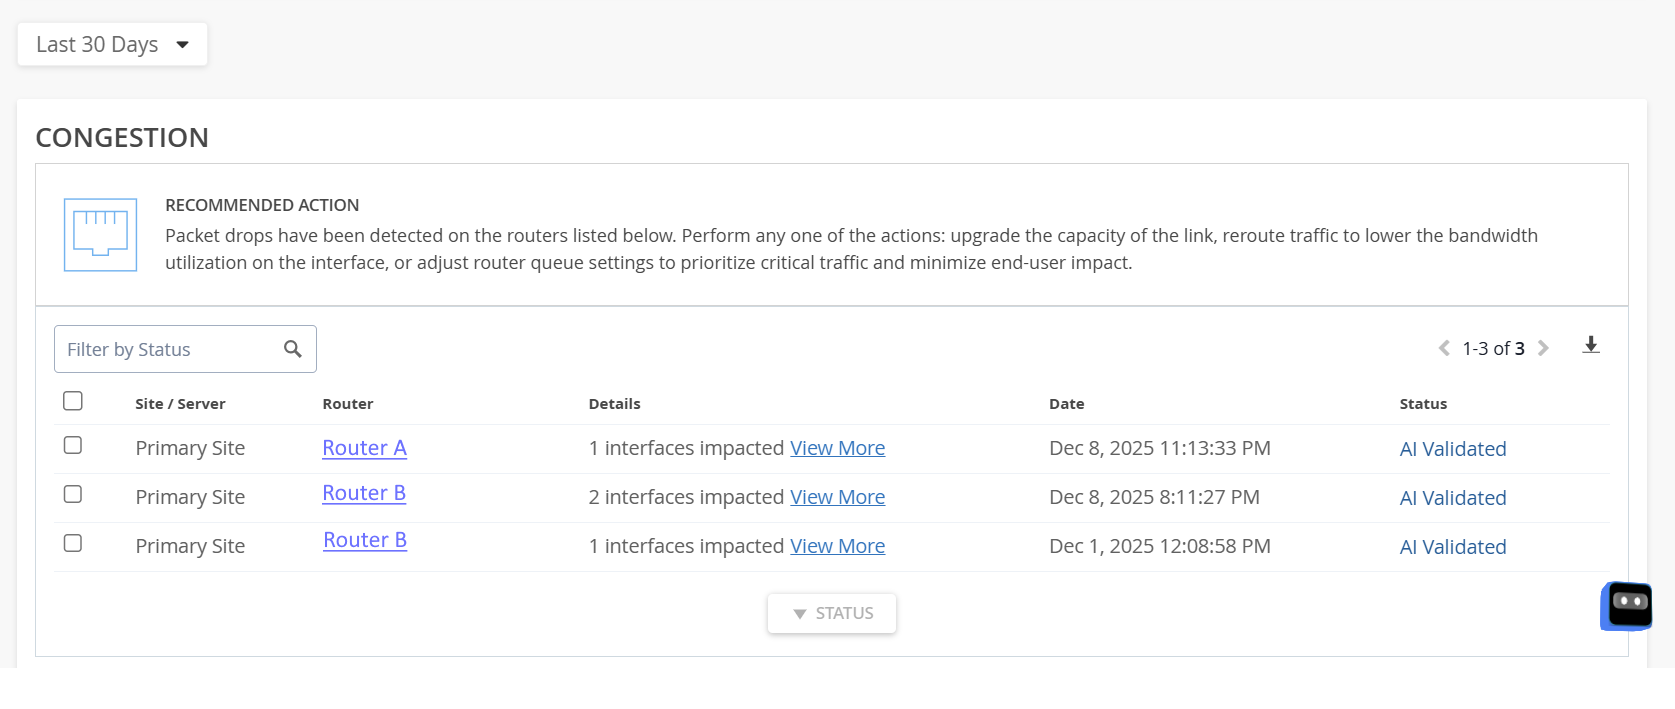
The Congestion event provides details such as the site, router, date and time when the event was recorded. Click View More to view the list of interfaces that have high bandwidth utilization.
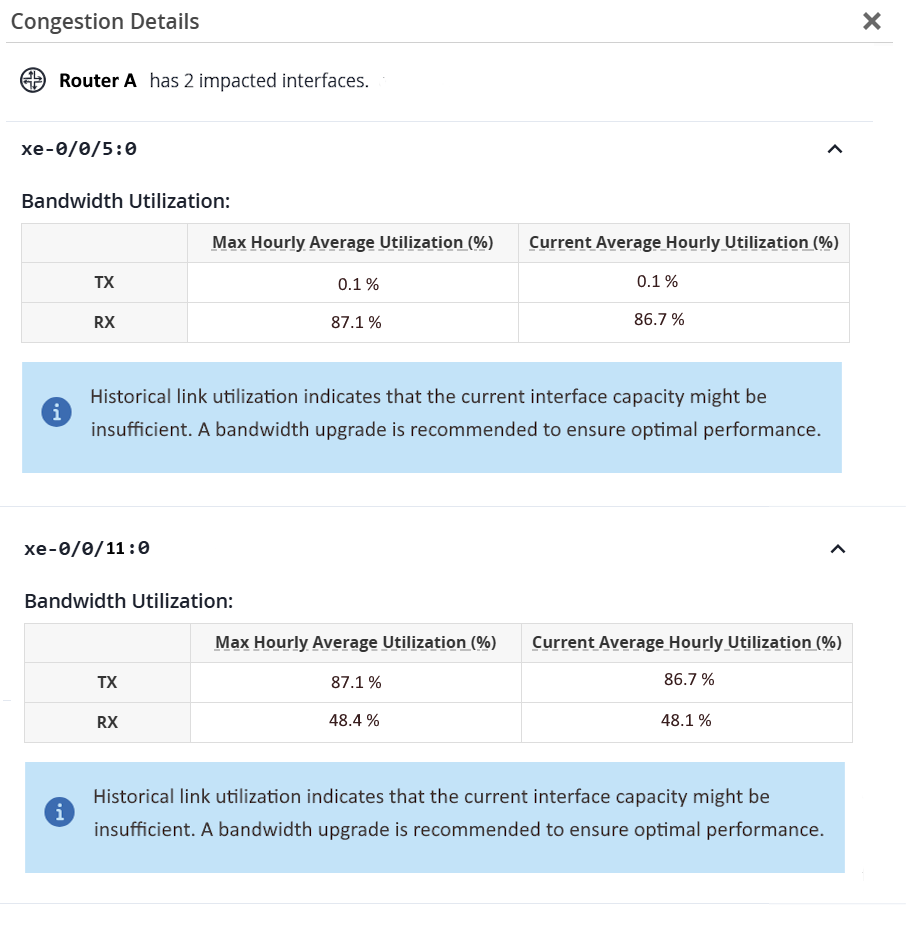
In Figure 2, Marvis has reported congestion event on two interfaces of router A:
-
xe-0/0/5:0─The current average hourly bandwidth utilization recorded on the receive (Rx) link of the xe-0/0/5:0 interface during the previous day is 86.7 percent. The highest hourly average bandwidth utilization recorded on the link since the issue was first detected is 87.1 percent. Since the link's current average hourly bandwidth utilization exceeds the configured threshold of 70 percent, Marvis recommends administrators to upgrade the bandwidth to ensure optimal performance.
-
xe-0/0/11:0─The current average hourly bandwidth utilization recorded on the transmit (Tx) link of the xe-0/0/11:0 interface during the previous day is 86.7 percent. The highest hourly average bandwidth utilization recorded on the link since the issue was first detected is 87.1 percent. Since the link's current average hourly bandwidth utilization exceeds the configured threshold of 70 percent, Marvis recommends administrators to upgrade the bandwidth to ensure optimal performance.
See Table 1 for field descriptions.
Packet Drops
Congestion in a network occurs due to several factors, including traffic bursts, speed mismatches between links, and insufficient buffer depth. When buffers become full due to congestion, some packets must be dropped to avoid network delays. Marvis detects and reports such packet drop events. Marvis reports a congestion event when an interface drops packets for a continuous duration of 60 minutes.
The Congestion event provides details such as the queue number, priority, forwarding class and the number of packets that were dropped since the issue was first detected. Marvis reports the top three affected queues, sorted by their QoS priority level.
When an interface queue drops packets, Marvis recommends administrators to optimize the queue by adjusting the queue's QoS settings. Optimizing the output queue properties can significantly reduce the number of drops. Output queue properties include the amount of interface bandwidth assigned to the queue and the size of the memory buffer allocated for storing packets. You can configure the output queue properties from the router's CLI.
Click the router name to navigate to the router Insights page to view the Total Interfaces Drop Packets Rate graph, Queued or Transmitted Bytes Rate graph and Depth Percentage graph for the interval reported by the event. You can correlate the data in these graphs to specific congestion events that might have occurred during the same interval.
You can mark the status of an event as In Progress to indicate that an administrator is working on resolving the event. Resolving a specific event will only resolve that occurrence of the event and will not resolve future occurrences of the same event. If a congestion event has occurred and remains inactive for seven days, Marvis moves its status to AI Validated.
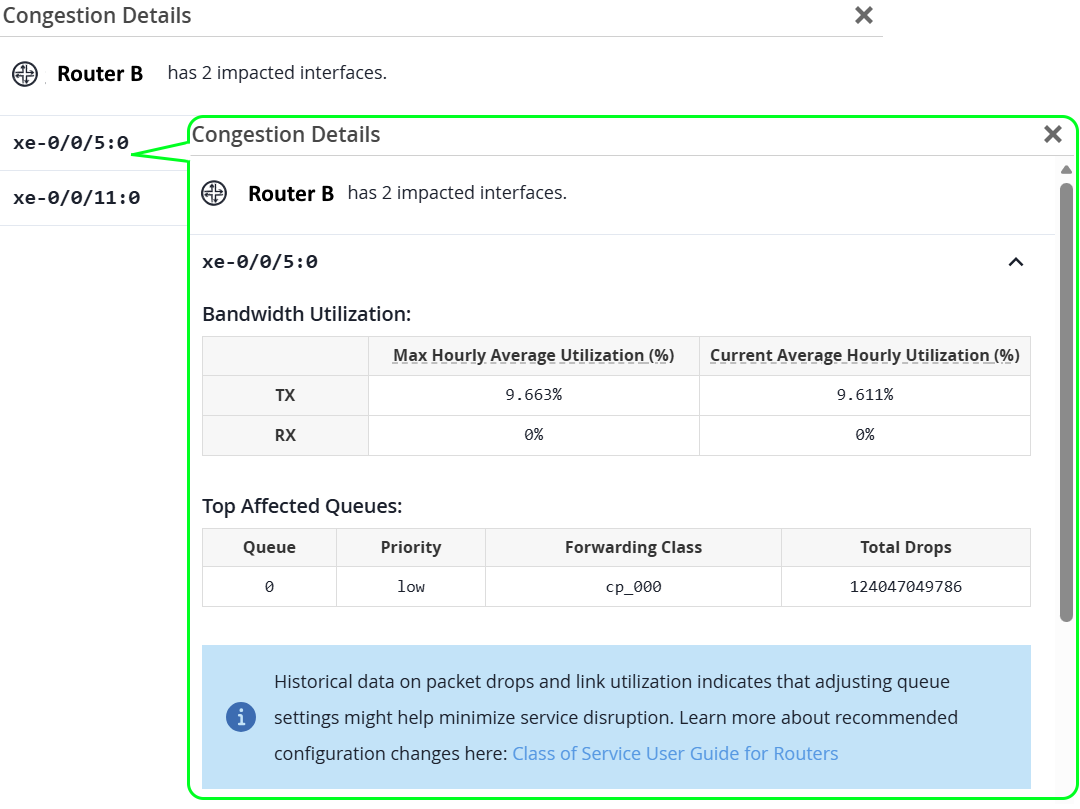
In Figure 3, you can see that Marvis has detected packet drops on Router B's interface. Queue 0 of the interface xe-0/0/5:0 has dropped a total of 124047049786 packets since the issue was first detected. Since the hourly average bandwidth utilization of the interface is below the threshold, Marvis recommends administrators to only adjust the queue settings to prioritize critical traffic.
For field descriptions, see Table 1.
Understanding Predictive Bandwidth Upgrade Recommendations
Marvis combines traffic monitoring and predictive analytics to identify links that are likely to experience congestion and provides proactive recommendations for bandwidth upgrades. By collecting and processing at least seven days of data, Marvis identifies traffic patterns that suggest when network link utilization is likely to approach critical thresholds of 80 percent and 90 percent. Marvis then generates recommendations, enabling administrators to plan necessary network upgrades before congestion impacts network performance.
Marvis focuses on the peak-hour for every interface, ensuring predictions are based on the most relevant data. The predictive model executes its prediction logic under the following conditions:
-
The rate of change of bandwidth utilization (utilization trend) is positive─Rate of increase in bandwidth utilization must remain above zero, suggesting a future congestion.
-
The normalized bandwidth utilization shows a daily increasing trend─Bandwidth utilization must consistently rise each day.
Once the above conditions are met, the predictive algorithm estimates when congestion levels might reach 80 percent and 90 percent. This estimation considers historical data, current trends, and growth rates to forecast future bandwidth utilization levels.
Marvis issues the following alerts recommending bandwidth upgrade:
-
Critical alert when the bandwidth utilization is projected to reach the 90 percent threshold within the next 60 days, allowing administrators to prioritize future bandwidth upgrades.
-
Warning alert when the bandwidth utilization is projected to reach the 80 percent threshold within the next 60 days.
If the bandwidth utilization is projected to reach 90 percent capacity in more than 60 days, Marvis falls back to notifying the administrators about the 80 percent threshold if the utilization is projected to occur within 60 days. If neither threshold is expected to be reached within 60 days, Marvis notifies administrators to upgrade the interface's bandwidth if the utilization remains at 70 percent for seven consecutive days, addressing existing congestion issues.
This predictive functionality ensures informed decision-making based on accurate forecasts, optimizing bandwidth allocation and minimizing the risk of network congestion. Administrators can plan bandwidth upgrades proactively for interfaces nearing high bandwidth utilization thresholds.
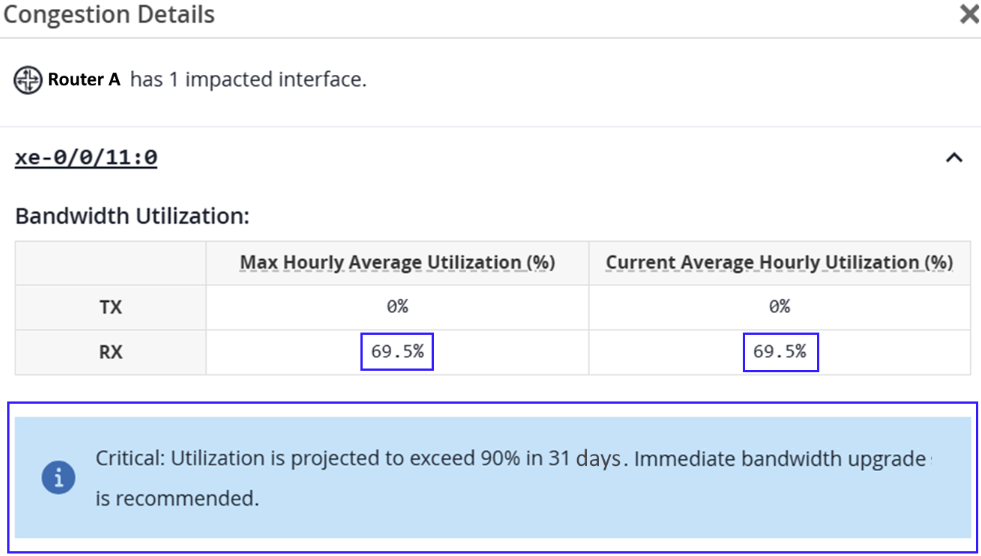
In Figure 4, although the current bandwidth utilization is within the threshold, Marvis has predicted the utilization to exceed 90 percent in the next 31 days.
Benefits of Predictive Bandwidth Upgrade Recommendations
-
Proactive congestion prevention─Marvis identifies interfaces that are likely to hit bandwidth utilization thresholds of 80 percent and 90 percent before congestion occurs, enabling early intervention instead of reactive troubleshooting.
-
Improved network stability─Reduces the likelihood of packet drops and congestion by addressing bandwidth constraints before congestion occurs.
-
Informed capacity planning─Provides data-driven forecasts based on historical traffic patterns, helping administrators effectively plan bandwidth upgrades.
-
Optimized resource allocation─Enables prioritization of bandwidth upgrades only where required, avoiding unnecessary infrastructure investments while ensuring critical links are appropriately scaled.
-
Enhanced visibility into future network behavior─Offers predictive insights into future network utilization with real-time and historical performance monitoring.
Congestion Event Evaluation Criteria
Marvis recommends a bandwidth upgrade or queue optimization based on the occurrence patterns of high-bandwidth utilization and packet drops. Marvis analyzes bandwidth utilization and packet drops as two independent events.
-
If an interface’s bandwidth utilization exceeds the 70 percent threshold consistently for seven days, Marvis recommends a bandwidth upgrade.
-
If an interface queue drops packets at any time within the seven-day window period, Marvis recommends administrators to optimize the queue by adjusting the queue's QoS settings.
-
If an interface’s bandwidth utilization exceeds the 70 percent threshold consistently and its queue drops packets simultaneously, Marvis recommends that administrators upgrade the bandwidth.
-
When the predictive model forecasts that an interface’s bandwidth utilization could hit 90 percent within the next 60 days, Marvis issues a Critical recommendation alert to upgrade the bandwidth.
-
When the predictive model forecasts that an interface’s bandwidth utilization could hit 80 percent within the next 60 days, Marvis issues a Warning recommendation alert to upgrade the bandwidth.
- Bandwidth utilization remians below the defined threshold of 70 percent throughout the evaluation period, and
- Packet drops are not detected on the interface.
|
Field |
Description |
|---|---|
|
Max Hourly Average Utilization |
TX─The highest hourly average bandwidth utilization (in percentage) recorded on the transmit (Tx) link since the issue was first detected. RX─The highest hourly average bandwidth utilization (in percentage) recorded on the receive (Rx) link since the issue was first detected. |
|
Current Hourly Average Utilization |
TX─The highest hourly average bandwidth utilization (in percentage) recorded on the transmit (Tx) link during the previous day. RX─The highest hourly average bandwidth utilization (in percentage) recorded on the receive (Rx) link during the previous day. |
|
Queue |
Number of the CoS queue (0 through 7). |
|
Priority |
Priority of the CoS queue. |
|
Forwarding Class |
Name of the forwarding class. |
|
Packets Dropped |
Number of packets dropped in the transmit (Tx) link's queue since the issue was first detected. |