Automatically Monitor Device Health and Detect Anomalies
Use this topic to understand how Paragon Automation automatically monitors device health and detects anomalies, and how you can use the GUI to view anomalies related to device health.
Device Health Monitoring and Anomaly Detection Overview
-
Device Health and anomaly detection is a beta feature in this release.
-
To monitor device health, you must enable AI/ML (
install-aiml) and device health monitoring (enable-device-health) when you install the Paragon Automation cluster. For more information, see Deploy the Cluster.
To ascertain the health of a network, you need to monitor the health of the devices in the network. Paragon Automation uses AI/ML (artificial intelligence [AI] and machine learning [ML]) techniques to automatically monitor Key Performance Indicators (KPIs) related to a device's health, and automatically detects any anomalies that occur. Paragon Automation also performs a root-cause analysis (RCA) of device temperature anomalies when the device is in operation.
The periodic monitoring of the device's health status and the timely detection of device health anomalies enables operators to take action and minimize the impact of any issues that occur
Paragon Automation monitors device health in the following scenarios:
-
During device onboarding—When a device is being onboarded, Paragon Automation monitors the device's health and generates an alert if any anomalies occur.
When a device is being onboarded, if other devices of the same model that were previously onboarded exist, Paragon Automation compares the data to detect anomalies. However, if a device of a particular model is being onboarded for the first time, then the efficacy of the anomaly detection is limited because of lack of historical data.
-
During device operation—After the device is onboarded successfully and is managed, Paragon Automation continuously monitors the KPIs related to device heath. For each KPI of each device, Paragon Automation monitors the KPI, forecasts the range, and detects any anomalies that occur. During device operation, Paragon Automation detects device health anomalies (within 30 minutes) based on historical data for that device and the forecasted range.
In the validation phase, the MAPE score for the ML models used in device health monitoring was observed as varying between 2.5 to 6.5.
RCA of Temperature Anomalies
When a device is in operation, Paragon Automation provides RCA for issues related to the Routing Engine temperature and Routing Engine CPU temperature. Paragon Automation analyzes the different attributes (CPU utilization percentage, fan RPM percentage, and inlet temperature) that could cause a temperature issue. Paragon Automation also compares the device's temperature to an expected range. Based on the analysis and comparison, Paragon Automation provides an alert, an expected reason for the issue, and details on the events that might have caused the issue. Figure 1 displays a sample page showing the RCA logs for an anomaly in the Routing Engine temperature.
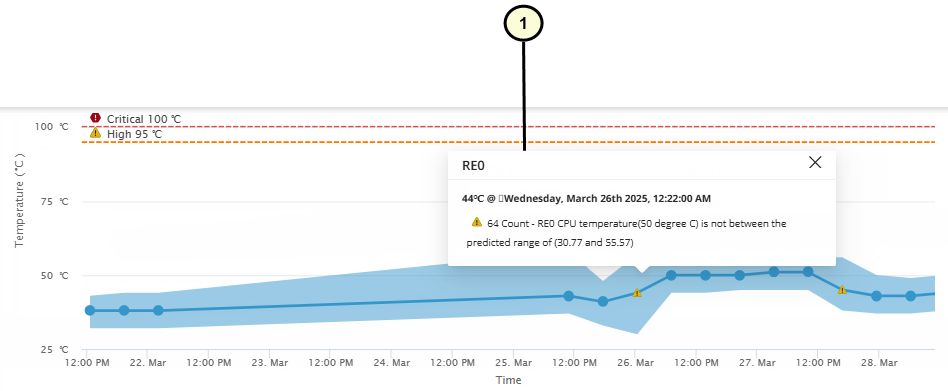
1 — Device Temperature RCA Details |
Device Health KPIs
Table 1 displays the device health KPIs that Paragon Automation monitors for each device.
| KPI | Component | Parameters |
|---|---|---|
| CPU |
Routing Engine Line card |
CPU Utilization Percentage (%) |
| Memory |
Routing Engine Line card |
Memory Utilization Percentage (%) |
| Fan | Not applicable |
RPM Percentage (%) |
| Temperature |
|
Current temperature |
Device Health Anomalies in the GUI
You can view and monitor the device health anomalies for a device on the Hardware accordion of the Device-Name page.
To view and monitor device health anomalies:
For more information on the hardware accordion, see Hardware Data and Test Results.
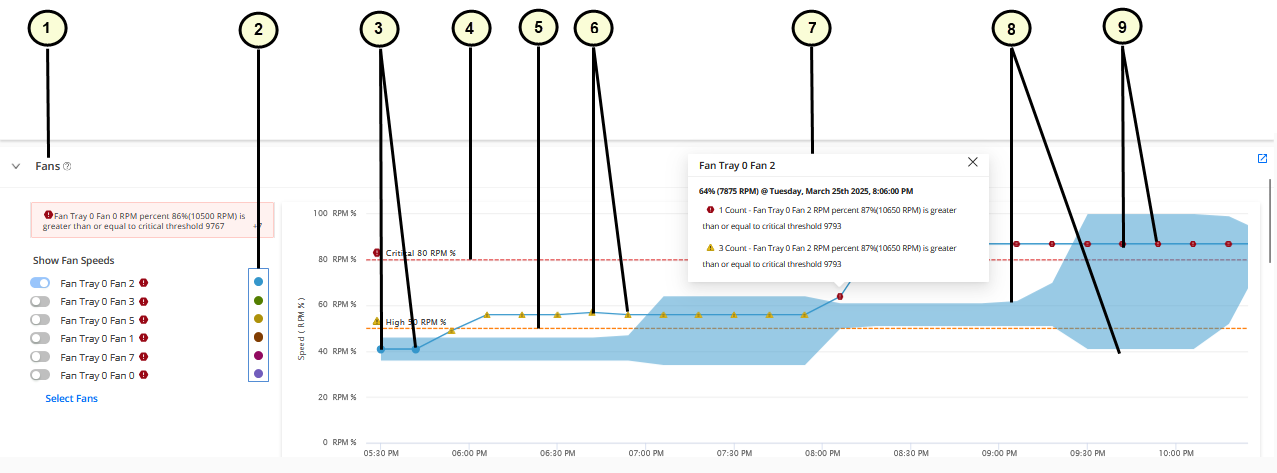
1 — KPI | 6 — Triangle icons indicating an anomaly when the higher threshold is breached. |
2 — Legend showing the colors for different sub-components used in the graphs | 7 — Pop-up showing details of device health anomaly |
3 — Circle icons indicating that the KPI is normal | 8 — Upper and lower boundaries (dynamic thresholds) for the data displayed in the graph |
4 — Critical threshold marker | 9 — Hexagon icons indicating an anomaly when the critical threshold is breached. |
5 — High threshold marker |