ON THIS PAGE
Hardware Data and Test Results
This topic provides information about the results of the tests that Paragon Automation executes to determine the health and functioning of the device hardware.
Overview
The Hardware accordion displays the hardware data and results of the tests that Paragon Automation executes. These tests determine the health and functioning of a device hardware. You can also view events (alerts and alarms), if any, for the device on the Hardware accordion and on the Hardware Details for Device-Name page.
To access the Hardware accordion, navigate to the Observability > Health > Troubleshoot Devices page. Click a device name to access the Device-Name page. Click the Hardware (accordion) in the Overview tab.
The top-right corner of the accordion displays the overall health of the device's hardware. The various states are:
-
Healthy—The device's hardware (PSUs, fans, line cards, CPU, and memory) and temperature (of the Routing Engine, Routing Engine CPU, PSM, and chassis) is healthy.
-
Being Monitored—The health of the device is being monitored.
-
Action Needed—The device's hardware and temperature have issues that you must address.
-
Urgent Action Needed—The device's hardware and temperature have issues that must be addressed immediately.
Table 1 lists the results of the hardware tests.
| Field | Description |
|---|---|
|
PSUs |
Total number of power supply units (PSUs) present in the device and the total number of unhealthy PSUs. A PSU is marked unhealthy when:
Click the link next to PSUs to view the threshold limits and the performance of the PSUs for a week, a day, 3 hours, 1 hour, 30 minutes, or a custom time period. See Hardware Details for Device-Name Page for more information. |
|
Fans |
Total number of fans present in the device and the total number of unhealthy fans. A fan is marked unhealthy when the RPM exceeds the high and low threshold limits. Click the link next to Fans to view the threshold limits and the performance of the fans for a week, a day, 3 hours, 1 hour, 30 minutes, or a custom time period. See Hardware Details for Device-Name Page for more information. |
|
Linecards |
Total number of line cards in the device and the total number of unhealthy line cards. A line card is marked unhealthy when the KPIs defined for that line card is not met. Click the link next to Linecards to view the threshold limits and the performance of the line cards for a week, a day, 3 hours, 1 hour, 30 minutes, or a custom time period. See Hardware Details for Device-Name Page for more information. Note:
Line card charts are not available on some ACX Series, and MX Series devices as the flexible PIC concentrator (FPC) fields are not supported on these devices. See Table 3 for more information. |
|
CPU |
Total number of CPUs in the device and the total number of unhealthy CPUs. A CPU is marked unhealthy when the CPU utilization exceeds the threshold limit. Click the link next to CPU to view the threshold limits and the performance of the CPU for a week, a day, 3 hours, 1 hour, 30 minutes, or a custom time period. See Hardware Details for Device-Name Page for more information. |
|
Memory |
Memory utilized by Routing Engines and line cards, and the total number of unhealthy memory units. Device memory is marked unhealthy when the memory runs low or is insufficient. Click the link next to Memory to view the threshold limits and memory utilization of Routing Engines for a week, a day, 3 hours, 1 hour, 30 minutes, or a custom time period. See Hardware Details for Device-Name Page for more information. |
|
Temperature |
Routing Engine temperature, PSM temperature, Routing Engine CPU temperature, line card temperature, and chassis temperature in degree Celsius. Temperature is marked unhealthy when the temperature exceeds the high and low threshold limits. Click the link next to Temperature to view more information on temperature utilization, which is displayed over a period of a week, a day, 3 hours, 1 hour, 30 minutes, or a custom time period. See Hardware Details for Device-Name Page for more information. |
|
Authenticity |
Authenticity of the device hardware. Genuine Juniper Hardware is displayed if the device is a Juniper device. |
|
End of Support |
End of support information of the device. |
|
SIRT Advisories |
Total number of Security Incident Resource Team (SIRT) advisories for the device and the software running on the device. Click the link next to SIRT Advisories to view the list of vulnerabilities that affect the device, and the software installed on the device, which is displayed on the Trust > Vulnerabilities page. |
|
Relevant Events |
Displays two issues or anomalies related to the hardware in order of severity. Hover over View Details to view more information about an issue in a pop-up. Click View All Relevant Events to view all hardware issues present on the device, on the Events for Device-Name page. You can view relevant events for the past seven days. |
|
Show LEDs, Ports & Cables on Chassis |
Click the Show LEDs, Ports, Cables on Chassis toggle button to view or hide the device chassis. Hover over the CPU, memory, fans, power, and temperature icons to view a snapshot of the performance of each component. Click the Port Status drop-down list to view:
You can zoom in, zoom out, and reset a device chassis. |
Hardware Details for Device-Name Page
To access the Hardware Details on the Paragon Automation GUI, click Observability > Health > Troubleshoot Devices > Device-Name > Overview > Hardware (accordion) > data-link.
You can view the health and performance of the device hardware components on the Hardware Details for Device-Name page.
The six accordions on this page provide information on the health and functioning of the hardware components and temperature. Table 2 describes the accordions.
| Accordion | Description |
|---|---|
|
PSUs |
Select PSM Power or PSM temperature from the Show PSUs drop-down list to view a list of up to six PSUs. These PSUs are listed in the order of severity of the events that have occurred on them. The PSU with the most critical events appear at the top of the list. Note:
Power supply module (PSM) temperature information is not available for MX204, MX480, and MX960 devices. Click the toggle button next to a PSU in the Show PSUs list to view the performance of the PSU in a graph. PSM state (alerts related to PSM Power or PSM Temperature) is displayed above the graph. See Performance Graphs for more information. |
|
Fans |
View a list of up to six fans and information related to the speeds of the fan, in the order of severity of events that have occurred on them. The fan with the most critical events appear at the top of the list. Note:
Charts related to the speed of the fan (rpm-percent) is not available for MX480, MX960, MX10004, and MX10008 devices. Click the toggle button next to a fan in the Show FAN Speeds list to view the performance of the fan in a graph. Fan state (alerts related to rpm-percent) is displayed above the graph. See Performance Graphs for more information. |
|
Linecard |
Select any option (Temperature line cards , Line cards CPU , Line cards Memory ) from the Show Linecards drop-down list to view a list of up to six line cards. These line cards are listed in the order of severity of the events that have occurred on them. The line card with the most critical events appear at the top of the list. Click the toggle button next to a line card in the Show Linecards list to view the performance and alerts of the line card in a graph. See Performance Graphs for more information. Note:
|
|
CPU |
Select Routing Engines or Line cards CPU from the Show CPU Utilization drop-down list to view CPU utilization of up to six Routing Engines or line cards. These Routing Engines and line cards are listed in the order of severity of the events that have occurred on them. The CPU with the most critical events appear at the top of the list. Click the toggle button next to a CPU in the Show CPU Utilization list to view the utilization and alerts of the CPU in a graph. See Performance Graphs for more information. |
|
Memory |
Select Routing Engines or Line cards Memory from the Show Memory Utilization drop-down list to view memory utilization of up to six Routing Engines or line cards. These Routing Engines and line cards are listed in the order of severity of the events that have occurred on them. The memory unit with the most critical events appear at the top of the list. Click the toggle button next to a memory unit in the Show Memory Utilization list to view the performance and alerts of the memory unit in a graph. See Performance Graphs for more information. |
|
Temperature |
Select Routing Engines, Routing Engines CPU, Chassis, Temperature Line cards or PSM Temperature from the Show Temperature drop-down list to view temperature of up to six hardware components. These components are listed in the order of severity of the events that have occurred on them. The component with the highest temperature is listed at the top of the list. Device chassis temperature in displayed in degree Celsius. Note:
Chassis temperature information is not available for MX204, MX240, MX304, MX10004, and MX10008 devices. Click the toggle button next to a component in the Show Temperatures list to view the temperature utilization of that component in a graph. See Performance Graphs for more information. |
|
Device Family |
Device Series |
FPC Fields Not Supported |
|---|---|---|
|
ACX Series |
ACX7100-32C, ACX7100-48L, ACX7024, ACX7024X, ACX7509, ACX7348 |
fpc-temperature, fpc-cpu-utilization, fpc-buffer-memory-utilization |
|
MX Series |
MX204, MX240, MX304, MX480, MX960, MX10004, MX10008 |
fpc-temperature, fpc-cpu-utilization |
Performance Graphs
The graphs on the Hardware Details for Device-Name page display the performance of the hardware components. You can also view information on alerts and breaches, if any, on these graphs. Figure 1 shows the graphs for fans in a device.
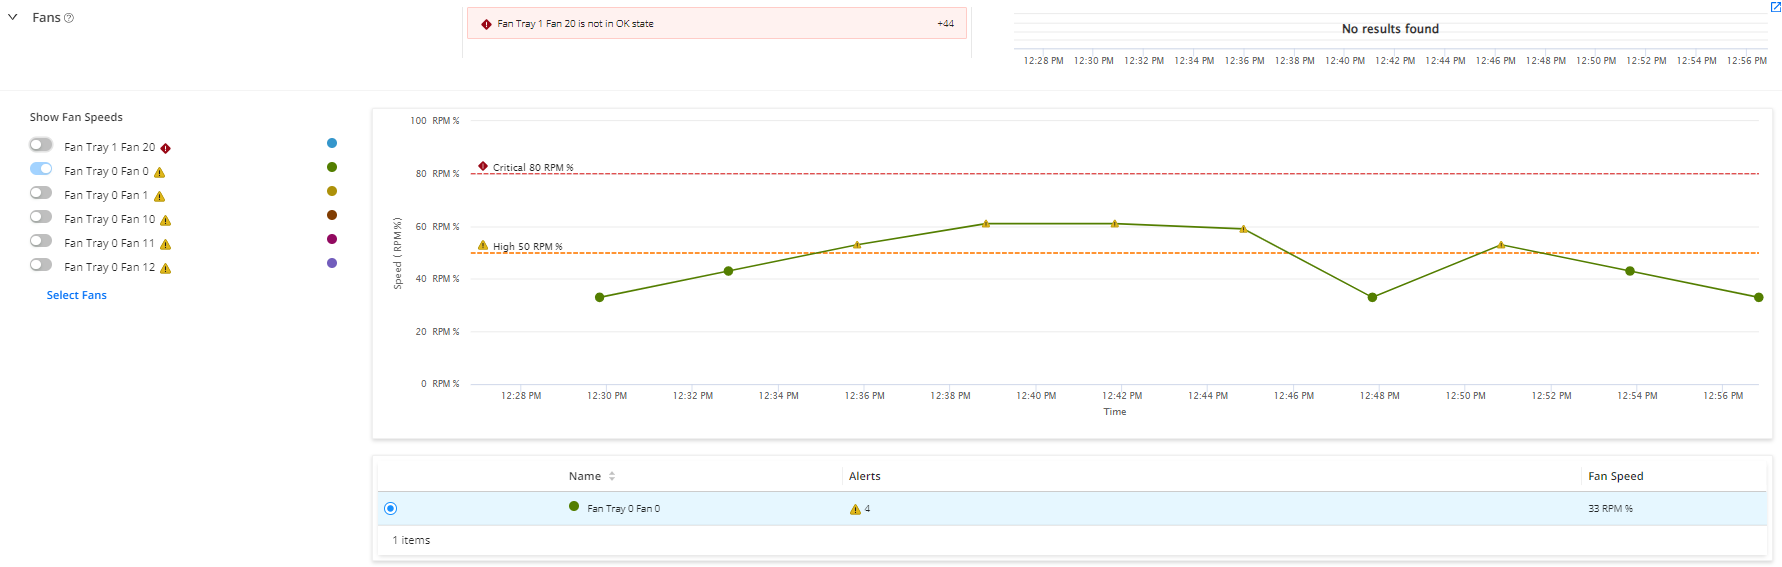
The fans present in the device are listed on the left of the Fan accordion, in the order of severity of events that have occurred. You can view up to six fans at a time with the fan that is in the most critical state displayed at the top of the list. To view fans that are not listed, click the Select Fans drop-down list and select the fans. However, you must clear a previously selected fan to be able to select another fan.
Click the toggle button next to the name of the fan, to view the performance of the fan in a graph. The graph displays two lines showing the high (in orange) and critical (in red) threshold levels related to the speed of the fan. You can also zoom into a particular portion of the graph to view more information about events that have occurred.
To view the performance of more than one fan on the graph, click the toggle button next to the name of the fan in the Show Fan Speeds list. Details of the fans displayed on the graph are also listed in a table below the graph as shown in Figure 1. You can also click the option buttons on the left of a fan name in the table to highlight the graph for that fan.
You can view the performance of a fan for a week, a day, 3 hours, 1 hour, 30 minutes, or a custom time period. By default, performance for the past 30 minutes is displayed. To change this period, click the Week, Day, 3 hrs, 1 hr, 30 mins, or Custom buttons provided above the graph.
You can view more than 25 data points on a graph related to events (in real time) that have occurred on the fan when you select the 30-minute time period. However, you can only view up to 25 data points related to events when you select a week, a day, 3 hours, 1 hour, or a custom time period (of more than 30 minutes). Data is aggregated to ensure that not more than 25 data points are plotted on the graph at once.
The graph auto-refreshes at an interval depending on the time range for which the information is displayed. See Table 4 for more information. However, you can refresh the graph at any point by clicking the Refresh icon provided above the graph.
You can also click the pop-out button next to the graph to open the graph in a new tab. You can view all customizations that you made on the graph in the parent tab, in the new tab.
The most critical alert (issues and anomalies) is displayed just above the graph and next to the quick chart. To view other alerts, click the link just below the alert. The quick chart displays the performance of the fan that you selected from the Select Fans drop-down list. However, if alerts related to the performance of any fan is generated, the fan with the most severe alert is displayed on the quick chart by default.
Alerts, if any, related to the fan is also displayed on the graph, and in the table below the graph. You can also open the graph in a new tab. When you open a graph in a new tab, you can view the following information in the new tab as well:
-
Alerts related to the fan.
Alerts are refreshed across all open tabs simultaneously, when:
-
An alert is refreshed in any one of the open tabs.
-
The last alert fetched was beyond three minutes.
-
-
List of fans that you toggled to view from the Select Fans drop-down list.
-
Fan that you selected from the table below the graph.
| Time Range | Auto-Refreshed |
|---|---|
| Weekly | Every 16.8 hours |
| Daily | Every 58 minutes |
| Every three hours | Every 8 minutes |
| Hourly | Every 3 minutes |
| Thirty minutes | Every 2 minutes |
| Custom | No auto-refresh |
You can similarly view the graphs and alerts related to the performance of other hardware components and temperature.