Service Level Expectations Overview
Service level expectations (SLE) define a benchmark for the performance of a network. An SLE consists of a set of attributes that provide information about the performance of a network. These attributes are known as classifiers. SLEs help network administrators understand whether the network is performing optimally and enable them to respond proactively to network events or performance issues.
Each classifier is assigned a value and the sum of the values for all the classifiers is the SLE score. The SLE score of an organization, a site, or a device is the aggregate score derived from all the classifiers defined for that SLE. The value or the percentage of the SLE score indicates the duration in minutes when the SLE meets or fails to meet the service levels. The SLE score is an indicator of how the network is performing. Administrators can analyze the SLE scores and look into events or problems that are impacting end user experience.
You can view SLE metrics at the organization level, site level, or at the device level.
To view information about SLE, click Monitor > Service Levels.
Juniper Data Center Assurance currently supports the following SLEs:
-
System Health
-
Link Health
-
Fabric Health
-
Virtual Infra Health
-
Service Health
These SLEs measure the time when the SLE classifiers meet or do not meet the defined threshold, resulting in an improved user experience or a deterioration in user experience. Whenever there is an impact on user experience, administrators can use these metrics to proactively intervene and resolve issues. By observing the metrics provided by each classifier, you can easily conclude whether the network is performing optimally.
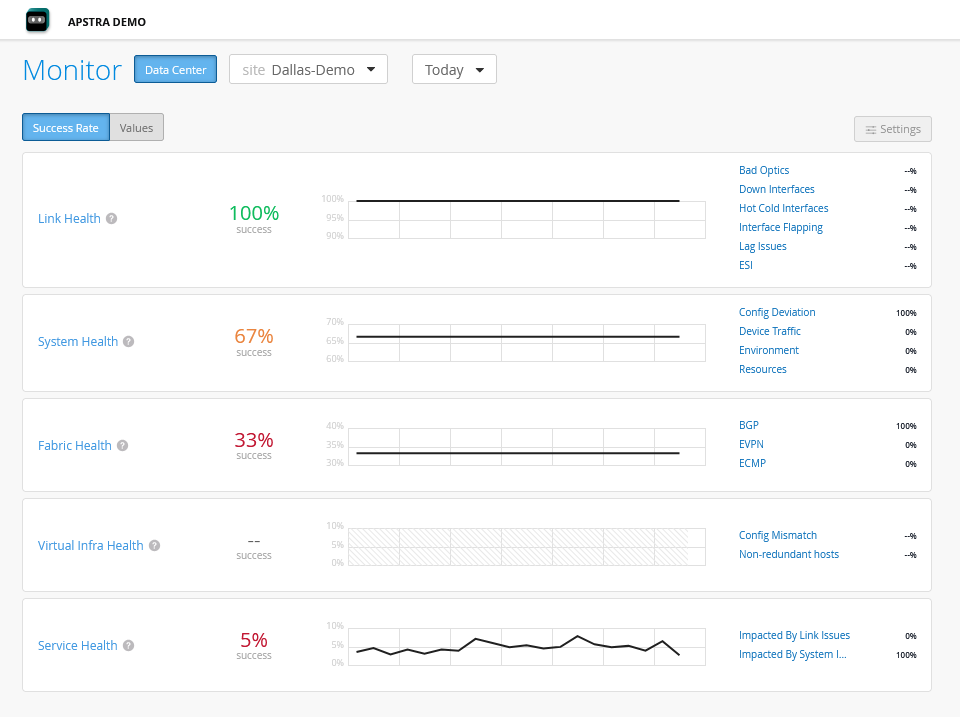
For each SLE, you can view
-
SLE Score—SLE score for the organization, site, or the device during the selected period.
-
Click Success Rate to view the SLE score in percentage, which is the percentage of time during which the user experience met the defined service level threshold. If the success rate is less than 100 percent, it indicates failures in a site or a device. For example, a service level of 99 percent indicates that the metric met the SLE goal 99 percent of the time and failed to meet the threshold 1 percent of the time.
-
Click Value to view the value of the metric.
Note: The severity of an SLE metric can be in the range of 0.0 to 100.0, with 0.0 being the least severe and 100.0 being the most severe. -
-
Timeline—The timeline graph indicates how the network performed during the selected time range. Select a classifier or a sub-classifier to view the performance of that classifier, plotted on a graph. You can click and drag to select a specific time range on the graph or select a different time range from the drop-down to view more detailed information about the SLE. Mouse over the graph to view information about the overall service level, time, SLE score for the classifiers, and so on, displayed in a pop-up.
-
Classifiers—Classifiers enable network administrators to perform a root cause analysis of the unsuccessful user experiences. A lower score for any of the classifiers can alert the administrators to address potential issues in the network.
The following sections describe SLEs and the classifiers that contribute to the SLE score for each SLE:
System Health
To access System Health SLE, click Monitor > Service Levels > System Health.
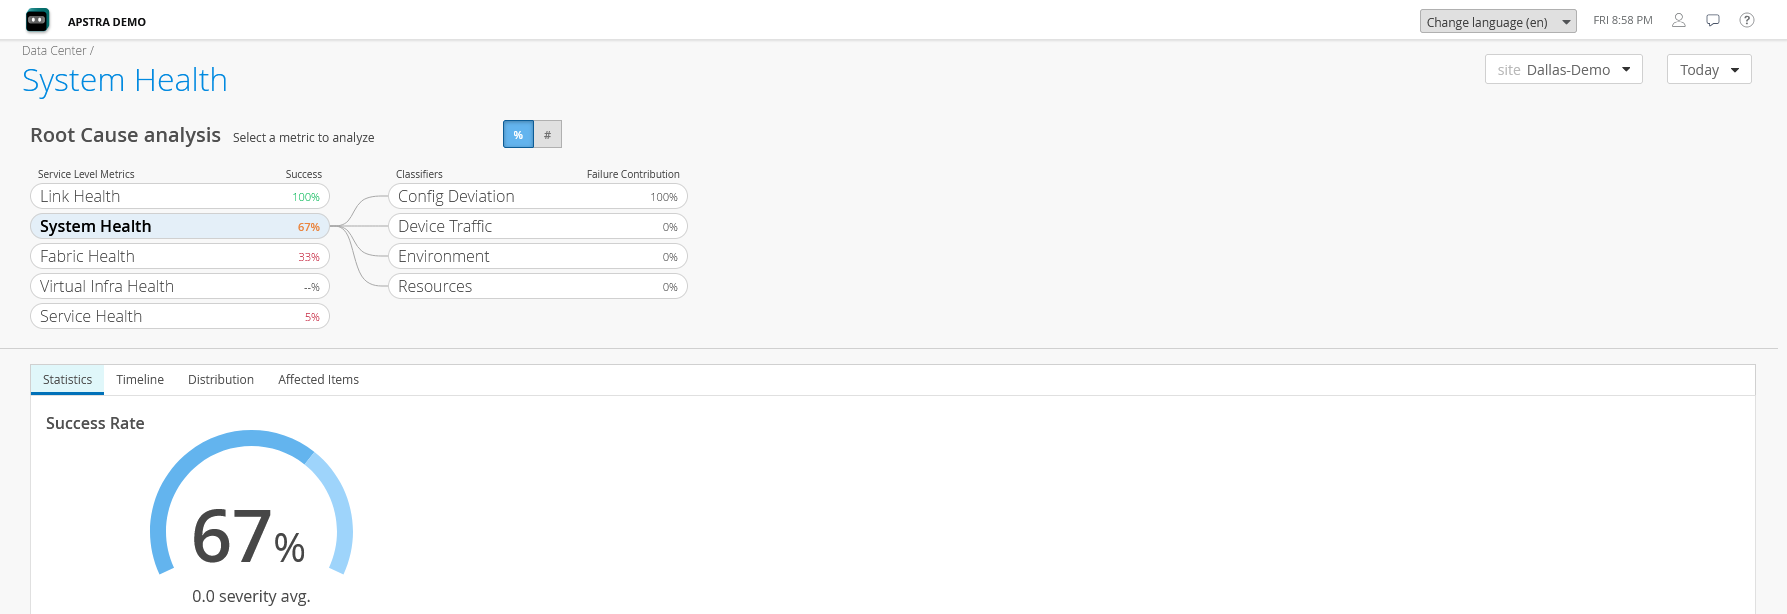
System Health SLE provides information about how the device and its components are performing. Factors that impact the system health SLE include configuration changes, traffic passing through the device, performance of the device components such as the fans and power modules, and the system resource utilization.
-
Device Traffic—Indicates that the device traffic affected the SLE score, leading to an impact on performance.
-
Config Deviation—Change in system configuration affecting the SLE score.
-
Environment—Problems with the system components affecting the SLE score. Has the following sub-classifiers:
-
Fan—Problems with the device's fan affecting the SLE score.
-
Power—Issues with the power module in the device affecting the SLE score.
-
Temp—Problems with system temperature affecting the SLE score.
-
-
Resources—System resources that affect the SLE score. Has the following sub-classifiers:
-
CPU—Problems with CPU utilization affecting the SLE score.
-
Disk—Problems with disk utilization impacting the SLE score.
-
Memory—Problems with memory utilization affecting the SLE score.
-
Link Health
To access Link Health SLE, click Monitor > Service Levels > Link Health. Link Health SLE provides information about the interface states or connectivity issues that leads to a lower SLE score.
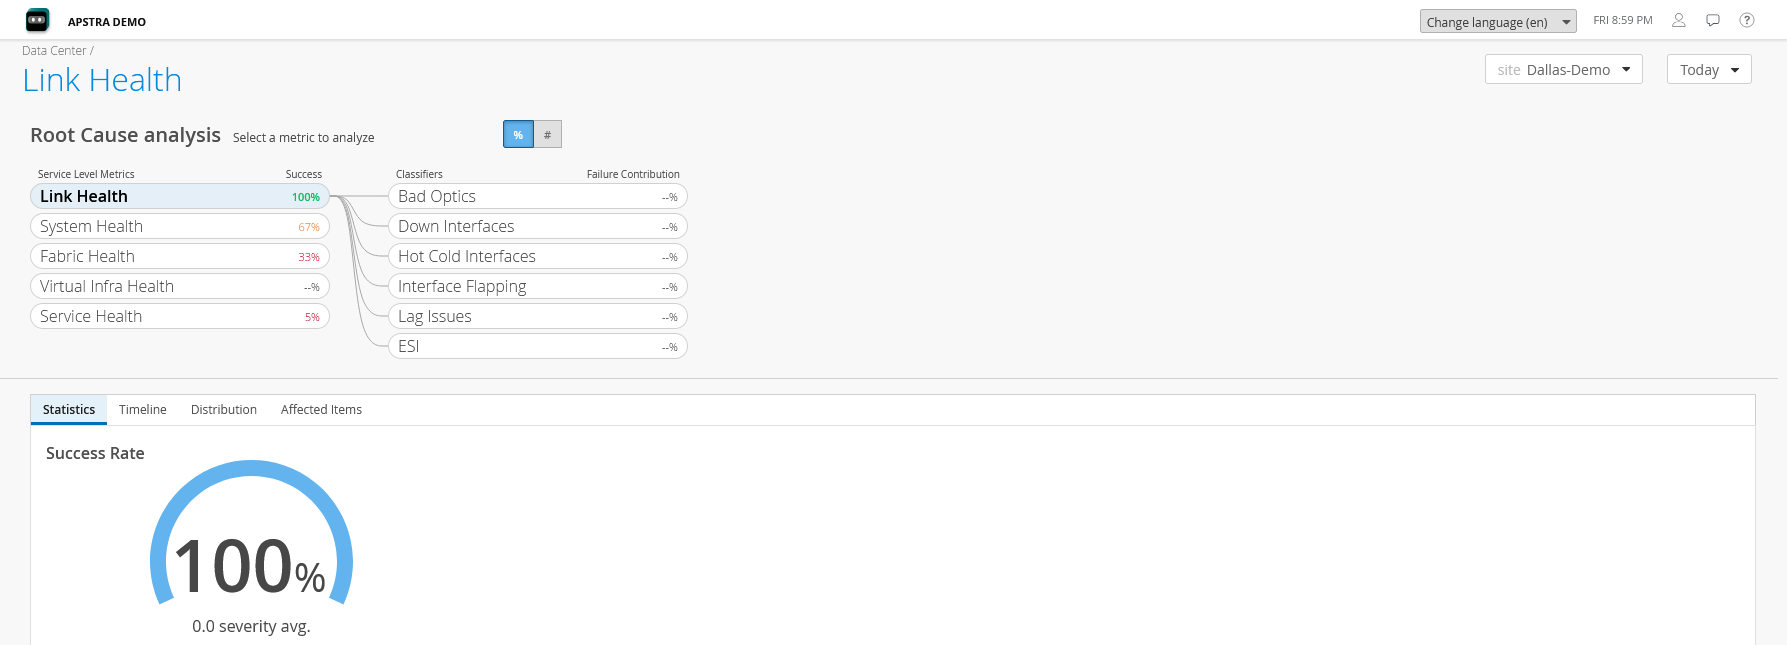
-
Down Interfaces—An interface that is down impacts the SLE score.
-
Bad Optics—Optics issues impact the SLE score.
-
Hot Cold Interfaces—Hot cold interfaces impact the SLE score.
-
Fabric Interfaces—Issues in fabric interfaces impact the SLE score.
-
Specific Interfaces—Issues in specific interfaces impact the SLE score.
-
-
Interface Flapping—Frequent change of state of an interface contributed to a lower SLE score
-
Fabric Interfaces—Issues in fabric interfaces impact the SLE score.
-
Specific Interfaces—Issues in specific interfaces impact the SLE score.
-
-
LAG Issues—Issues in traffic flow on the link due to a link going down or due to excessive traffic on one of the links. A change in the classifier value indicates that the LAG Issues value has crossed the threshold configured in the probe in Apstra. It also shows which link is causing problems for traffic flow.
-
Imbalance—A change in classifier value indicates that there is an imbalance in LAG usage.
-
-
ESI—Issues in the ESI interfaces. A change in the classifier value indicates that the ESI value has crossed the threshold configured in the probe.
Fabric Health
To access Fabric Health SLE, click Monitor > Service Levels > Fabric Health. Fabric Health SLE provides information about the performance of the data center fabric, which includes the state of sessions between the leaf, spines, and superspines in the data center.
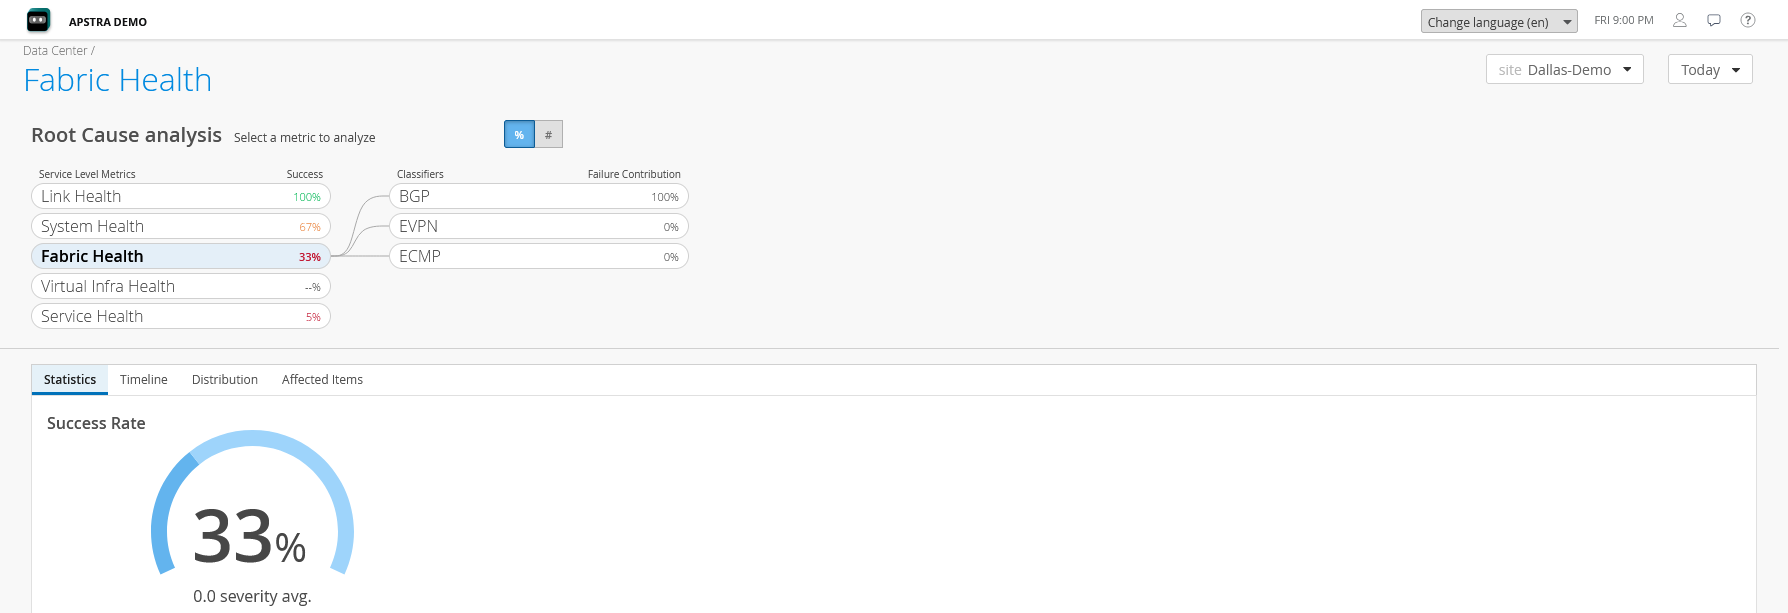
-
BGP
-
IP Reachability Spine to Leaf—Problems with spine-to-leaf connectivity. A change in classifier value indicates there is a spine-to-leaf connectivity issue.
-
Sessions—Problems with BGP sessions either between a spine and leaf in the data center or with an external device, such as a superspine. A decrease in the classifier value indicates that the number of flaps has crossed the threshold value.
-
-
EVPN—Reports anomalies related to EVPN routes in the network.
-
EVPN Type 2—Problems in EVPN Type-2 routes. A decrease in the classifier value indicates that the expected EVPN Type-2 routes are missing on the device(s) in the network.
-
EVPN Type 3—Problems in EVPN Type-3 routes on the leaf devices in the network. A decrease in the classifier value indicates that the expected EVPN Type-3 routes are missing on the device(s) in the network.
-
EVPN Type 5—Problems with EVPN Type-5 routes on the leaf devices in the network. A change in the classifier value indicates that the expected EVPN Type-5 routes are missing on the device(s) in the network.
-
Flood List—Problems with the flood list on the leaf devices in the network. A decrease in the classifier value indicates that the expected flood list forwarding entries are missing on the device(s) in the network.
-
-
ECMP
-
Imbalance—Problems in selection of ECMP routes. A change in classifier value indicates there is an imbalance in usage of ECMP routes.
-
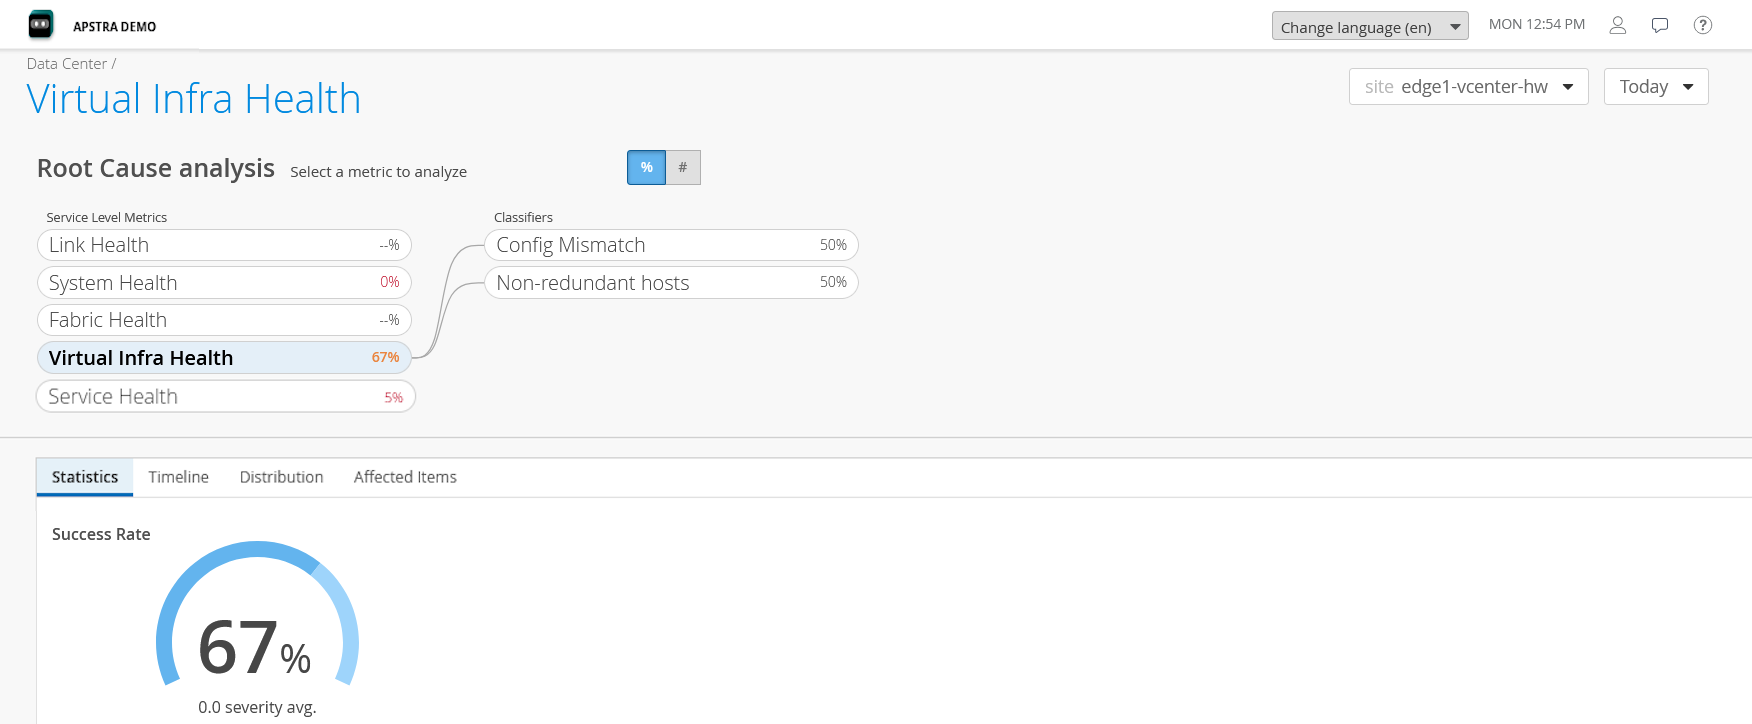
Virtual Infra Health
To access Virtual Infra Health SLE, click Monitor > Service Levels > Virtual Infra Health. Virtual Infra Health SLE provides information about deviation from intended behavior in the virtual infrastructure. To obtain Virtual Infra Health SLE metrics, you must configure vCenter when you adopt Apstra Edge.
-
Config Mismatch—Checks for mismatch between the Apstra-configured virtual networks in the data center fabric and the VLANs needed by the VMs running on the hypervisors attached to devices in the fabric. A decrease in the classifier value indicates that there are problems in VLAN configuration.
-
Non-redundant hosts—Checks whether hosts have redundant hypervisors. A decrease in the classifier value indicates that not all hosts have redundant hypervisors configured.
Service Health
To access Service Health SLE, click Monitor > Service Levels > Service Health. Service Health SLE monitors and provides information about the overall service performance impact due to system health and link health related anomalies.
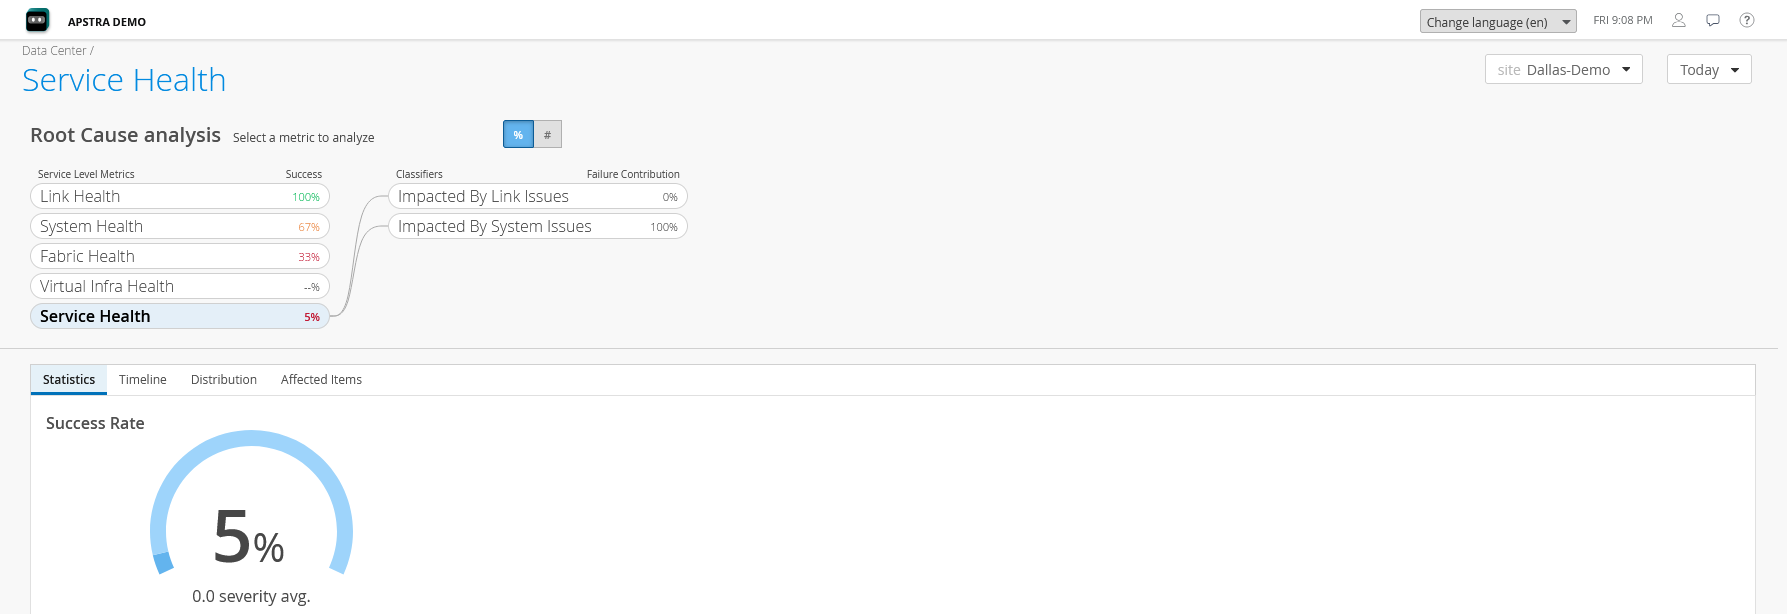
- Impacted by System Issues—Indicates that the system health related anomalies affected the SLE score. It uses the same metrics as the System Health SLE to calculate the impact on the services.
- Impacted by Link Issues—Indicates that the link health related anomalies affected the SLE score. It uses the same metrics as the Link Health SLE to calculate the impact on the services.
Analyze SLE Scores
You can analyze the SLE score from the Root Cause Analysis page. The Root Cause Analysis page provides visualizations for distribution, timeline, and statistics for service level failures and enables administrators to understand the impact of these issues. To view the Root Cause Analysis page, click Monitor > Service Levels. Then click an SLE or a classifier for more detailed information.
-
Statistics—The Statistics tab displays the success rate of the SLE metric. Administrators can also view the distribution graph to understand the severity of the SLE with its impact duration.
-
Timeline—The Timeline tab provides a graph that plots the SLE trend during the selected time range. Select a classifier or a sub-classifier to view the timeline graph. Mouse over the graph to view more detailed information about the SLE score.
-
Distribution—Provides information about how a classifier impacts other devices in the data center.
-
Affected Items—Provides information about the services, virtual networks, and routing zones.
-
Interfaces—Provides the list of interfaces that are impacted due to anomalies. This metric is available only for Link Health SLE.
-
Services—Provides the list of devices or services that failed to meet the defined service levels and also the impact of a specific device or service.
-
Virtual Networks—Provides the list of virtual networks that are impacted due to anomalies.
-
Routing Zones—Displays the list of routing zones that are impacted due to anomalies.
-
Probes to be Enabled in Apstra to View SLE Information
Table 1 lists the predefined probes to be enabled in Apstra Data Center Director. For more information, see Instantiate Predefined Probe in the Apstra Data Center Director User Guide.
| SLE | Probe | Affected Items |
|---|---|---|
| System Health |
|
|
| Link Health |
|
|
| Fabric Health SLE |
|
|
| Virtual Infra Health SLE |
|
|
| Service Health SLE |
|
|