Application Awareness Overview
The Application Awareness feature in Juniper Data Center Assurance provides a visual representation of the services that are active during a given time period. The visualization also shows how the data center fabric is being utilized by these services. You can select a service and drill down to get detailed information about the traffic flow.
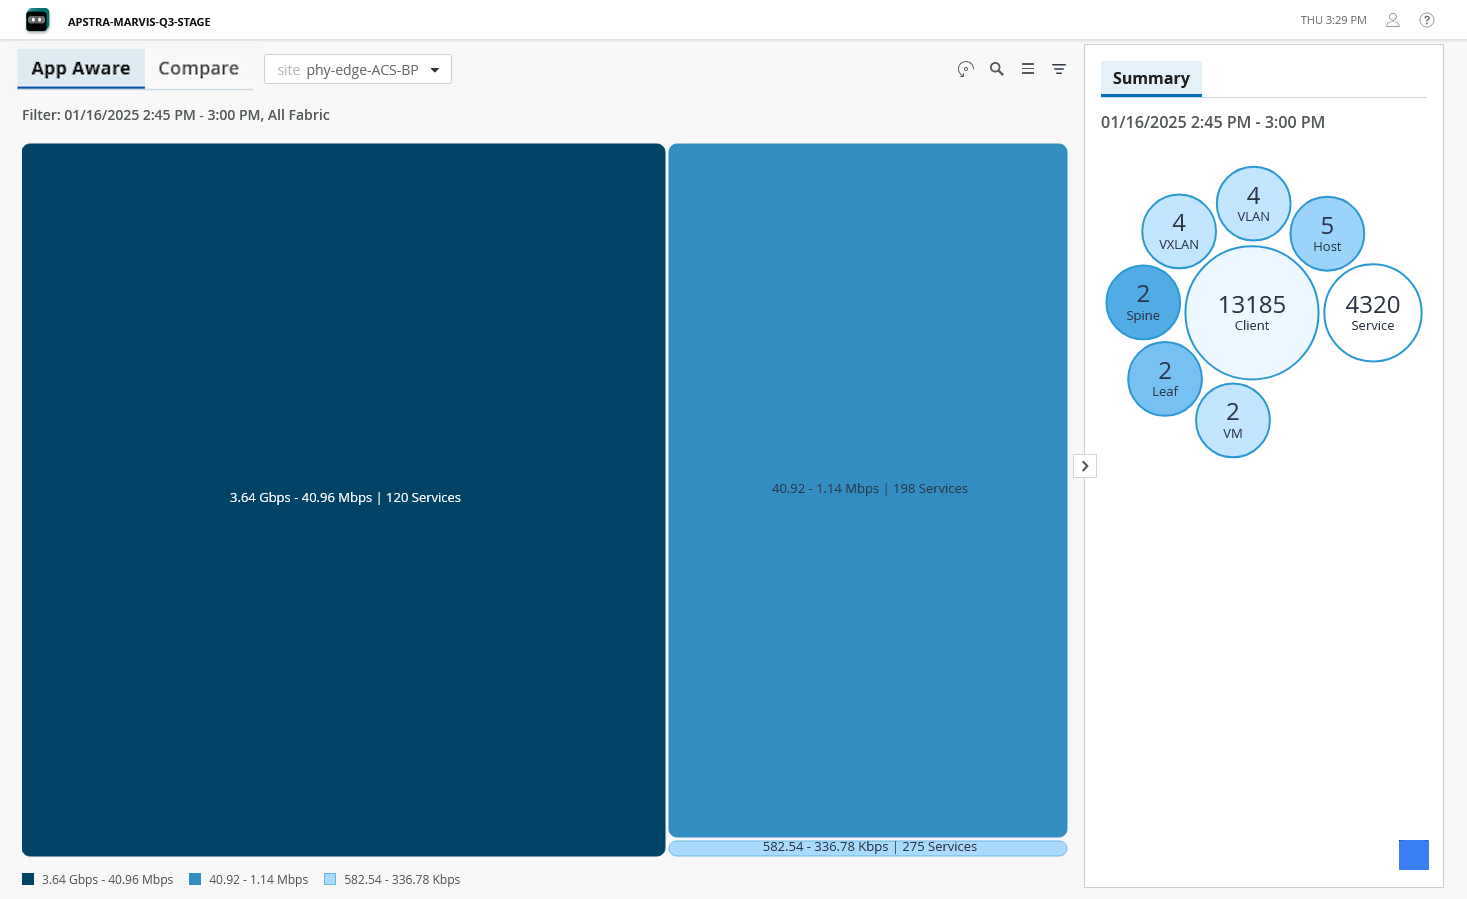
A data center managed by Apstra Data Center Director is aware of all the services that are running in the data center. The Application Awareness feature provides a visual representation of all the services running in the site, grouped by throughput, volume, or connections for the site you select. The data displayed on the App Aware page is refreshed every 15 minutes. To view real-time data, click the On-Demand Data button on the top right of the page.
You can drill down and view details of specific services, view the network topology, identify any node that has an anomaly, and the hosts connected to the device, which are impacted by the anomaly.
You must configure sFlow in the devices in the data center to view flow data in Juniper Data Center Assurance.
You can select a set of services and examine how nodes are connected to hosts and how those services traverse through the data center fabric. The total count of events and anomalies affecting the nodes is displayed in the topology diagram.
In this demo, we'll show how the Juniper Data Center Assurance platform helps identify network issues when there's a service impact in the data center.
In our demo environment, we have a two-spine, two-leaf topology with multiple hosts connected to the leaf switches. These include both bare metal servers and ESXI hosts. Virtual machines running on the ESXI hosts are displayed at the top layer. For this demo, we'll simulate traffic between the two Ubuntu VMs, a server and a client. And the server will stream video using VLC. The client will access that stream. Then we'll introduce network congestion to see how Juniper Data Center Assurance detects and reports on the issue.
Here is our Ubuntu server VM where we have the VLC streaming server. The client VM is accessing that stream over port 8080 and we see that that stream is playing smoothly on the client.
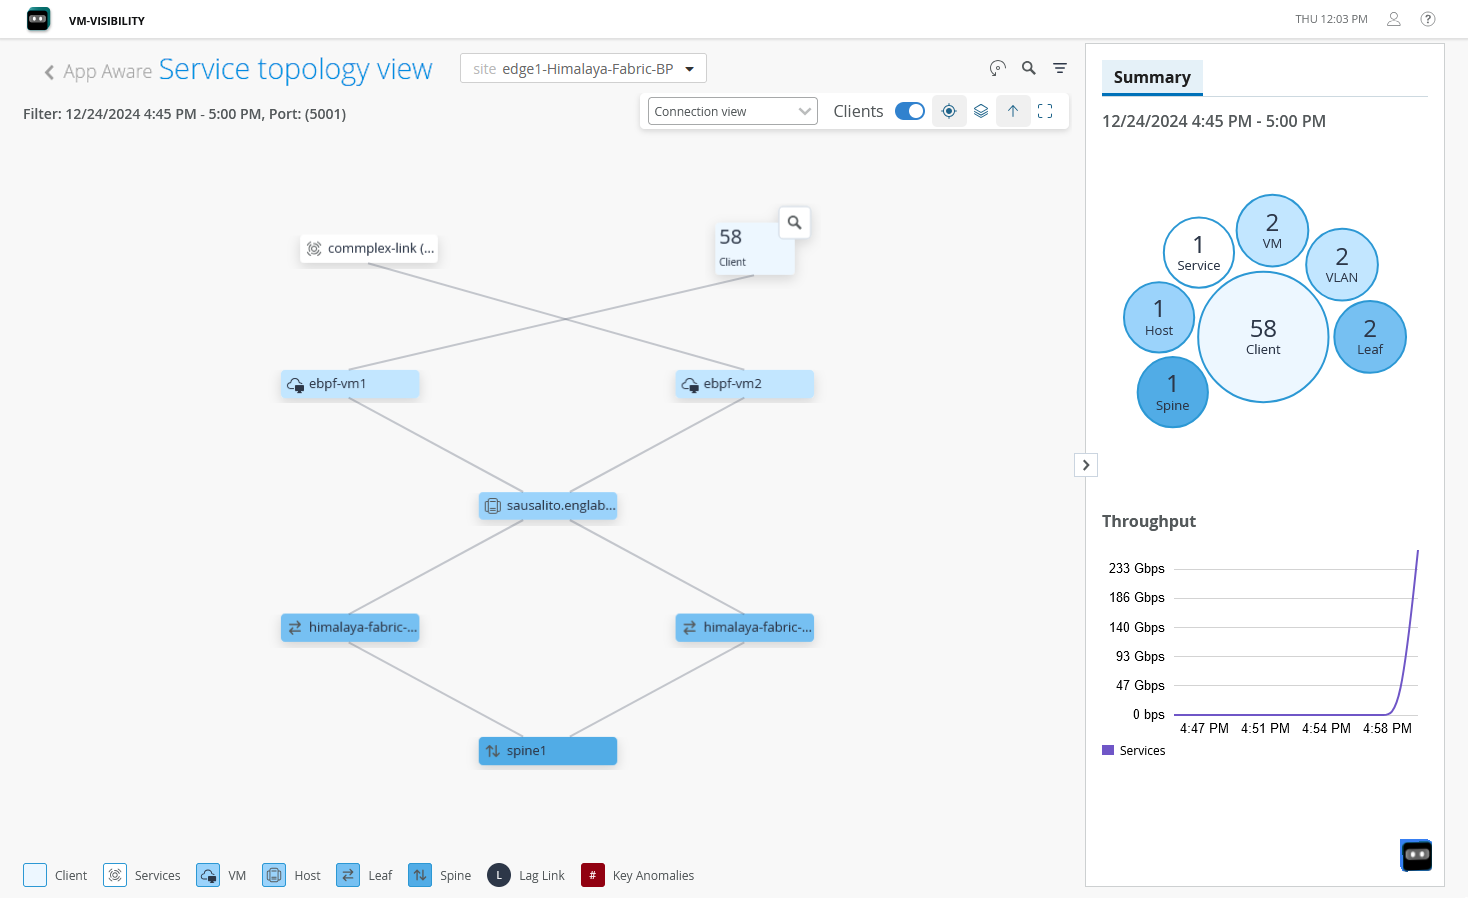
In the App Aware page within Juniper Data Center Assurance, we can view traffic flows across the data center. Services are listed and organized by throughput. We can drill down and locate our video service running on port 8080. And when we click on it, we see the service topology showing the video service running the Ubuntu server VM, clients accessing the stream from the Ubuntu client VM, and the full network path through the spines and leaves.
And at this point, the data center health is normal and no anomalies are reported. So, at the moment our video is running smoothly and everything is fine. To simulate congestion, we switch to a test VM and start running high bandwidth iperf traffic between a test client and a server.
Before congestion, we see the video in the client playing smoothly. Once the test traffic begins, we observe the video slowing down and becoming glitchy.
This mirrors a real world situation where users may complain of video buffering or slow application performance. The root cause could be the server, the service, or as in this case, the network. Once we stop the test traffic, the video quickly returns to normal.
A few moments later, back in the Dashboard view, we see that an anomaly has been reported. A hot interface alert on one of the leaf switches. This was caused by the congestion. Clicking on this anomaly takes us to the Impact Analysis screen. There we can see the specific leaf affected, a list of services impacted by the anomaly. In our case, it shows two services - port 8080, our video stream, and the iperf traffic we generated caused the congestion. Apstra also lists the clients affected during that time frame, which was from 12:00 to 12:15 p.m.
If no one noticed the anomaly in real time, but a user later reports issues, for example, glitchy video around 12:00 p.m., we can still investigate. Using the Impact Analysis feature, we select a wider time range, say 11:15 a.m. to 12:45 p.m., and scroll through to the reported window.
Even though the anomaly is cleared, Apstra retains historical data. So, we can go back to 12:00 to 12:15 p.m., and we see the service impact, and we confirm that an anomaly was present and the video service on port 8080 was affected.
This demo illustrates how Juniper Data Center Assurance can help identify and trace network-related service impacts like video jitter caused by congestion. Even if the issue is temporary, the platform's impact analysis and anomaly history allow admins to go back, correlate user complaints with actual events, and resolve the root cause efficiently.
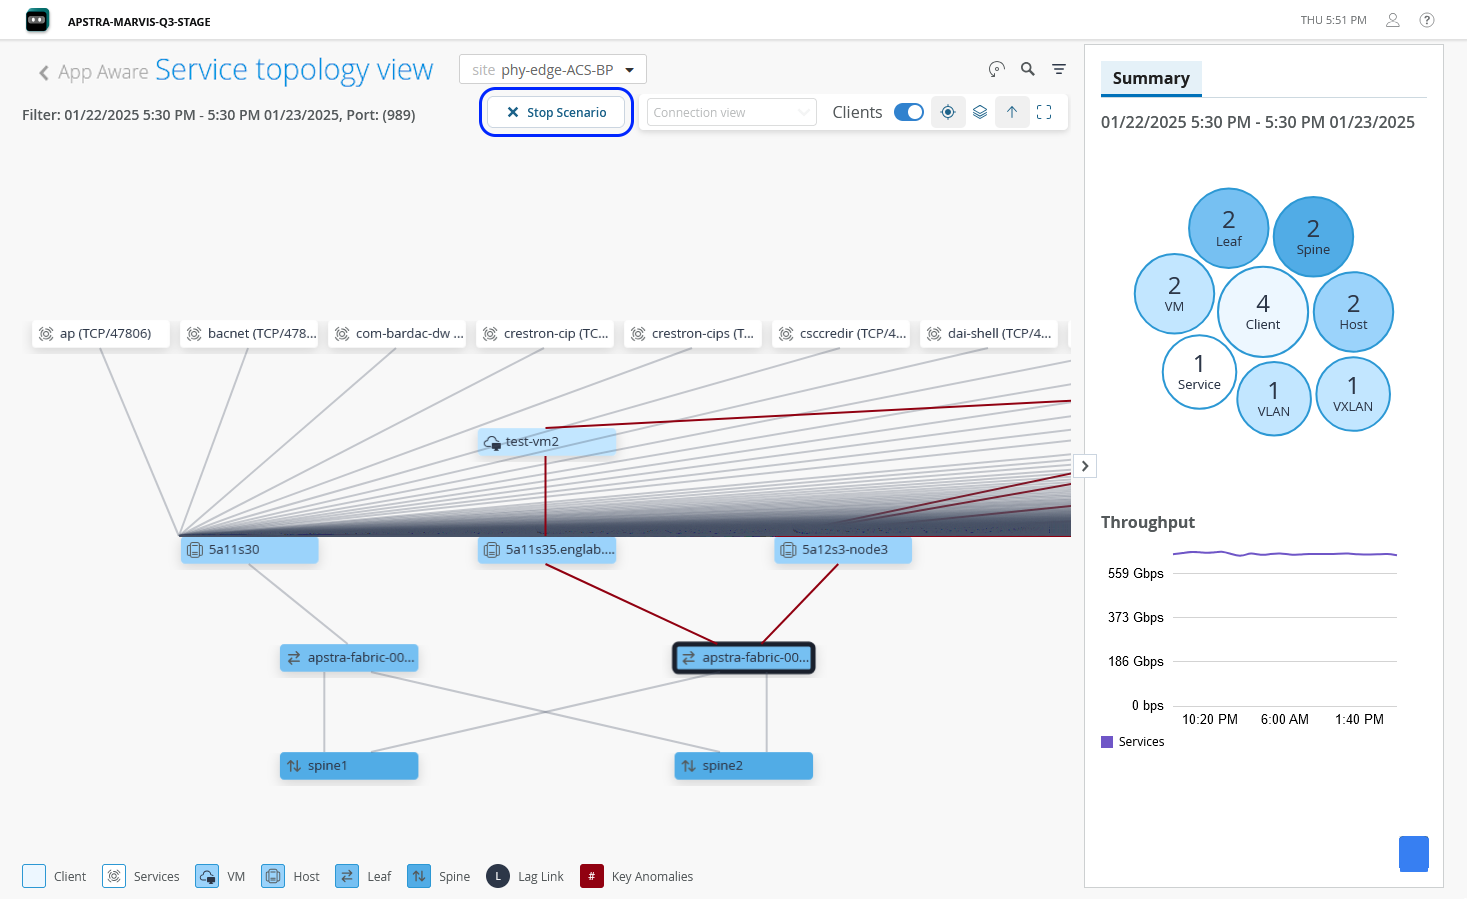
You can view a visual representation of the impact of a device or service failure on the clients connected to it. Select a device or service and click Fail Scenario on the right pane. The potential failure scenarios are simulated and displayed in the topology.
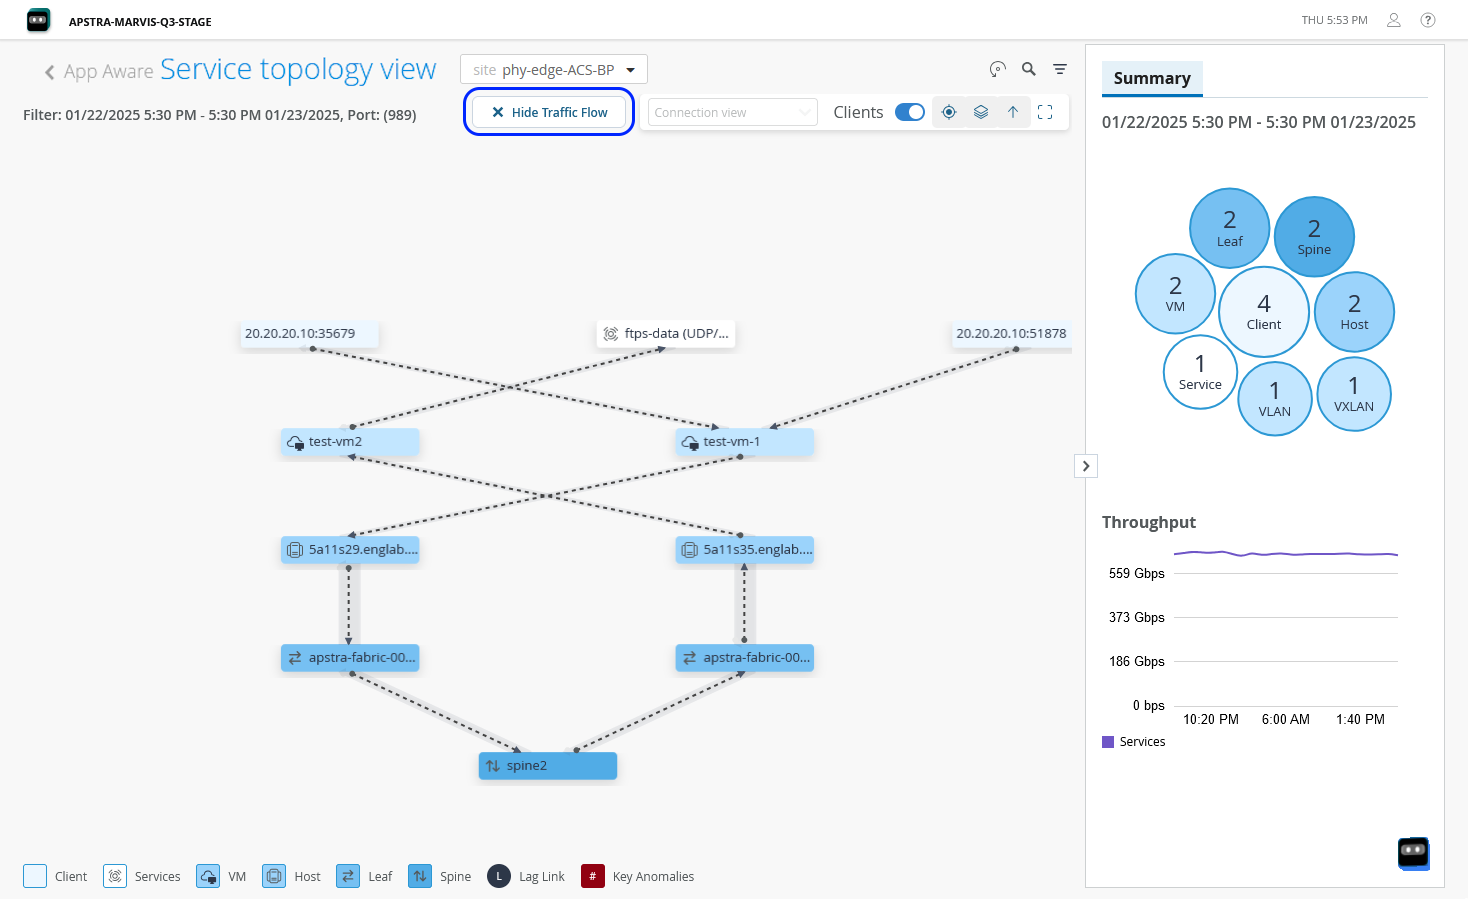
You can also view how traffic is flowing through the data center network for a specific service. Select a service from the topology and click Traffic Flow on the right pane. Once you select the clients you want to monitor from the drop-down, you can see a visualization of application traffic flow.
The Summary tab in the right pane provides a summary of the selected service with details such as the number of devices associated with the service and the total number of services.
The search option on the App Aware page enables you to examine the required service without having to drill down from the topology view. You can directly search for the service and view the connections and flow details for that service. The filter option helps you look into the connections between specific leaf and spine nodes and examine the service traffic by selecting specific services and the layers that you want to view.
You can also compare how the services and endpoints performed during two time periods from the Compare tab. The flow data collected from the Apstra instance is stored in Juniper Data Center Assurance for 30 days. You can compare the current performance of the services with the last 30 days' flow data. Select Connection View to view the connections between the devices and the services associated with the devices. Select Flow View to understand how service traffic utilizes the network.
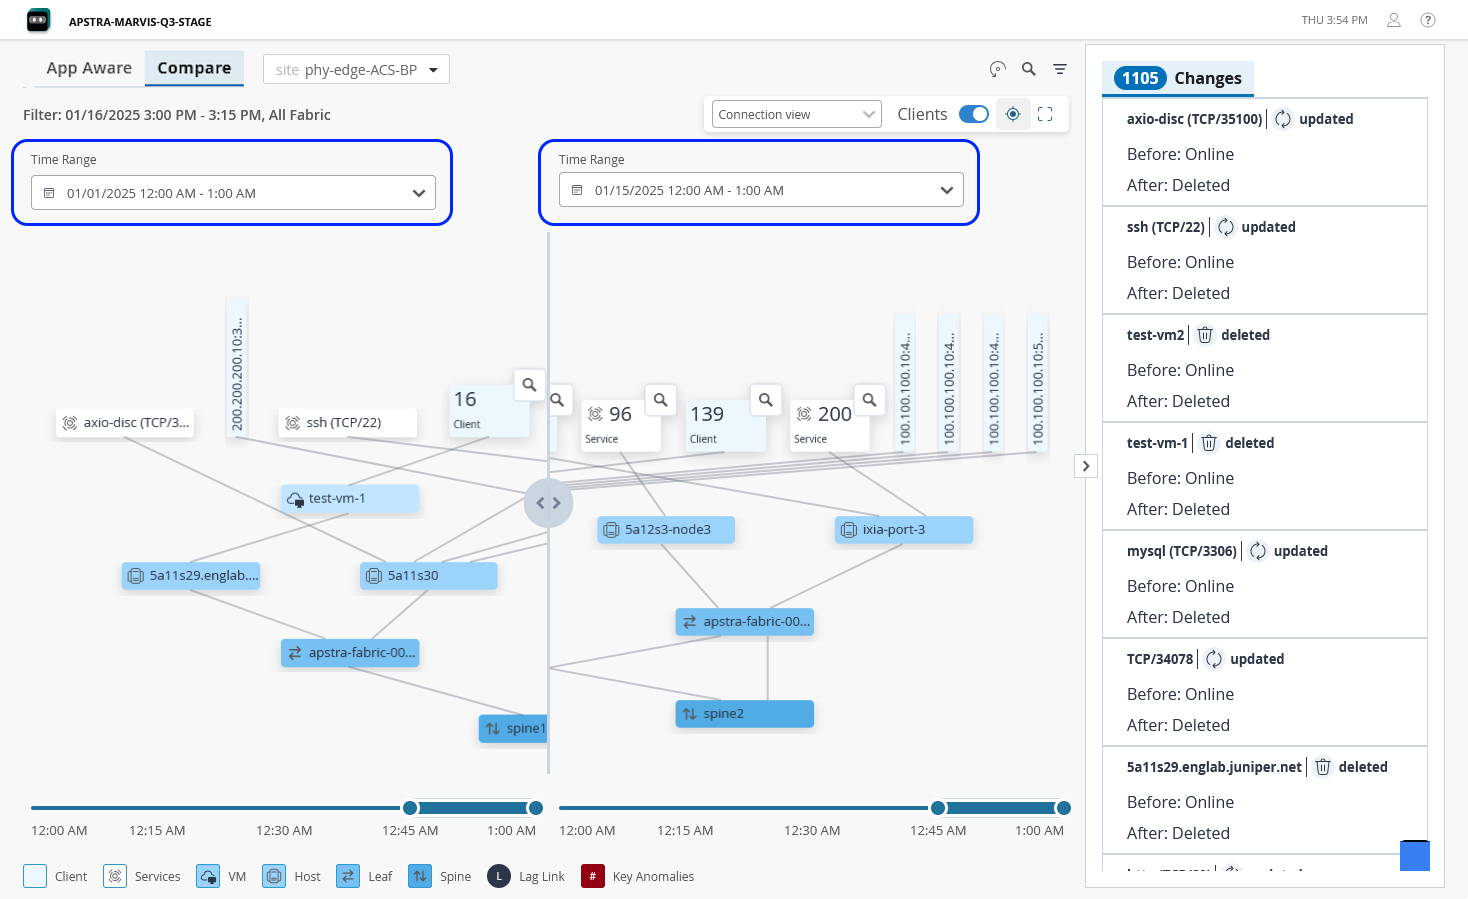
The flow view on the App Aware page provides information about the flow data between the nodes. A thicker line connecting the devices indicates that more traffic is being exchanged between those devices.
The Application Awareness feature thus provides a complete view of the data center, providing insights about potential issues in the data center network and their impact on the services.
Benefits of App Aware
-
Provides a service-to-data center resource mapping, thereby providing visibility about how the services are utilizing the data center fabric. This visibility enables administrators to correlate application issues with potential network issues in the data center devices, helping them to resolve issues faster.
-
Provides information about devices or ports that are associated with specific services. This enables administrators to perform impact analysis and pinpoint devices or ports that are causing issues.
-
Provides visualization of the network topology displaying how services connect to different endpoints.
-
Provides insights about traffic patterns and performance metrics for services and network endpoints.