Configure Apstra
These topics describe the configurations to be done in Apstra Data Center Director.
Configlets
Configlets are pre-built configuration templates that deploy sFlow collection and SNMP enrichment configuration to your network devices. Two configlets must be imported: one to enable sFlow data collection, and one to enable SNMP-based interface name enrichment. Deploy both to each blueprint that will send data to DC Assurance.
The following sections walk you through deploying each configlet, with explanations of the property sets you will need to configure.
Deploy the Flow Data Configlet
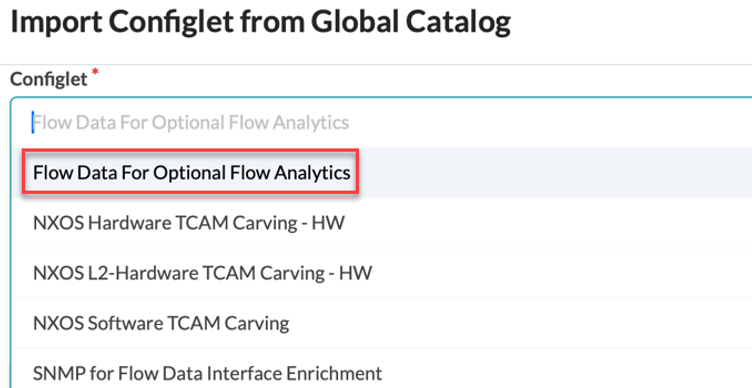
The Flow Data Configlet enables sFlow collection on your devices. It configures sFlow polling intervals, sample rates, the collector IP address (where sFlow data is sent), and which interfaces to monitor. You must configure the collector IP address to point to your Apstra Flow server.
-
Select the devices you want to apply the configlet to, then click Import
Configlet.
Configure the Flow Data Property Set
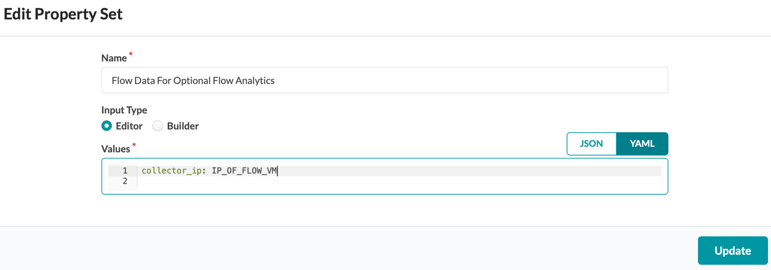
After importing the configlet, configure the property set to specify the IP address of your Apstra Flow server.
-
Set the Collector IP Address to the IP address of your Apstra Flow
Data VM.
The Flow Data Configlet includes the following configuration elements, which you can customize further if necessary:
- Routing: A static route directs sFlow traffic over the management Junos RPF interface, ensuring it reaches the collector even if the default route changes.
- Polling interval: Controls how frequently sFlow statistics are collected. Default is 10 seconds.
- Sample rate: Sets the ratio of packets examined to packets sampled. Higher values (like 1024) reduce overhead; lower values (like 100) increase data fidelity.
- Source IP: The IP address on the device used as the source for sFlow datagrams.
- Collector: The IP address and UDP port (default 6343) where sFlow data is sent.
- Interfaces: The physical interfaces from which sFlow data is collected.
The following is an example of a Flow Data Configlet:
routing-options {
  static {
    route 10.28.36.6/32 next-table mgmt_junos.inet.0;
  }
}
protocols {
  sflow {
    polling-interval 10;
    sample-rate {
      ingress 1024;
      egress 1024;
    }
    source-ip 10.28.36.12;
    collector 10.28.36.6 {
      udp-port 6343;
    }
    interfaces ge-0/0/0;
    interfaces ge-0/0/1;
    interfaces ge-0/0/2;
  }
}
Deploy the SNMP for Flow Data Interface Enrichment Configlet
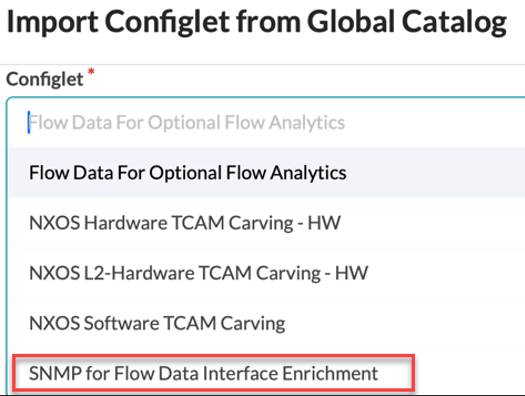
The SNMP enrichment configlet allows Apstra Flow to retrieve interface names, such as ge-0/0/1, from your devices via SNMP, instead of displaying raw interface index numbers. This makes flow data more readable in dashboards and reports. Without this configlet, interfaces appear as index:522, or index:524, for example.
-
From the Global Catalog, select SNMP for Flow Data Interface
Enrichment.
Figure 1: Import Configlet
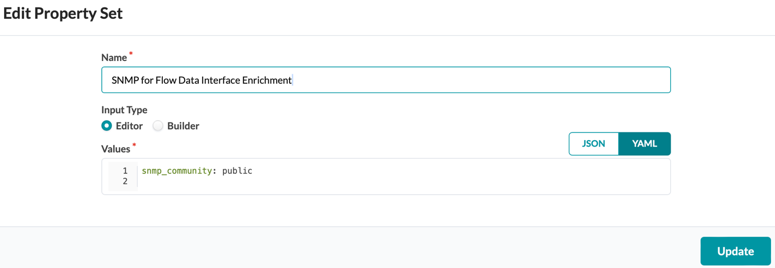
Configure the SNMP Property Set
After importing the SNMP configlet, configure the property set with the SNMP community string. This string must match the read-only community configured on your network devices.
-
Set the SNMP Community String to the community value configured on
your devices. The default is public, but yours may differ.
Enable Predefined Probes
Three probes are required for the pre-flight checks to pass during onboarding. A set of optional probes is also available for better fabric visibility.
Required Probes:
- Device Environmental Checks
- Drain Traffic Anomaly
- Interface Flapping (Fabric Interfaces)
Optional Probes:
- Interface Flapping (Specific Interfaces)
- Hot/Cold Interface Counters (Specific Interfaces)
- EVPN VXLAN Type-5 Route Validation
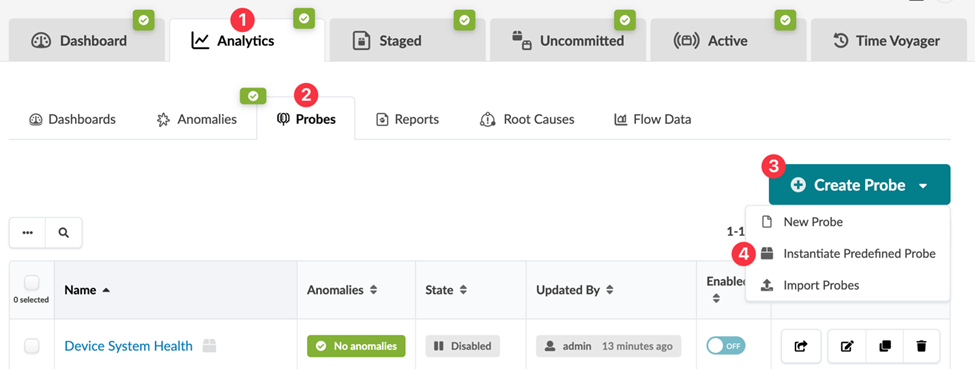
All of these probes are predefined in Apstra. Follow these steps to instantiate them in your blueprint.
-
From your blueprint, navigate to Analytics > Probes.
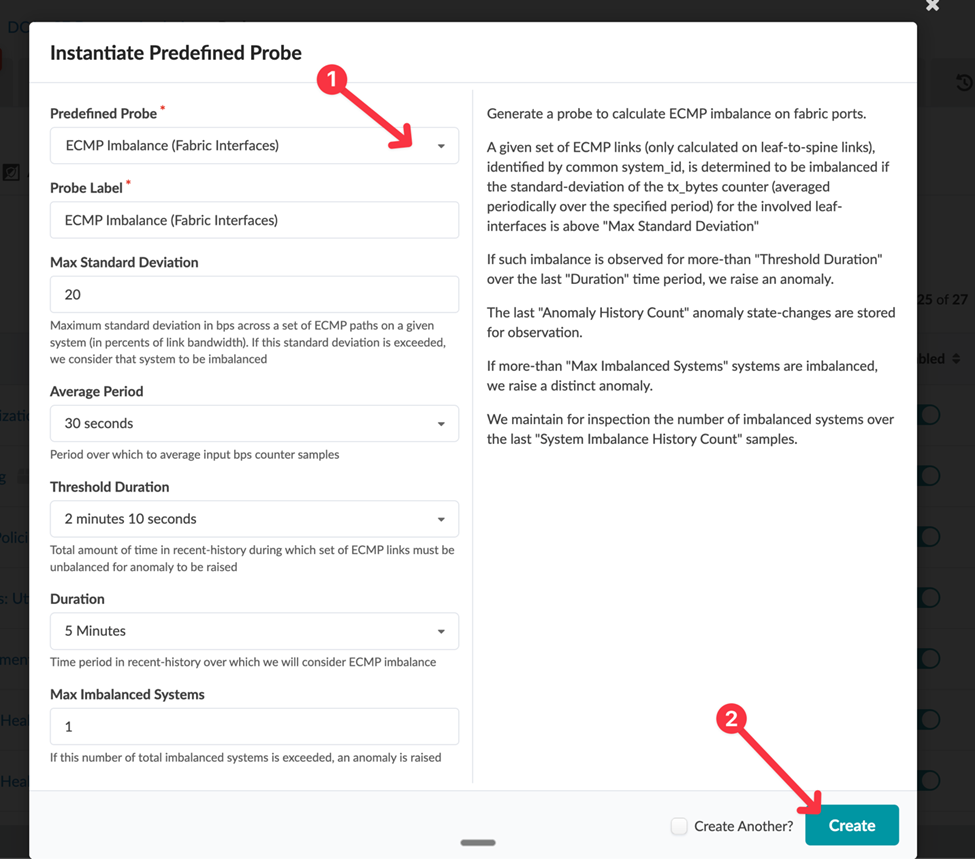
-
In the Instantiate Predefined Probe dialog, select the probe you
want to enable from the drop-down list.
Enable Streaming on the Optical Transceivers Probe
The Optical Transceivers probe doesn’t have streaming enabled by default. If this probe is not already instantiated in your blueprint, navigate to Analytics > Probes > Create Probe > Instantiate Predefined Probe and select it from the list.
Follow these steps to enable streaming on the Optical Transceivers probe:
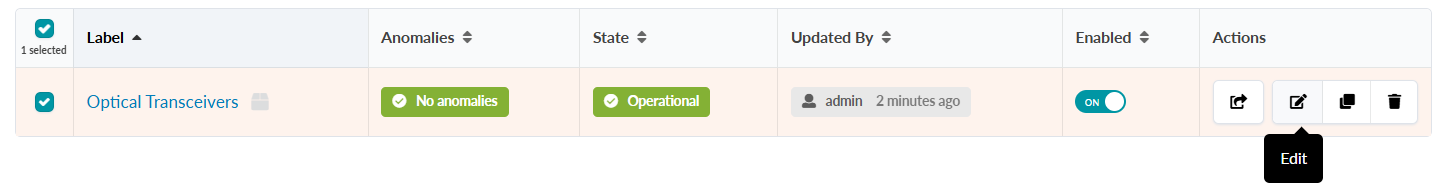
-
From your blueprint, navigate to Analytics > Probes. Select
the checkbox next to the Optical Transceiver probe and click
Edit.
-
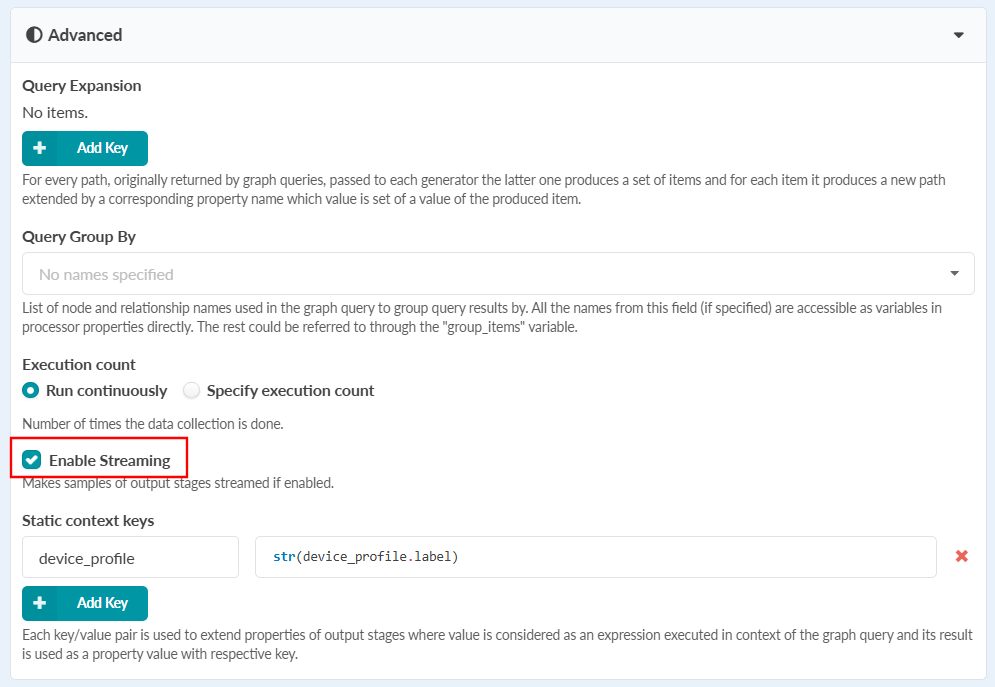
Click the Advanced drop-down and select the Enable Streaming
checkbox.
Figure 2: Enable Streaming
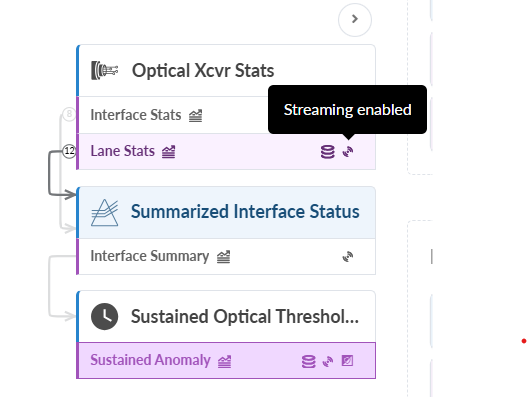
-
The Streaming enabled icons display next to the processors.
Install the DC Probes
The DC Probe collects Bit Error Rate (BER), Forward Error Correction (FEC), and Cyclic Redundancy Check (CRC) metrics, along with CPU and memory utilization data. You can install the DC Probes from the Hub page in DC Assurance.
Follow these steps to install the DC Probes.
-
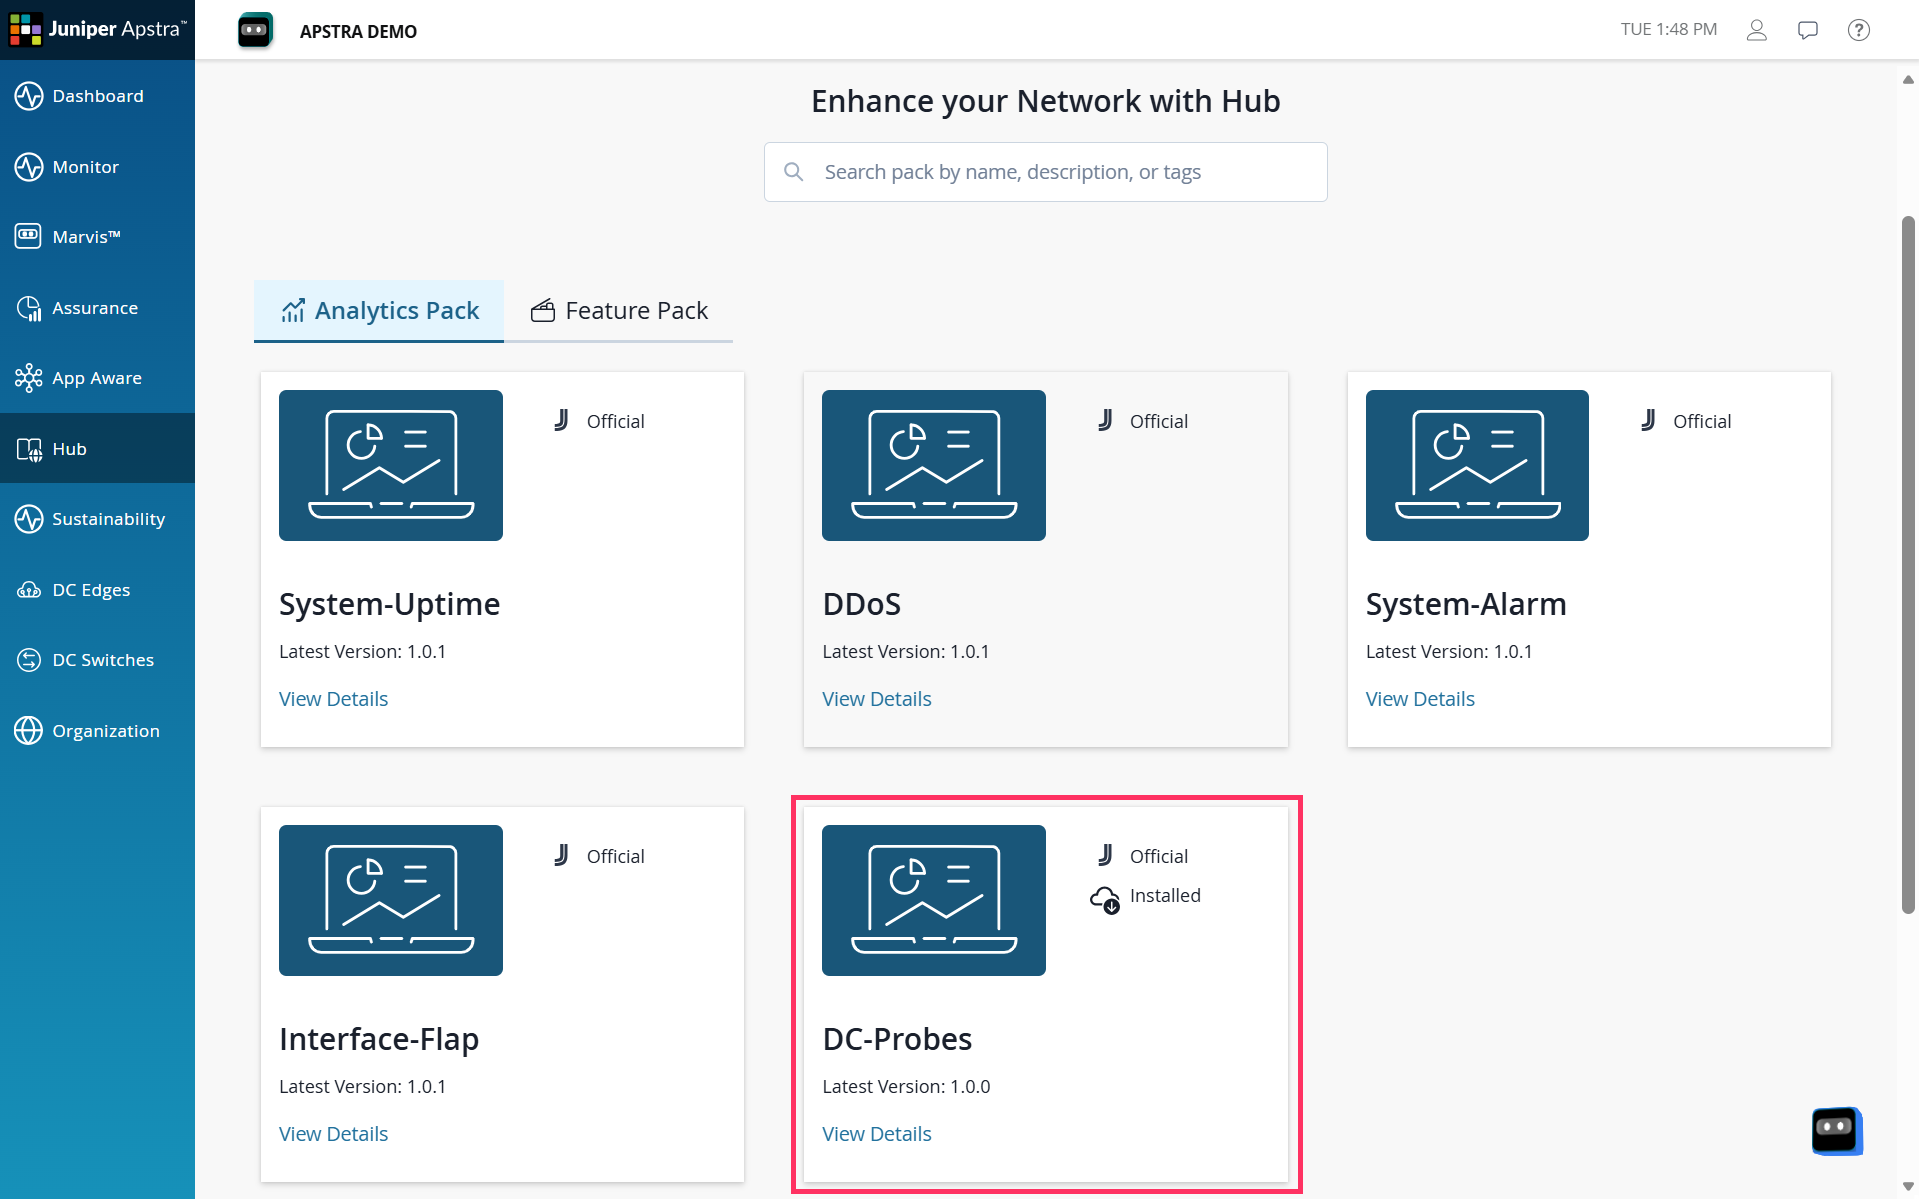
Click View Details on the DC-Probes tile.
Figure 3: Hub
Information such as Apstra version, compatibility, and what collectors the probe consumes displays.
-
On the Install DC-probes page, select the Edge instance to apply the probe
to, and click Next.
Figure 4: Install DC-Probes

-
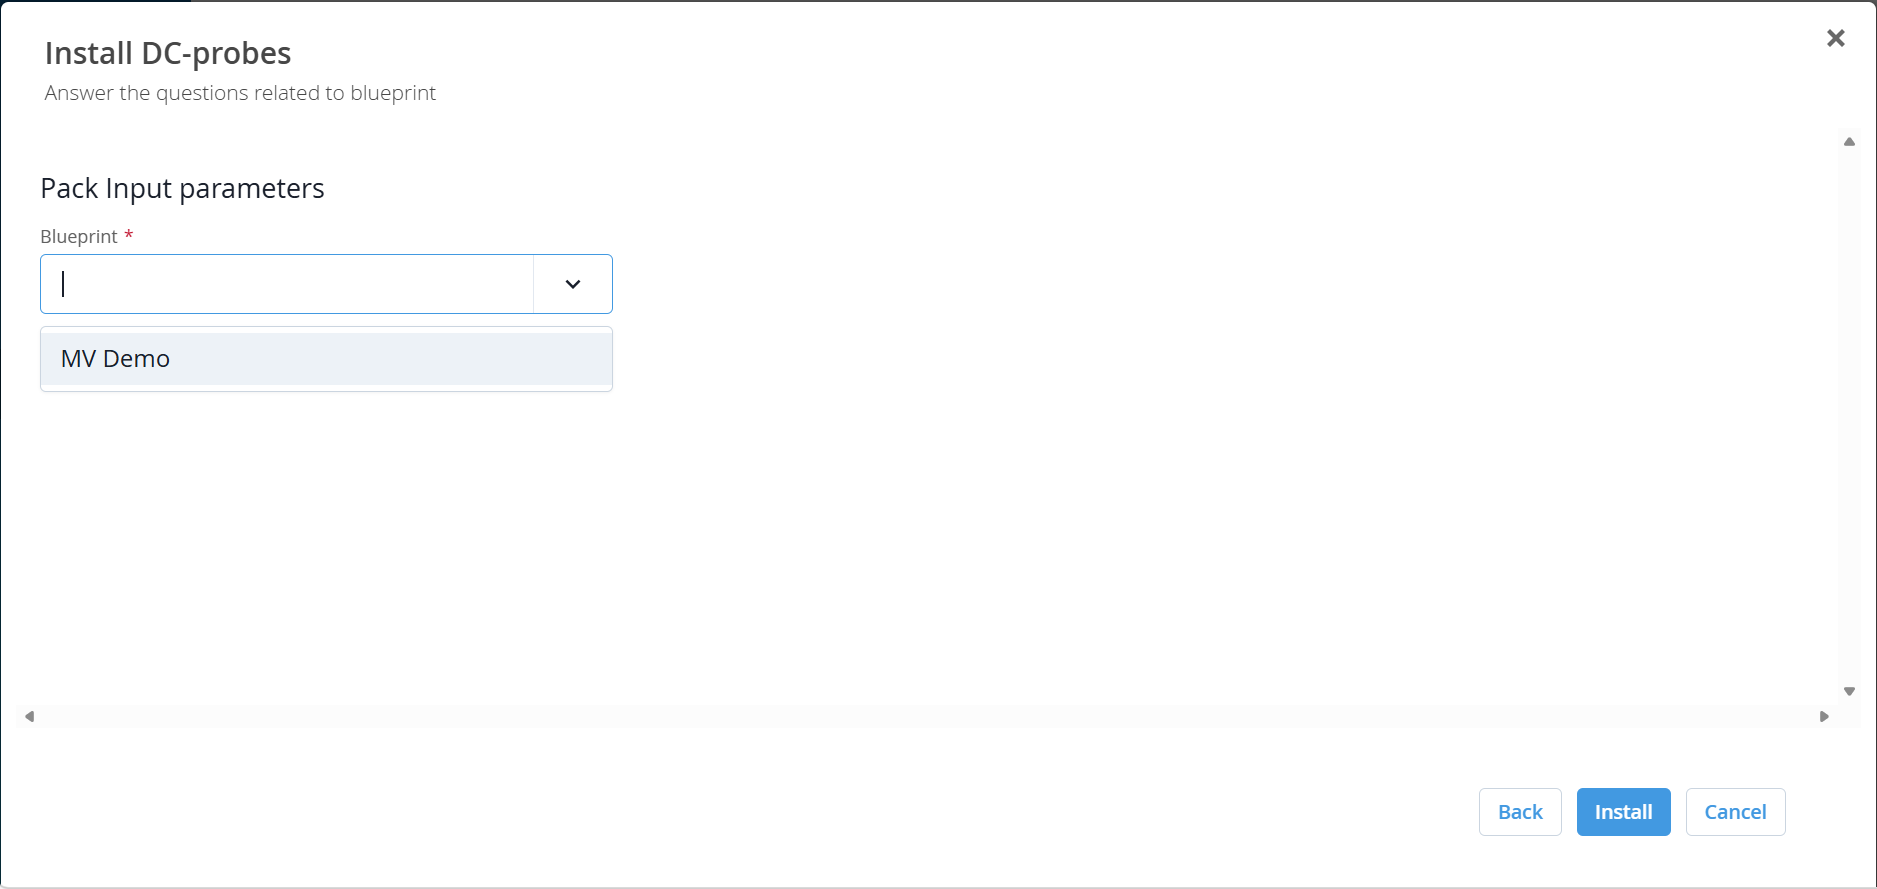
From the dropdown list, select the blueprint where you want the probe
installed, then click Install.
Figure 5: Select Blueprint