Offense Investigations
JSA uses rules to monitor the events and flows in your network to detect security threats. When the events and flows meet the test criteria that is defined in the rules, an offense is created to show that a security attack or policy breach is suspected. But knowing that an offense occurred is only the first step; identifying how it happened, where it happened, and who did it requires some investigation.
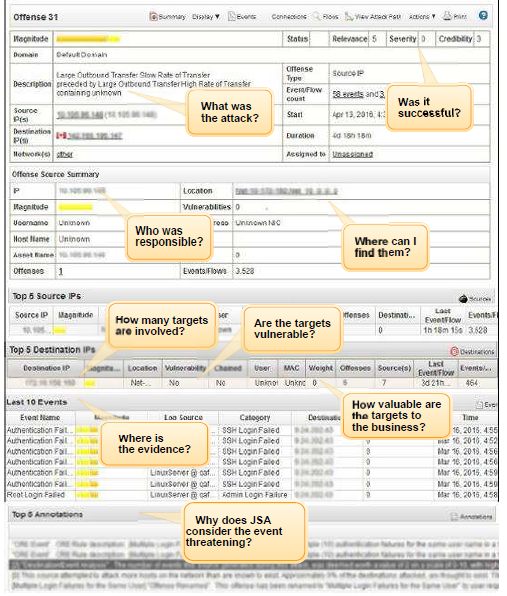
The Offense Summary window helps you begin your offense investigation by providing context to help you understand what happened and determine how to isolate and resolve the problem.
JSA does not use device level user permissions to determine which offenses each user is able to view. All users who have access to the network can view all offenses regardless of which log source or flow source is associated with the offense. For more information about restricting network access, see the security profiles documentation in the Juniper Secure Analytics Administration Guide.
Selecting an Offense to Investigate
Use the navigation options on the left to view the offenses from different perspectives. For example, select By Source IP or By Destination IP to view information about repeat offenders, IP addresses that generate many attacks, or systems that are continually under attack. You can further refine the offenses in the list by selecting a time period for the offenses that you want to view or by changing the search parameters.
You can also search for offenses that are based on various criteria. For more information about searching offenses, see Offense Searches.
-
Click the Offenses tab.
-
On the navigation menu, select the category of offenses that you want to view.
-
Depending on the category that you selected, you may be able to select the following filtering options:
-
From the View Offenses list, select an option to filter the list of offenses for a specific time frame.
-
In the Current Search Parameters pane, click Clear Filter links to refine the list of offenses.
-
-
To view all global offenses that are occurring on the network, click All Offenses.
-
To view all offenses that are assigned to you, click My Offenses.
-
To view offenses grouped on the high-level category, click By Category.
-
To view low-level category groups for a particular high-level category, click the arrow icon next to the high-level category name.
-
To view a list of offenses for a low-level category, double-click the low-level category.
Count fields, such as Event/Flow Count and Source Count do not consider the network permissions of the user.
-
-
To view offenses grouped by source IP address, click By Source IP.
The list of offenses displays only source IP addresses with active offenses.
-
Double-click the Source IP group that you want to view.
-
To view a list of local destination IP addresses for the source IP address, click Destinations on the Source page toolbar.
-
To view a list of offenses that are associated with this source IP address, click Offenses on the Source page toolbar.
-
-
To view offenses grouped by destination IP address, click By Destination IP.
-
Double-click the Source IP address group that you want to view.
-
To view a list of offenses that are associated with the destination IP address, click Offenses on the Destination page toolbar.
-
To view a list of source IP addresses associated with the destination IP address, click Sources on the Destination page toolbar.
-
-
To view offenses grouped by network, click By Network.
-
Double-click the Network that you want to view.
-
To view a list of source IP addresses associated with this network, click Sources on the Network page toolbar.
-
To view a list of destination IP addresses associated with this network, click Destinations on the Network page toolbar.
-
To view a list of offenses that are associated with this network, click Offenses on the Network page toolbar.
-
-
Double-click the offense to see additional information.
Use the information in the offense summary and details to investigate the offense and take necessary actions.
Investigating an Offense by Using the Summary Information
The Offense Summary window provides the information that you need to investigate an offense in JSA. The information that is most important to you during your investigation might be different, depending on the type of offense that you are investigating.
To make it easier for you to investigate an offense, the bottom of the Offense Summary page groups information about top contributors to the offense. These fields show only the most recent or most important pieces of information in that category. Many fields show more information when you hover the mouse over them. Some fields have right-click menu options.
-
Click the Offenses tab and double-click the offense that you want to investigate.
The Offense Summary window opens.
-
Review the first row of data to learn about the level of importance that JSA assigned to the offense.
Learn more about the magnitude rating:
Table 1: Magnitude Rating Details Parameter
Description
Magnitude
Indicates the relative importance of the offense. This value is calculated based on the relevance, severity, and credibility ratings.
Status
Hover your mouse over the status icon to see the status.
JSA does not display a status icon when an offense is active.
Relevance
Indicates the importance of the destination.
JSA determines the relevance by the weight that the administrator assigned to the networks and assets.
Severity
Indicates the threat that an attack poses in relation to how prepared the destination is for the attack.
Credibility
Indicates the integrity of the offense as determined by the credibility rating that is configured in the log source. Credibility increases as multiple sources report the same event. JSA administrators configure the credibility rating of log sources.
-
Review the information in the top portion of the Offense Summary window to learn more about the type of attack and the timeframe when it occurred.
Learn more about the offense information:
Table 2: Offense Information Parameter
Description
Description
Shows the cause of the offense.
Chained offenses show Preceded by, indicating that the offense changed over time as new events and flows were added to offense.
Offense Type
The offense type is determined by the rule that created the offense. The offense type determines what type of information is displayed in the Offense Source Summary pane.
Event/Flow count
To see the list of events and flows that contributed to the offense, click the Event or Flow links.
Source IP(s)
Specifies the device that attempts to breach the security of a component on your network. The device can have an IPv4 or IPv6 address.
Offenses of type Source IP always originate from only one source IP address. Offenses of other types can have more than one source IP address. You can see more information about the source IP address by hovering the mouse over the address, or by using right-click and left-click mouse actions.
Destination IP(s)
Specifies the network device that the source IP address attempted to access. The network device can have an IPv4 or IPv6 address.
If the offense has only one target, the IP address is displayed. If the offense has multiple targets, the number of local or remote IP addresses that were targeted. You can see more information by hovering the mouse over the address, or by using right-click and left-click mouse actions.
Start
Specifies the date and time when the first event or flow occurred for the offense.
Duration
Specifies the amount of time that elapsed since the first event or flow associated with the offense was created.
Network(s)
Specifies the local networks of the local destination IP addresses that were targeted. JSA considers all networks that are specified in the network hierarchy as local. The system does not associate remote networks to an offense, even if they are specified as a remote network or a remote service on the Admin tab.
-
In the Offense Source Summary window, review the information about the source of the offense.
The information that is shown in the Offense Source Summary window depends on the Offense Type field.
Learn more about the source summary information:
Table 3: Source Summary Information: Parameter
Description
Chained
Specifies whether the destination IP address is chained.
A chained IP address is associated with other offenses. For example, a destination IP address might become the source IP address for another offense. If the destination IP address is chained, click Yes to view the chained offenses.
Destination IP(s)
Specifies the network device that the source IP address attempted to access. The network device can have an IPv4 or IPv6 address.
If the offense has only one target, the IP address is displayed. If the offense has multiple targets, this field shows the number of local or remote IP addresses that were targeted. You can see more information by hovering the mouse over the address, or by using right-click and left-click mouse actions.
Location
Specifies the network location of the source or destination IP address. If the location is local, click the link to view the networks.
Magnitude
Specifies the relative importance of the source or destination IP address.
The magnitude bar provides a visual representation of the CVSS risk value of the asset that is associated with the IP address. Hover your mouse over the magnitude bar to display the calculated magnitude.
Severity
Specifies the severity of the event or offense.
Severity specifies the level of threat that an offense poses in relation to how prepared the destination IP address is for the attack. This value is directly mapped to the event category that correlates to the offense. For example, a Denial of Service (DoS) attack has a severity of 10, which specifies a severe occurrence.
Source IP(s)
Specifies the device that attempted to breach the security of a component on your network. The device can have an IPv4 or IPv6 address.
Offenses of type Source IP always originate from only one source IP address. Offenses of other types can have more than one source IP address. You can see more information about the source IP address by hovering the mouse over the address, or by using right-click and left-click mouse actions.
Username
Specifies the user name that is associated with the event or flow that created the offense.
Hover your mouse over the user name to see the most recent information in the asset model database for the user.
Events that do not include a user name in the payload, or system-generated events that belong to a local computer or a system account, show Unknown.
To access more information that is associated with a selected user name, right-click the user name for View Assets and View Events menu options.
Vulnerabilities
Specifies the number of identified vulnerabilities that are associated with the source or destination IP address. This value also includes the number of active and passive vulnerabilities.
When you view the summary information for historical offenses, the Last Known data fields are not populated.
-
In the bottom portion of the Offense Summary window, review additional information about the offense top contributors, including notes and annotations that are collected about the offense.
To see all the information that JSA collected in a category, click the links on the right side of the category heading.
Learn more about the information presented in the offense details:
Table 4: Offense Details Offense details category
Description
Last 5 Notes
Use notes to track important information that is gathered during the offense investigation. You can add a note to an offense, but you cannot edit or delete notes.
Top 5 Source IPs
Shows the top 5 IP addresses with the highest magnitude, which is where the suspected attack or policy breach originated.
Offenses that have only one source IP address show only one entry in the table.
Top 5 Destination IPs
Shows the top 5 local IP addresses with the highest magnitude, which might indicate the target of the attack. Offenses that target less than 5 local IP addresses show fewer entries in the table.
The Chained column indicates whether the destination IP address is the source IP address of another offense. A Yes in this column indicates that an attacker has control over the system with this IP address and is using it to attack other systems.
The Magnitude column shows the aggregate Common Vulnerability Scoring System (CVSS) score when it exists. When no CVSS score is available, the column shows the highest magnitude of all the offenses that the IP address is a part of.
When you hover the mouse over the destination IP address, the Destination Magnitude shows the CVSS score. When no CVSS score is available, a zero is displayed.
Top 5 Log Sources
Shows the log sources that contribute the most events to the offense.
The Custom Rule Engine (CRE) creates an event and adds it to the offense when the test criteria that is specified in the custom rule matches the incoming event. A log source that displays Custom Rule Engine in the Description field indicates that JSA created the events from that log source.
Total Events shows the sum of all the events received from this log source while the offense was active.
Top 5 Users
Events must include user information in order for JSA to populate this table.
Top 5 Categories
Shows the low-level categories that have the most events that contributed to the offense.
Local Destination Count shows the number of local destination IP addresses affected by offenses with events in the category. When all destination IP addresses are remote, this field shows 0.
Last 10 Events
Shows information about the last 10 events that contributed to the offense.
Last 10 Flows
Shows information about the last 10 flows that contributed to the offense.
The Total Bytes column shows the sum of the bytes transferred in both directions.
Annotations
Annotations provide insight into why JSA considers the event or observed traffic to be threatening.
JSA can add annotations when it adds events or flows to an offense. The oldest annotation shows information that JSA added when the offense was created. Users cannot add, edit, or delete annotations.
Last 5 Search Results
Shows information about the results from the last five scheduled searches.
-
If you installed JSA Risk Manager, click View Attack Path to see which assets in your network are communicating to allow an offense to travel through the network.
Investigating Events
An event is a record from a log source, such as a firewall or router device, that describes an action on a network or host. Events that are associated with an offense provide evidence that suspicious activity is happening on your network. By examining the event data, you can understand what caused the offense and determine how best to isolate and mitigate the threat.
Some events are created based on an incoming raw event, while others are created by the JSA Custom Rule Engine (CRE). Events that are created by JSA do not have a payload because they are not based on raw events.
-
In the Offense Summary window, click Events.
The List of Events window shows all events that are associated with the offense.
-
Specify the Start Time, End Time, and View options to view events that occurred within a specific time frame.
-
Click the event column header to sort the event list.
-
In the list of events, right-click the event name to apply quick filter options to reduce the number of events to review.
You can apply quick filters to other columns in the event list as well.
-
Double-click an event to view the event details.
The Event Information and the Source and Destination Information window show only the information that is known about the event. Depending on the type of event, some fields might be empty.
Learn more about the time fields on the Event Information:
Table 5: Time Fields on the Event Information: Field
Description
Start Time
The time that JSA received the raw event from the log source.
Storage Time
The time that JSA stored the normalized event.
Log Source Time
The time that is recorded in the raw event from the log source.
-
In the Payload Information box, review the raw event for information that JSA did not normalize.
Information that is not normalized does not appear in the JSA interface, but it may be valuable to your investigation.
For more information about how to use JSA to review event data, see Log Activity Monitoring and Searches.
Investigating Flows
JSA correlates flows into an offense when it identifies suspicious activity in network communications. The flow analysis provides visibility into layer 7, or the application layer, for applications such as web browsers, NFS, SNMP, Telnet, and FTP. A flow can include information such as IP addresses, ports, applications, traffic statistics, and packet payload from unencrypted traffic.
By default, JSA tries to extract normalized fields and custom flow properties from the first 64 bytes of flow data, but administrators can increase the content capture length to collect more data. For more information, see the Juniper Secure Analytics Administration Guide.
-
In the Offense Summary window, click Flows in the upper right menu.
The Flow List window shows all flows that are associated with the offense.
-
Specify the Start Time, End Time, and View options to view flows that occurred within a specific time frame.
-
Click the flow column header to sort the flow list.
-
In the list of flows, right-click the flow name to apply quick filter options to reduce the number of flows to review.
You can apply quick filters to other columns in the flow list as well.
-
Double-click a flow to review the flow details.
Learn more about the Flow Details:
Table 6: Flow Details Field
Description
Event Description
When the application is not identified in the payload, JSA uses built-in decoding to determine the application, and shows Application detected with state-based decoding in Event Description.
Source Payload and Destination Payload
Shows the size of the payload.
When the size exceeds 64 bytes, the payload might contain additional information that is not shown in the JSA interface.
Custom Rules Partially Matched
Shows rules for which the threshold value was not met, but otherwise the rule matched.
Flow Direction
Specifies the flow direction, where L indicates local network, and R indicates remote network.
For more information about how to use JSA to review flow data, see Network Activity Monitoring and Event and Flow Searches.