Rule Report Presentation
Fine-tune the report presentation so that it's easier to investigate and visualize the rules and building blocks. After you customize the report presentation, share the data results with others by creating CSV or XML reports.
To make it easier to see related data properties, click the tree structure icon to display the table view with groupable columns. The table must contain at least two of the following groupable columns: log source type, rule name, test, tactic, and technique. For example, you can group the table by the rules that are associated per log source type, or by the related rule names per reference set. The following rule tests are also groupable:
-
Reference set
-
Reference set (number of elements)
-
Network hierarchy
-
X-Force
-
Custom property
-
Domain
-
Reference data
-
MITRE
-
Content extension
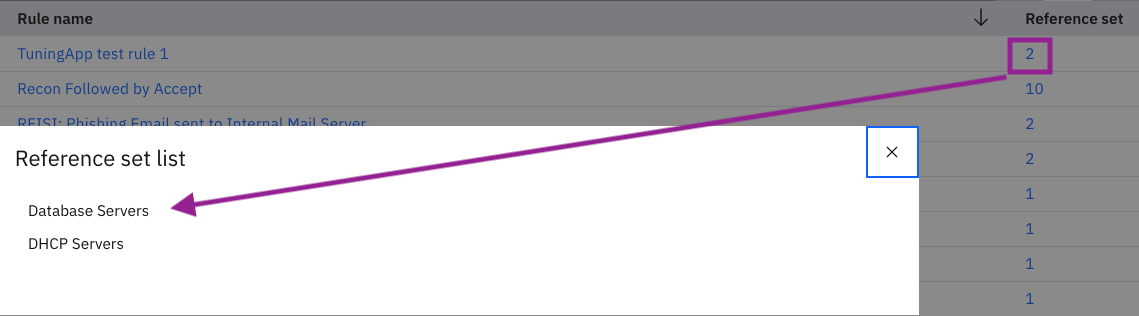
When you're investigating rules, grouping rule tables makes it easier to see related data properties. To switch to the grouped table mode, click the tree structure icon. In the grouped table mode, the table must contain at least two of the following groupable columns: log source type, rule name, test, tactic, and technique. Columns are grouped in the order that they are defined in the column list, which is available from the gear icon. You can also further customize the table groupings by clicking the arrow in the tree structure icon. Then, select from the groupable columns that are currently displayed or show only the number of child rows in the report instead of the actual rows. After you have the number of items in the report column, click the number to see the list of actual child items. For example, you have rule name and reference set columns in your report. You can see the number of reference sets per rule by clicking the number in the report to get the list of related references sets.
Change the column order in the list to change the grouped table display. All other non-groupable data properties that are in the table appear at the same level as the groupable columns. For example, rule creation date displays as a column in the same table as the rule name. At any time you can switch between the grouped and flat viewing modes, without losing your current results.
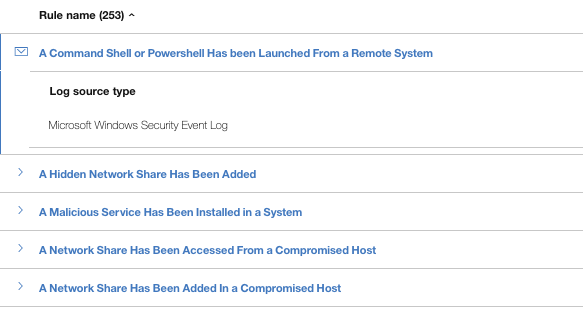
If the table contains two groupable columns, one nested level shows in the table. In the following image, the two groupable columns are rule name and log source type.
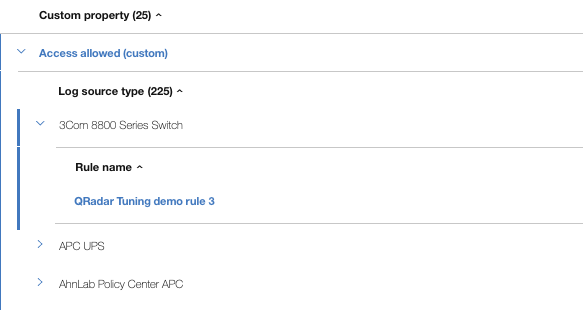
If the report contains three groupable columns, two nested levels show in the table. In the following image, the three groupable columns are custom property, log source type, and rule name.
If there are more than three groupable columns, beginning with the third column, all of them display in a flat table on a second nested level. There can be no more than two nested levels.
Downloading the Report
When you finish fine-tuning the report data, you can download the rule report as a CSV or XML file to share with colleagues and managers. You can also visualize the grouped content by clicking the eye icon.
To export or import the rule mappings or to export only the rules that display in the current view of the report, use the options in the ATT&CK Actions menu. The mappings are exported in JSON format.