Verifying that the Network Insights Appliance is Receiving Raw Packet Data
SUMMARY Follow these steps to verify that Network Insights appliance is receiving raw packet data from the network tap or span port.
- Ensure that the appliance is cabled correctly.
- If your appliance uses a traditional network card, use
tcpdumpto verify that the traffic is reaching the network interface:tcpdump -ni <interface_name>
For example, type
The results might look similar to this example:tcpdump -ni ens3f0 -c 5to capture on ens3f0 and stop after 5 packets.Figure 1: Results of tcpdump capture command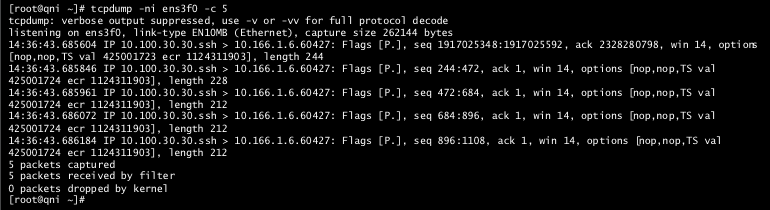
- If your appliance uses a Napatech network interface card, type the following command to
verify that the traffic is reaching the network interface:
/opt/napatech3/bin/monitoring
Figure 2: Napatech Monitor with SFP Type, Link Status, and Transmission (Tx) Values.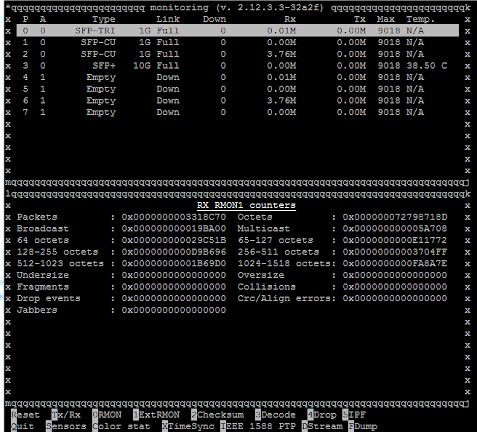 If there is no traffic that is displayed, check the Link column to see if the status is Down.