
Impact Analysis Overview
Impact Analysis Overview
The Impact Analysis feature combines Apstra's intent-based analytics (IBA) with network service visibility. The Impact Analysis page on Data Center Assurance provides a visual representation of the network infrastructure in real time with the following information:
- how nodes in the data center are connected to the clients
- what path the service traffic takes
- how the application traffic is handled
- how an anomaly in a node in the data center can impact application traffic.
Whenever an event occurs in the data center, Apstra generates several anomalies, which might include subsequent events triggered by an earlier anomaly. The main anomaly that triggered the related events is identified as the key anomaly. For example, when a port on a switch goes down, the event might generate various related anomalies like interface issues, cabling issues, route issues, and so on.
The Impact Analysis feature uses knowledge graphs to correlate events to issues in the data center network and then maps those issues to the potential impact on the applications that are utilizing the network. Instead of displaying several anomalies and causing alert fatigue, the Impact Analysis feature lets you view the key anomaly and the impacted devices in the topology diagram.
To view the Impact Analysis page, navigate to Assurance > Impact Analysis.
The Anomalies tab in the right pane of Data Center Assurance displays the current anomalies that occurred in the network along with their start time. Expand a key anomaly to view the detailed list of associated anomalies, symptoms, affected devices, interfaces, services, Virtual Networks, and VRFs. Select an anomaly to highlight the affected node in the topology diagram.
When you select a Link Status Mismatch anomaly, the affected node will not be highlighted on the topology diagram. It will only be listed in the anomaly details.
The Impact Analysis feature thus enables the administrators to quickly identify the root cause of an issue and resolve it so that the related anomalies also might get resolved. This helps network administrators reduce the mean time to resolution (MTTR), which in turn helps improve application user experience.
The Impact Analysis feature can support up to 10,000 active anomalies for a particular site at any given time. If the active anomaly count exceeds this limit, the feature pauses monitoring newly raised anomalies in the site until some anomalies are resolved and the active anomaly count goes down.
Figure 1 shows the Impact Analysis page displaying how the nodes in the data center network are connected to the clients and how an anomaly in a data center device can impact the clients.
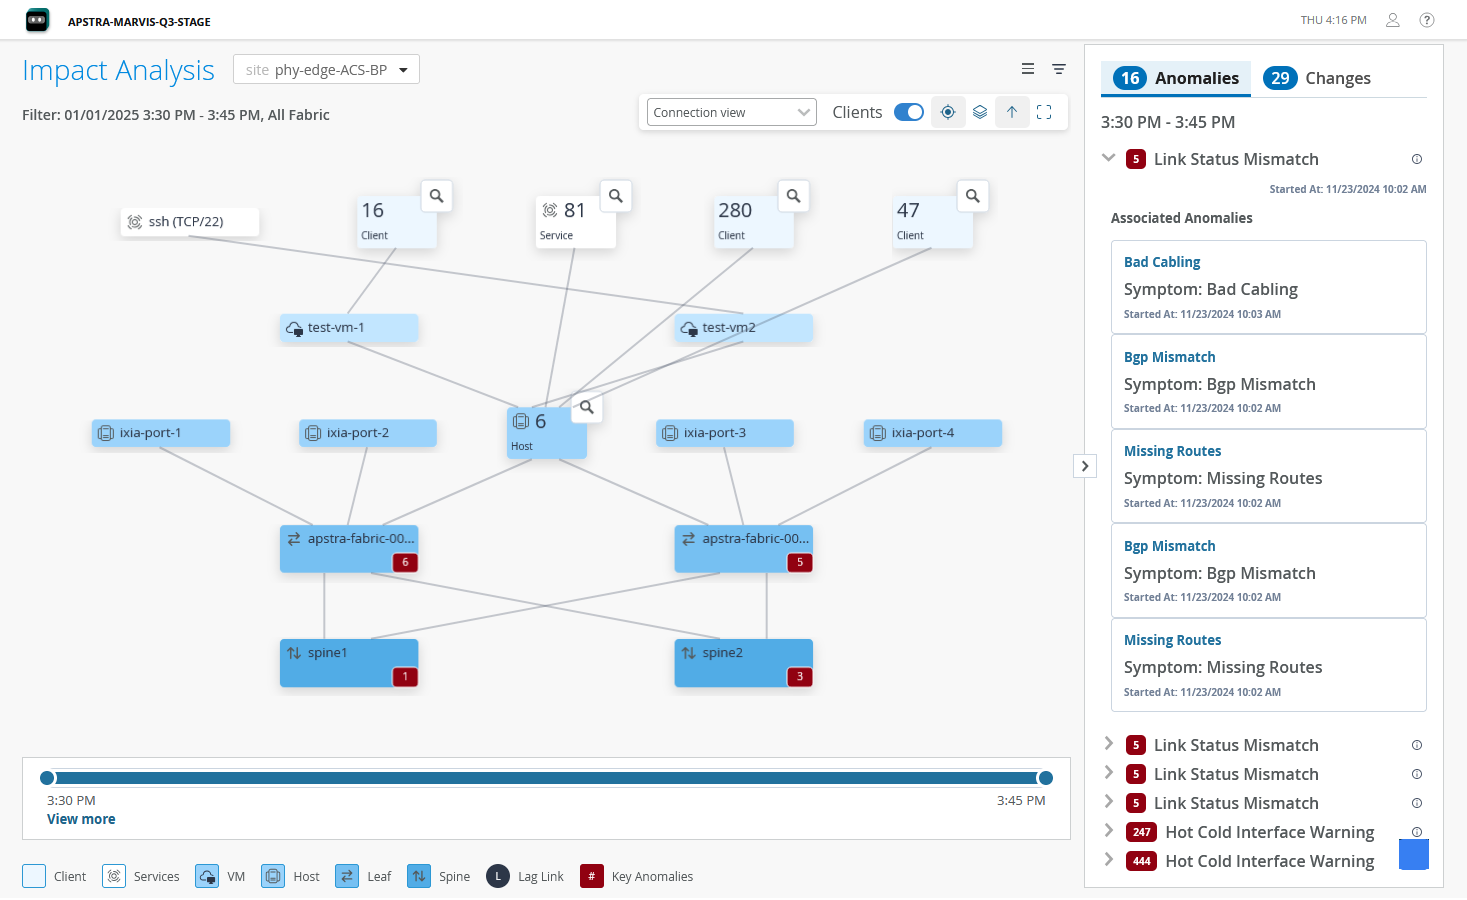
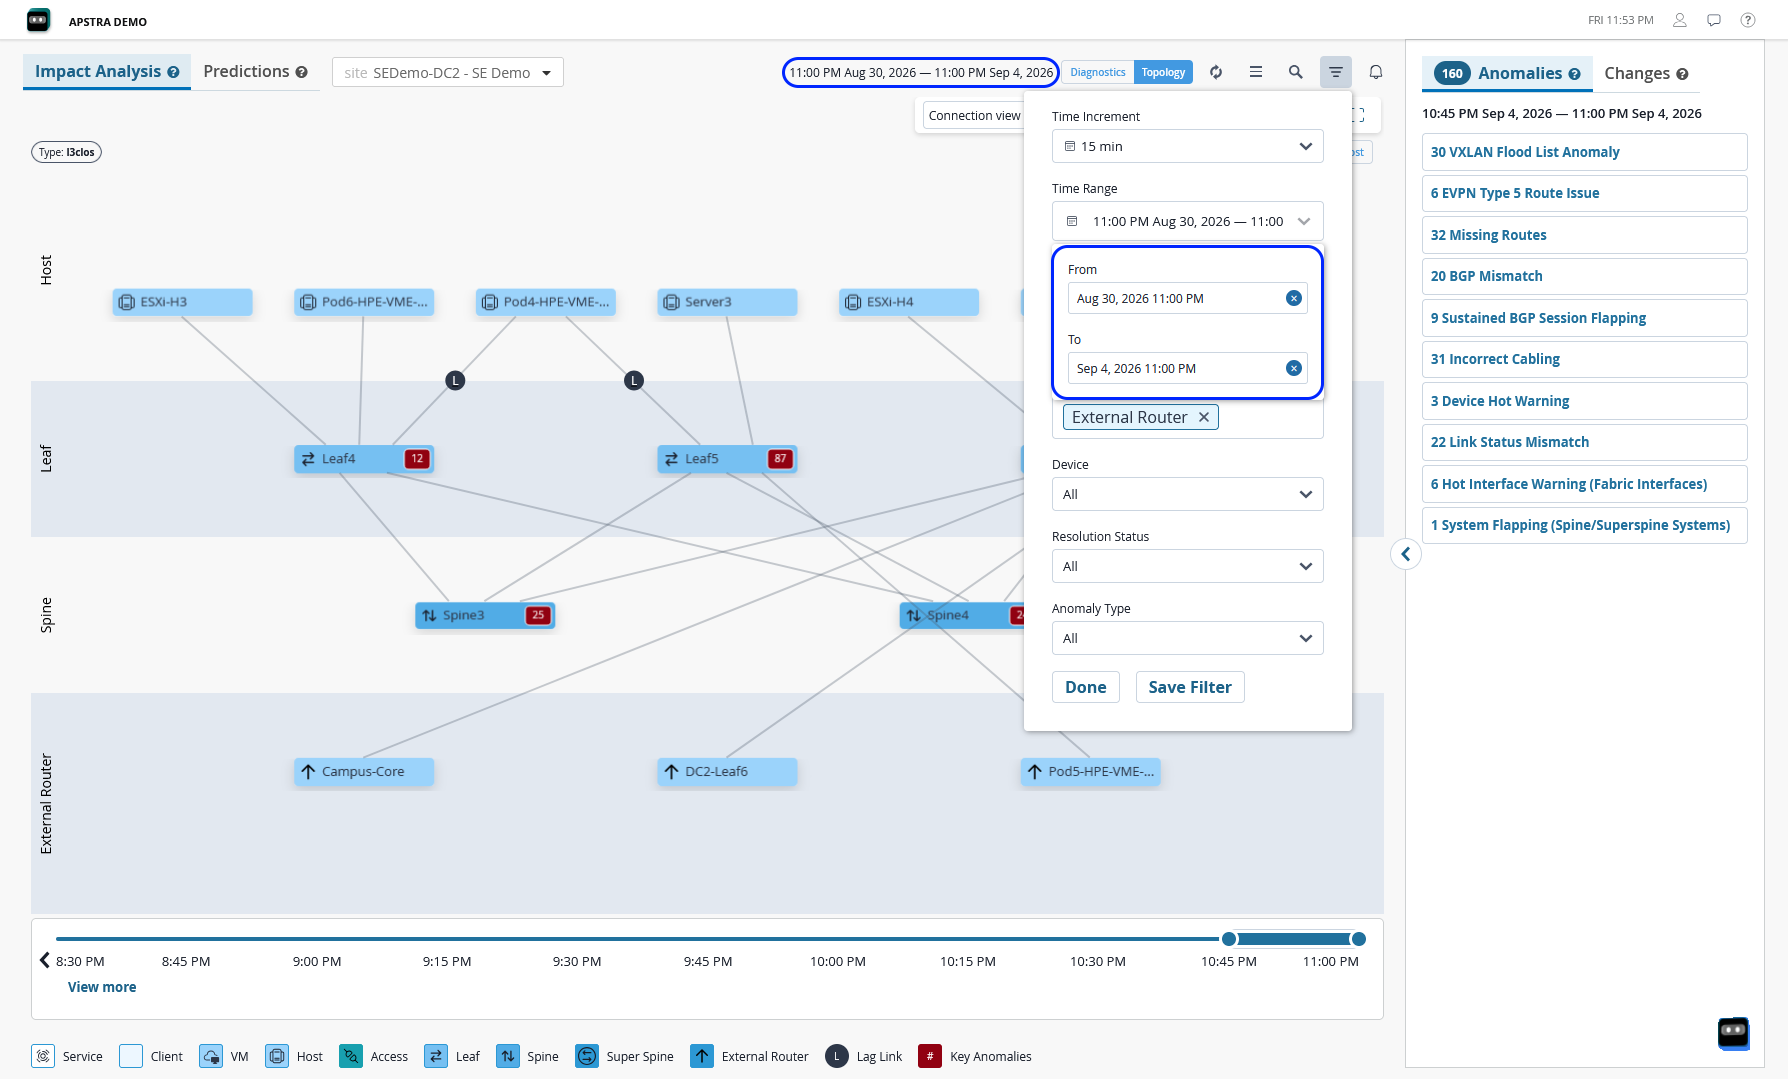
You can also use the filter on the page to examine how a specific service performed during a specific time period. The Changes tab displays the changes in the network topology that occurred in the given time period, such as addition or removal of a device. Click the Reset icon to refresh and view current data.
Simulate Failure Scenarios
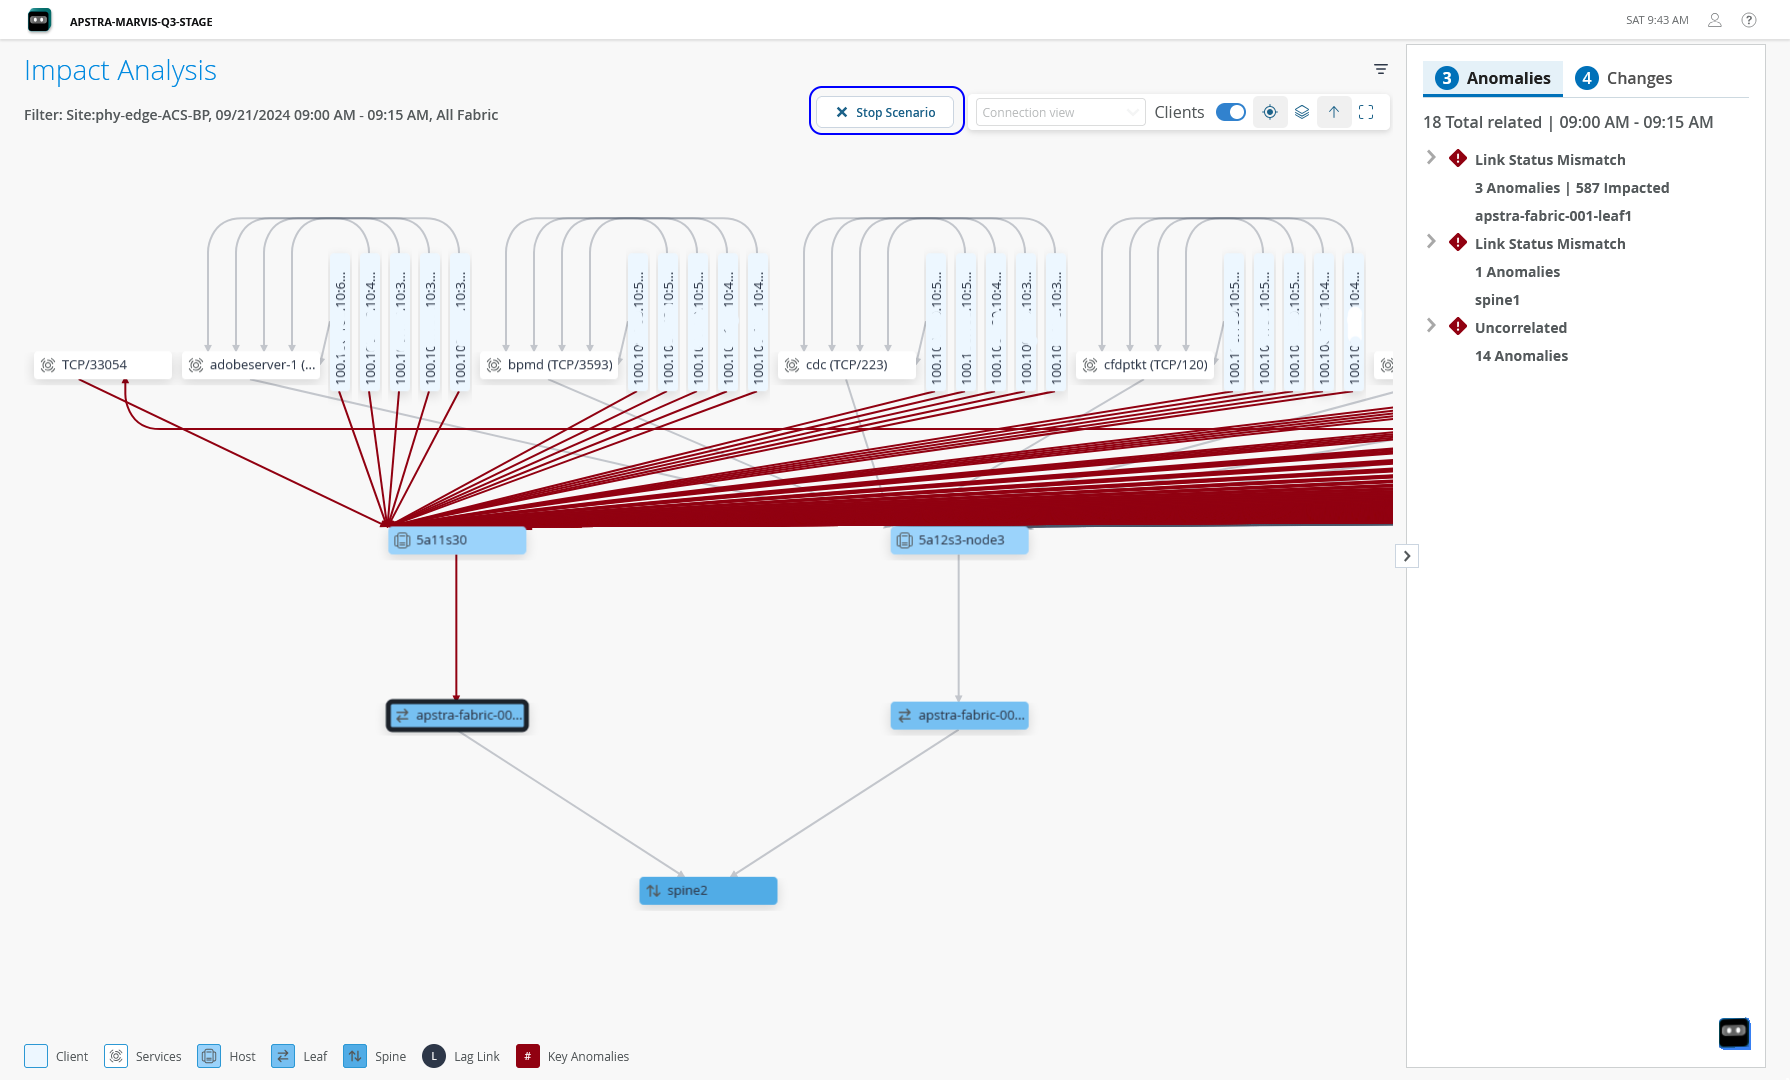
Using the Impact Analysis feature, you can also simulate failure scenarios to identify potential impact of an issue in the data center network. You just need to select a device in the network and click Fail Scenario. Data Center Assurance generates a visualization of how clients and services will be impacted if an issue occurs in the device. Thus, network administrators can use the Impact Analysis feature to analyze the impact of a network issue, and also to identify which component in the network is causing issues to the application traffic. Instead of providing generic solutions to troubleshoot issues, the Impact Analysis feature helps administrators to pinpoint specific issues in the data center network that affect application user experience.
Figure 2 shows how an issue
in the device apstra-fabric-001-leaf1 can impact the clients that
are connected to it.
View Device Details
In addition to this information, you can also view details of specific nodes in the topology. Click a node to view details of the node in the right pane. The displayed information includes CPU and memory utilization, along with details of transmitted and received packets on each interface of the device as shown in Figure 3.
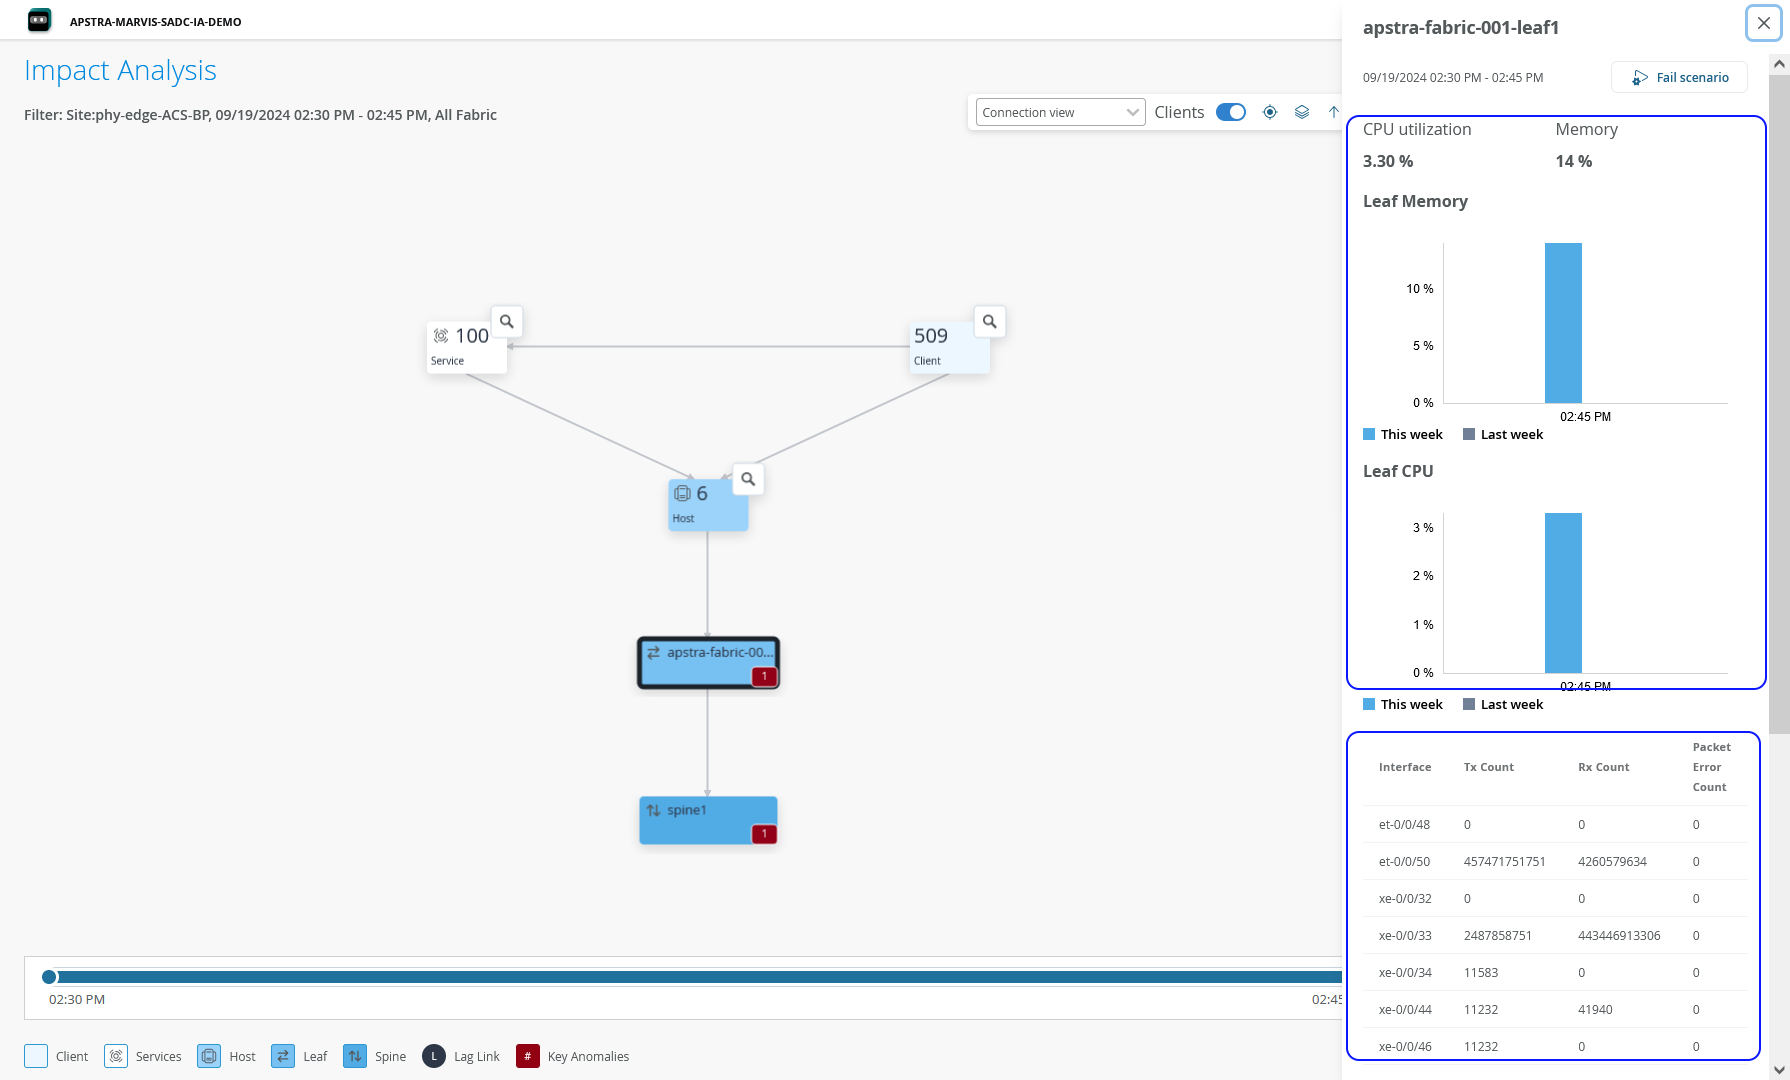
You must import the DC-Probes pack from DC Hub on each blueprint in the Data Center Director instance to enable streaming of CPU and memory utilization data to Data Center Assurance. For information on pack installation, see DC Hub Overview.
Benefits of Impact Analysis
The Impact Analysis page provides the following benefits:
-
Enables administrators to map application issues to issues in the data center network in real time, enabling faster resolution issues minimizing the impact on end user experience.
-
Helps reduce the MTTR of data center issues, enhancing end user experience.
-
Helps quickly identify the potential impact of network events on clients and services utilizing the network.