
Analyze Sustainability Data With Marvis AI Assistant
Learn how to analyze sustainability data using Marvis AI Assistant in Data Center Assurance.
Marvis AI Assistant (Marvis) is an AI-enabled conversational interface that helps you analyze sustainability data using natural language.
Marvis uses agentic AI to analyze sustainability data across your organization, sites, and devices and provides energy observability, insights, recommendations, and reporting. So instead of manually reviewing dashboards and correlating metrics across multiple views, you can ask sustainability-related questions to Marvis and receive intelligent, contextual insights directly in the conversation.
The sustainability agent is available only for sustainability-enabled organizations.
Marvis provides a conversational interface for exploring sustainability data. You can ask sustainability-related questions, and Marvis retrieves relevant information, presents it in different formats, and helps you explore available metrics and insights. Based on the available sustainability data, Marvis can highlight potential savings opportunities, suggest a phased optimization roadmap, and recommend follow-up questions to help you continue your investigation. It can also generate sustainability reports, executive summaries, visualizations, and downloadable PDF reports directly within the conversation. This provides a simple and efficient way to access, review, and share sustainability information through a single conversational interface.
To use Marvis, click the Marvis icon at the lower right corner of the UI.

Guidelines to Write Prompts
We recommend that you follow these guidelines to get the most relevant results from Marvis:
-
Be specific about what you want to know. Clearly describe the question, issue, or objective.
-
Clearly define the scope of your query by specifying the organization, site, device, or time period.
If your query does not include a time period, Marvis mentions the default time range it used in its response.
-
Ask one primary question at a time. Use follow-up questions to refine and expand your investigation.
-
Specify the type of result you want. For example, insights, recommendations, comparison, forecasts, reports, or visualizations.
Sustainability Agent Use Cases and Sample Prompts
The following sections describe how you can analyze sustainability data using Marvis:
- Gain Visibility into Sustainability Performance of Your Network
- Review Energy Saving Opportunities
- Identify and Prioritize Optimization Opportunities
- Generate Sustainability Reports and Track SBTi Targets
- Perform Custom Sustainability Analysis
- Manage Sustainability Planning
- Generate Intent-Driven Visualizations
Gain Visibility into Sustainability Performance of Your Network
You can monitor energy consumption, carbon emissions, energy costs, and utilization across your organization, sites, and devices. Marvis helps you identify trends, compare sustainability metrics, and understand how energy usage changes over time.
Sample prompts:
Which site is consuming the most power?
Which device is consuming the most power in site x?
Provide the fan stats for device x in site y.
Provide the sensor stats for device x in site z.
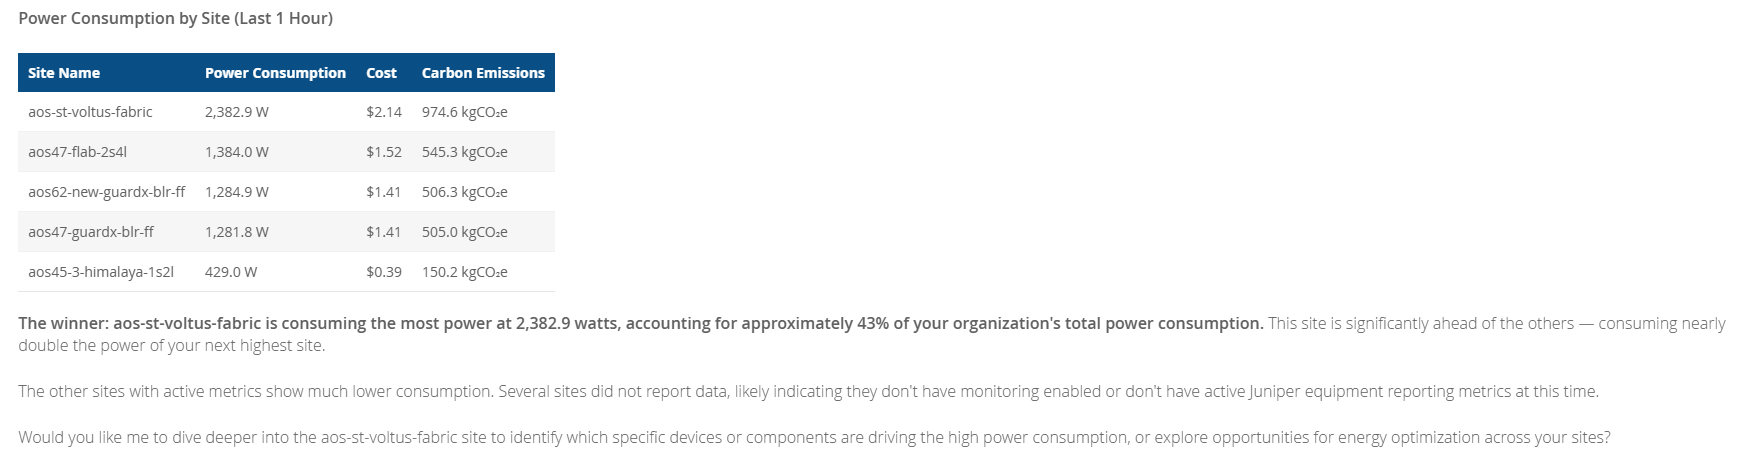
Figure 1 shows the sample response for the prompt: Which site is consuming the most power?
Review Energy Saving Opportunities
You can review the forecasted energy savings potential for the organization, sites, and devices. Marvis correlates energy metrics, operational telemetry, utilization data, and configuration information to provide insights on the feasible energy optimization opportunities.
Sample prompts:
Provide energy savings summary for site x.
Provide site savings summary by recommendation type for site x.
Provide device level savings summary for device x in site y.
Identify and Prioritize Optimization Opportunities
You can easily discover opportunities to reduce energy consumption, lower operational costs, and decrease emissions using Marvis. Marvis analyzes energy usage patterns, identifies underutilized resources, quantifies savings opportunities, and recommends actions based on projected impact.
Sample prompt:
Provide energy optimization recommendations for device x in site y.
When you ask this question, Marvis analyzes energy consumption and utilization data for the device, recommends optimization actions such as disabling unused ports, estimates potential energy, cost, and emissions reductions. You also get a phased optimization roadmap that includes short-term and long-term actions and suggests follow-up questions for deeper analysis, such as generating visualization of these recommendations, pull real-time device telemetry, or compare optimization opportunities across sites and devices.
Generate Sustainability Reports and Track SBTi Targets
You can generate sustainability reports, executive summaries, and compliance-focused reports while monitoring progress against sustainability objectives and carbon reduction goals.
Sample prompts:
Provide the network sustainability (SBTI) report for this organization.
Provide the network sustainability (SBTI) report for site x.
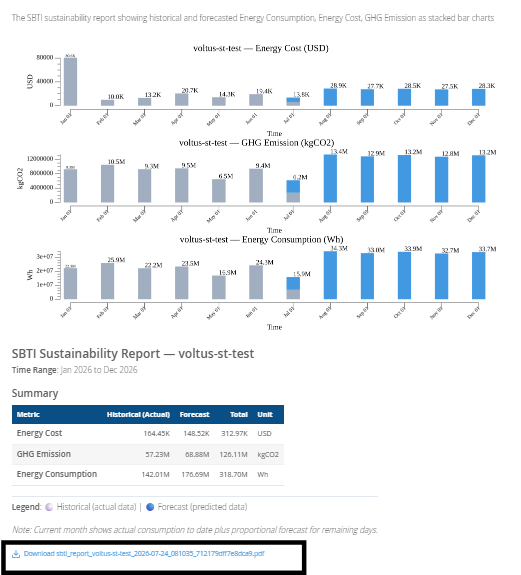
When you ask such questions, Marvis generates a detailed sustainability report directly within the conversation, summarizing energy consumption, energy costs, GHG emissions, and energy savings for the mentioned reporting period.
The report presents the findings through visualizations and tabular summaries to help you effectively analyze and communicate sustainability performance. The report can also be exported as a PDF for sharing and reporting purposes.
Perform Custom Sustainability Analysis
You can analyze sustainability data using natural language, even when the information is not available through existing dashboards or predefined views. Marvis can retrieve and correlate data based on your intent, enabling flexible analysis across sites, devices, metrics, and time ranges.
Sample prompt:
Compare the sensor stats for device x and device y in site z for the past 24 hours.
When you ask this question, Marvis retrieves and analyzes sensor data from the devices for the past 24 hours that may not be available through existing dashboards. It identifies trends, provides comparisons, and suggest follow-up questions for deeper analysis.
Sample prompt:
Compare the energy efficiency of Site x and Site y.
When you ask this question, Marvis compares energy consumption, emissions, utilization, and efficiency metrics across both sites, highlights significant differences, identifies optimization opportunities, and explains the factors affecting overall efficiency.
Manage Sustainability Planning
You can manage Sustainability Planning using Marvis. Use Marvis to create, view, and delete sustainability goals, and track goal progress. For more information on sustainability planning, see Define and Achieve Your Sustainability Goals.
Sample Prompts:
-
Create a goal with recommended values
Create a sustainability goal for Q4 2026 with the recommended values.
-
Create a goal with a custom target
Create a sustainability goal for Q4 2026 with a custom target.
-
View projected consumption for a quarter
What is the projected energy consumption for the current quarter?
-
View potential savings from all recommendations
How much can we save in the current quarter by applying all available recommendations?
-
View potential savings from a specific recommendation
How much can we save in the current quarter by applying the SHUTDOWN_UNUSED_PORT recommendation?
Generate Intent-Driven Visualizations
You can generate visualizations dynamically based on your question instead of relying on predefined sustainability charts and dashboards. Marvis can create the most appropriate visualization for your sustainability requirements.
Benefits of Using Marvis to Analyze Sustainability Insights
Use Marvis to:
-
Ask questions in natural language instead of manually reviewing dashboards and correlating metrics across multiple views.
-
Reduce investigation time by allowing Marvis to perform multi-step analysis on your behalf.
-
Leverage AI-assisted troubleshooting to identify the causes of energy inefficiencies, anomalies, cost increases, and emissions spikes.
-
Discover energy-saving opportunities and their potential impact without performing manual analysis.
-
Access forecasts, savings projections, and sustainability reports through a conversational experience.
-
Create, view, and delete sustainability goals, and track goal progress.
-
Accelerate decision-making with targeted recommendations and optimization roadmaps.
-
Analyze sustainability data beyond predefined dashboard views using intent-driven queries and visualizations.
-
Generate reports and visualizations with simple natural language prompts.