
Topology or Applications Missing in App Aware
Problem
After onboarding, the App Aware page doesn't show data center topology, applications, or services.
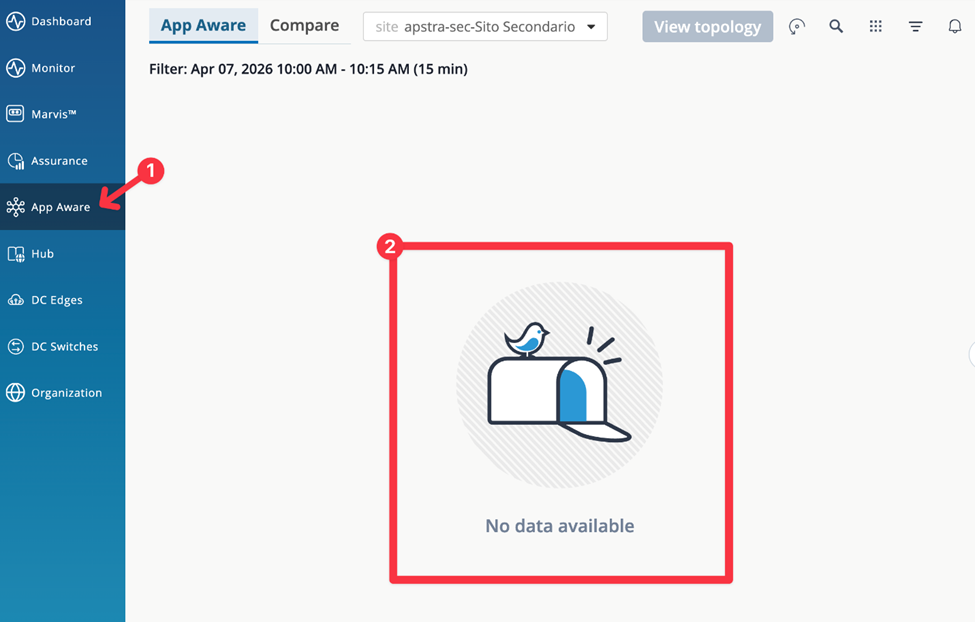
Verify Flow Server Interface Naming in Apstra Data Center Director
If you see index interfaces as shown in Figure 2 in Apstra Data Center Director, then SNMP enrichment is either not configured or not running.
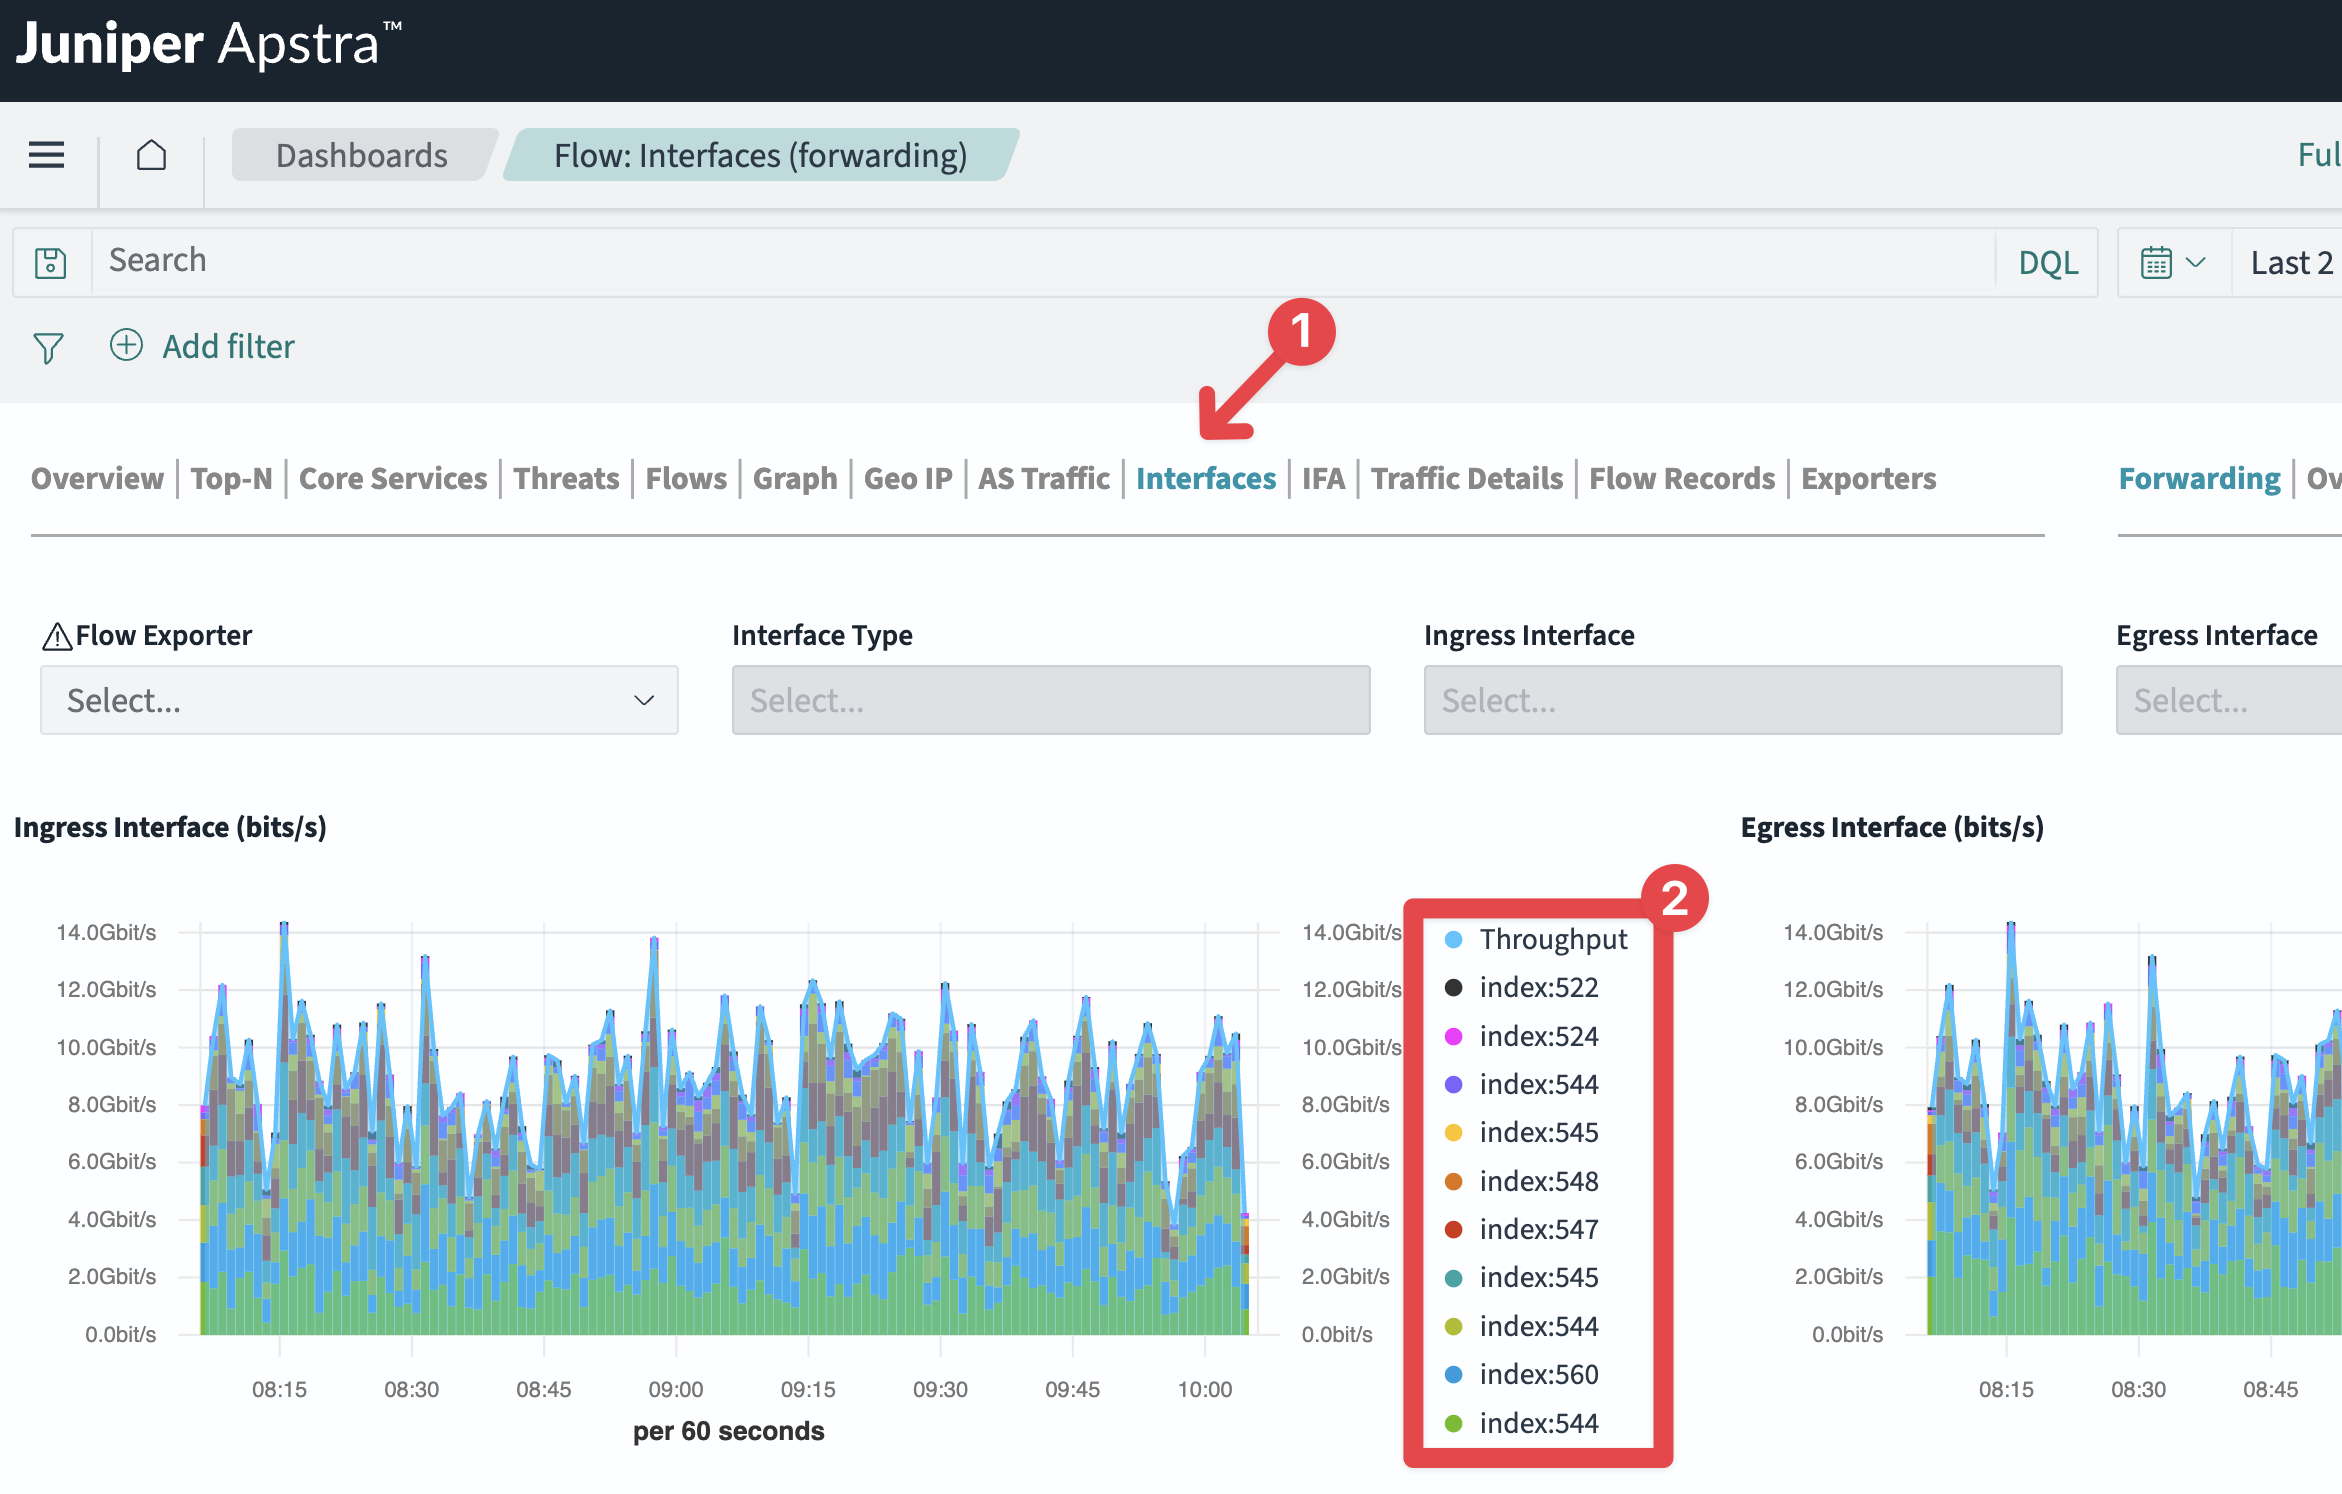
Refer the table below to identify the likely cause and resolve the issue.
| Symptom | Likely Cause | Resolution |
|---|---|---|
| App Aware shows no services or topology after onboarding | sFlow data is not reaching the Apstra Flow server, or the Flow server is not configured in the Apstra Edge adoption. | Confirm the Flow Data Configlet is deployed and committed in the blueprint, and that the collector IP in the property set points to the correct Flow server IP. Verify the Flow Server Details were entered when adopting the Edge in Data Center Assurance. Check the flowcoll service is running on the Flow server: sudo systemctl status flowcoll |
| App Aware shows topology but no applications or services | sFlow sampling is configured but interfaces are not included, or sample rate is too high. | Review the Flow Data Configlet configuration in Apstra. Confirm that interfaces are included in the sFlow interface list and the sample rate is appropriate for your traffic volumes. |
| Topology and applications appear after a delay | This is expected behavior. Flow data takes a few minutes to populate after the Edge first connects. | Wait 5–10 minutes after completing onboarding before concluding that data is missing, then refresh the App Aware page. |
Verify SNMP Enrichment is Enabled
- Confirm the devices have the SNMP configlet deployed.
- Verify the SNMP community string in the enrichment configlet matches the read-only community configured on your network devices.
Check the Flow server logs for SNMP query errors:
cat /var/log/juniper/flowcoll/flowcoll.log | grep -i snmp
If you see SNMP authentication or timeout errors, verify that:
The community string is correct.
Network connectivity exists between the Flow server and your devices is possible.
SNMP is enabled on your network devices.
Verify Time and Date Information
If data center application information is not appearing correctly or is missing from Data Center Assurance, the reason could be time synchronisation mismatches between the Apstra Flow server, Apstra VM, and Data Center Assurance. This can cause timestamp misalignment across data sources, preventing accurate correlation and visualisation of data.
- Connect to the Apstra Flow server via SSH and check the system time:
date
- Connect to the Apstra VM and verify its system time matches:
date
Both systems should show the same time (within a few seconds). If they differ significantly from the UTC time and date, synchronise them using Network Time Protocol (NTP). Ensure both VMs are connected to the same NTP server and that the time difference is resolved before troubleshooting other issues.
Time synchronisation issues are a common cause of data visualisation problems in Data Center Assurance. Always verify that all systems are synchronised to the correct time when troubleshooting missing or misaligned data.