Service Monitoring from the UI
Ceph Monitoring
Ceph is a unified, distributed storage system that provides object storage and block storage. Contrail Insights monitors Ceph performance, availability, and usage, with both charts and alarms.
In addition, Contrail Insights Agent can be installed on the Ceph object storage daemon (OSD) and monitor hosts, for real-time health and performance monitoring of the storage hosts that power a Ceph storage cluster.
Ceph Service Monitoring
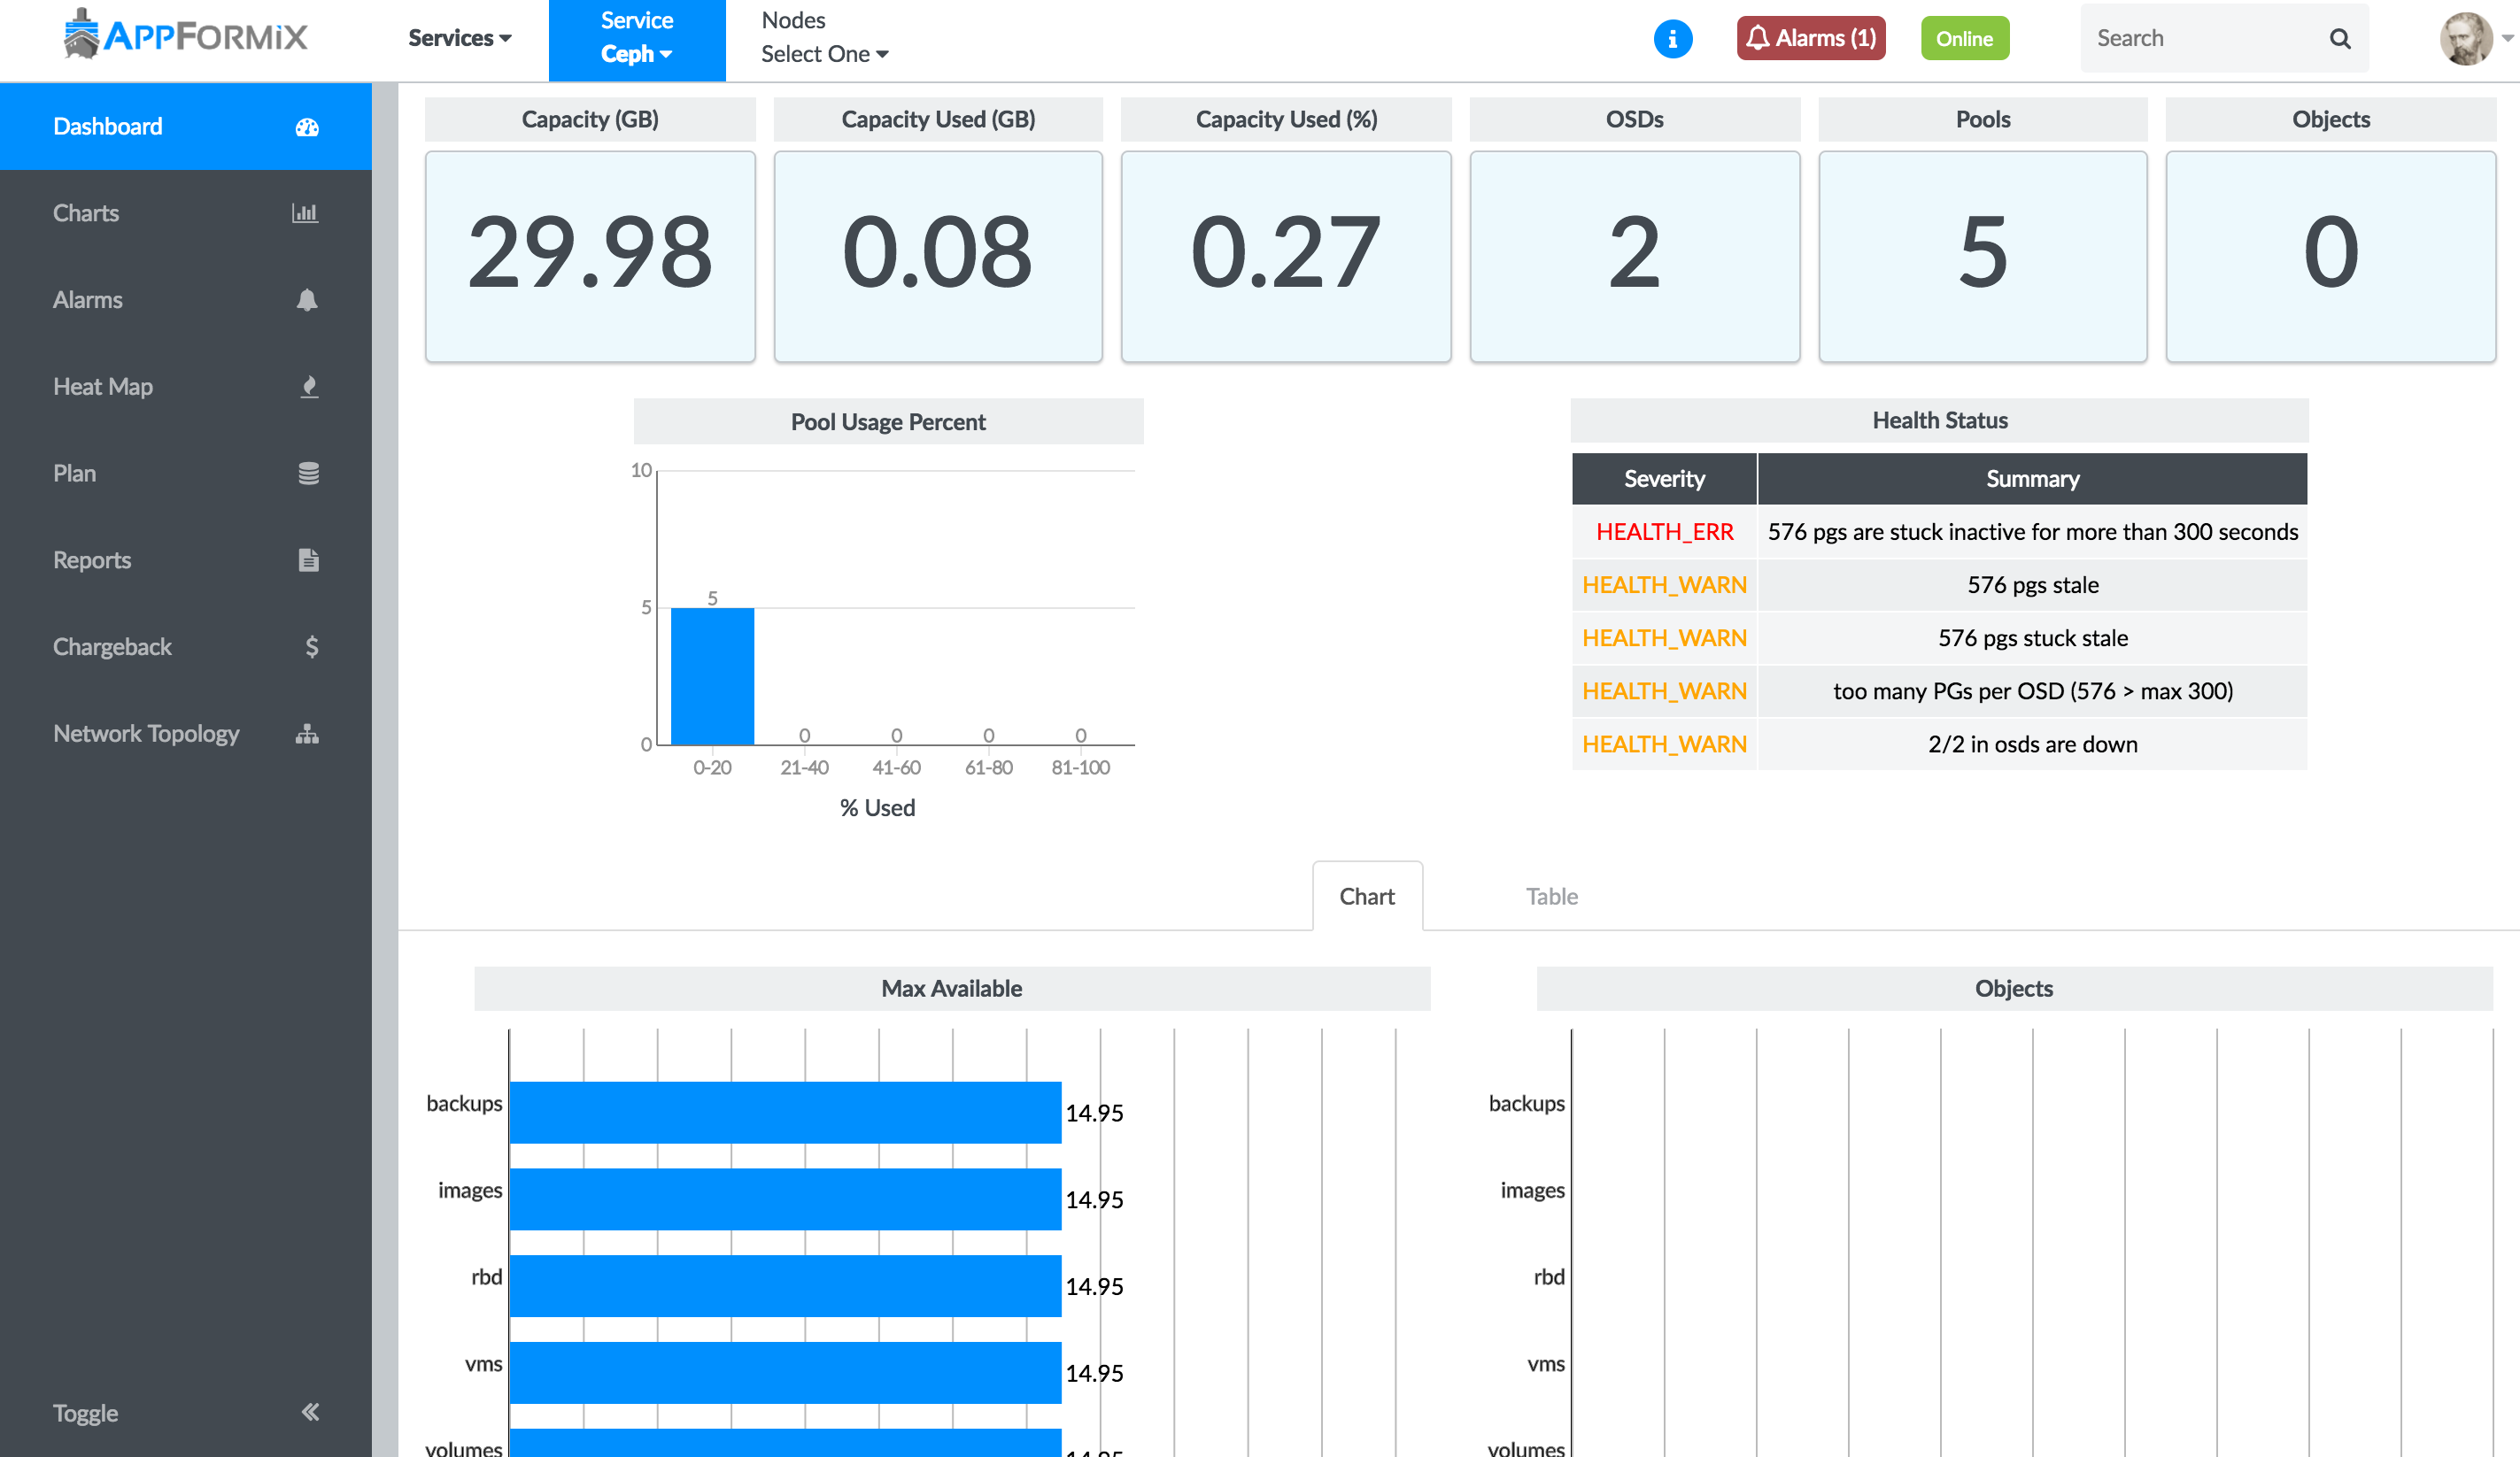
From the context menu, select Services > Ceph. The Ceph service monitoring page displays a summary of the current usage of a Ceph cluster, including total cluster capacity, used capacity, and number of OSDs, pools, objects. The Health Status table displays errors and warnings of your Ceph cluster. Details about usage of each storage pool are shown in table and chart views.
Figure 1 shows the Ceph service monitoring page and storage pool usage details in a table.
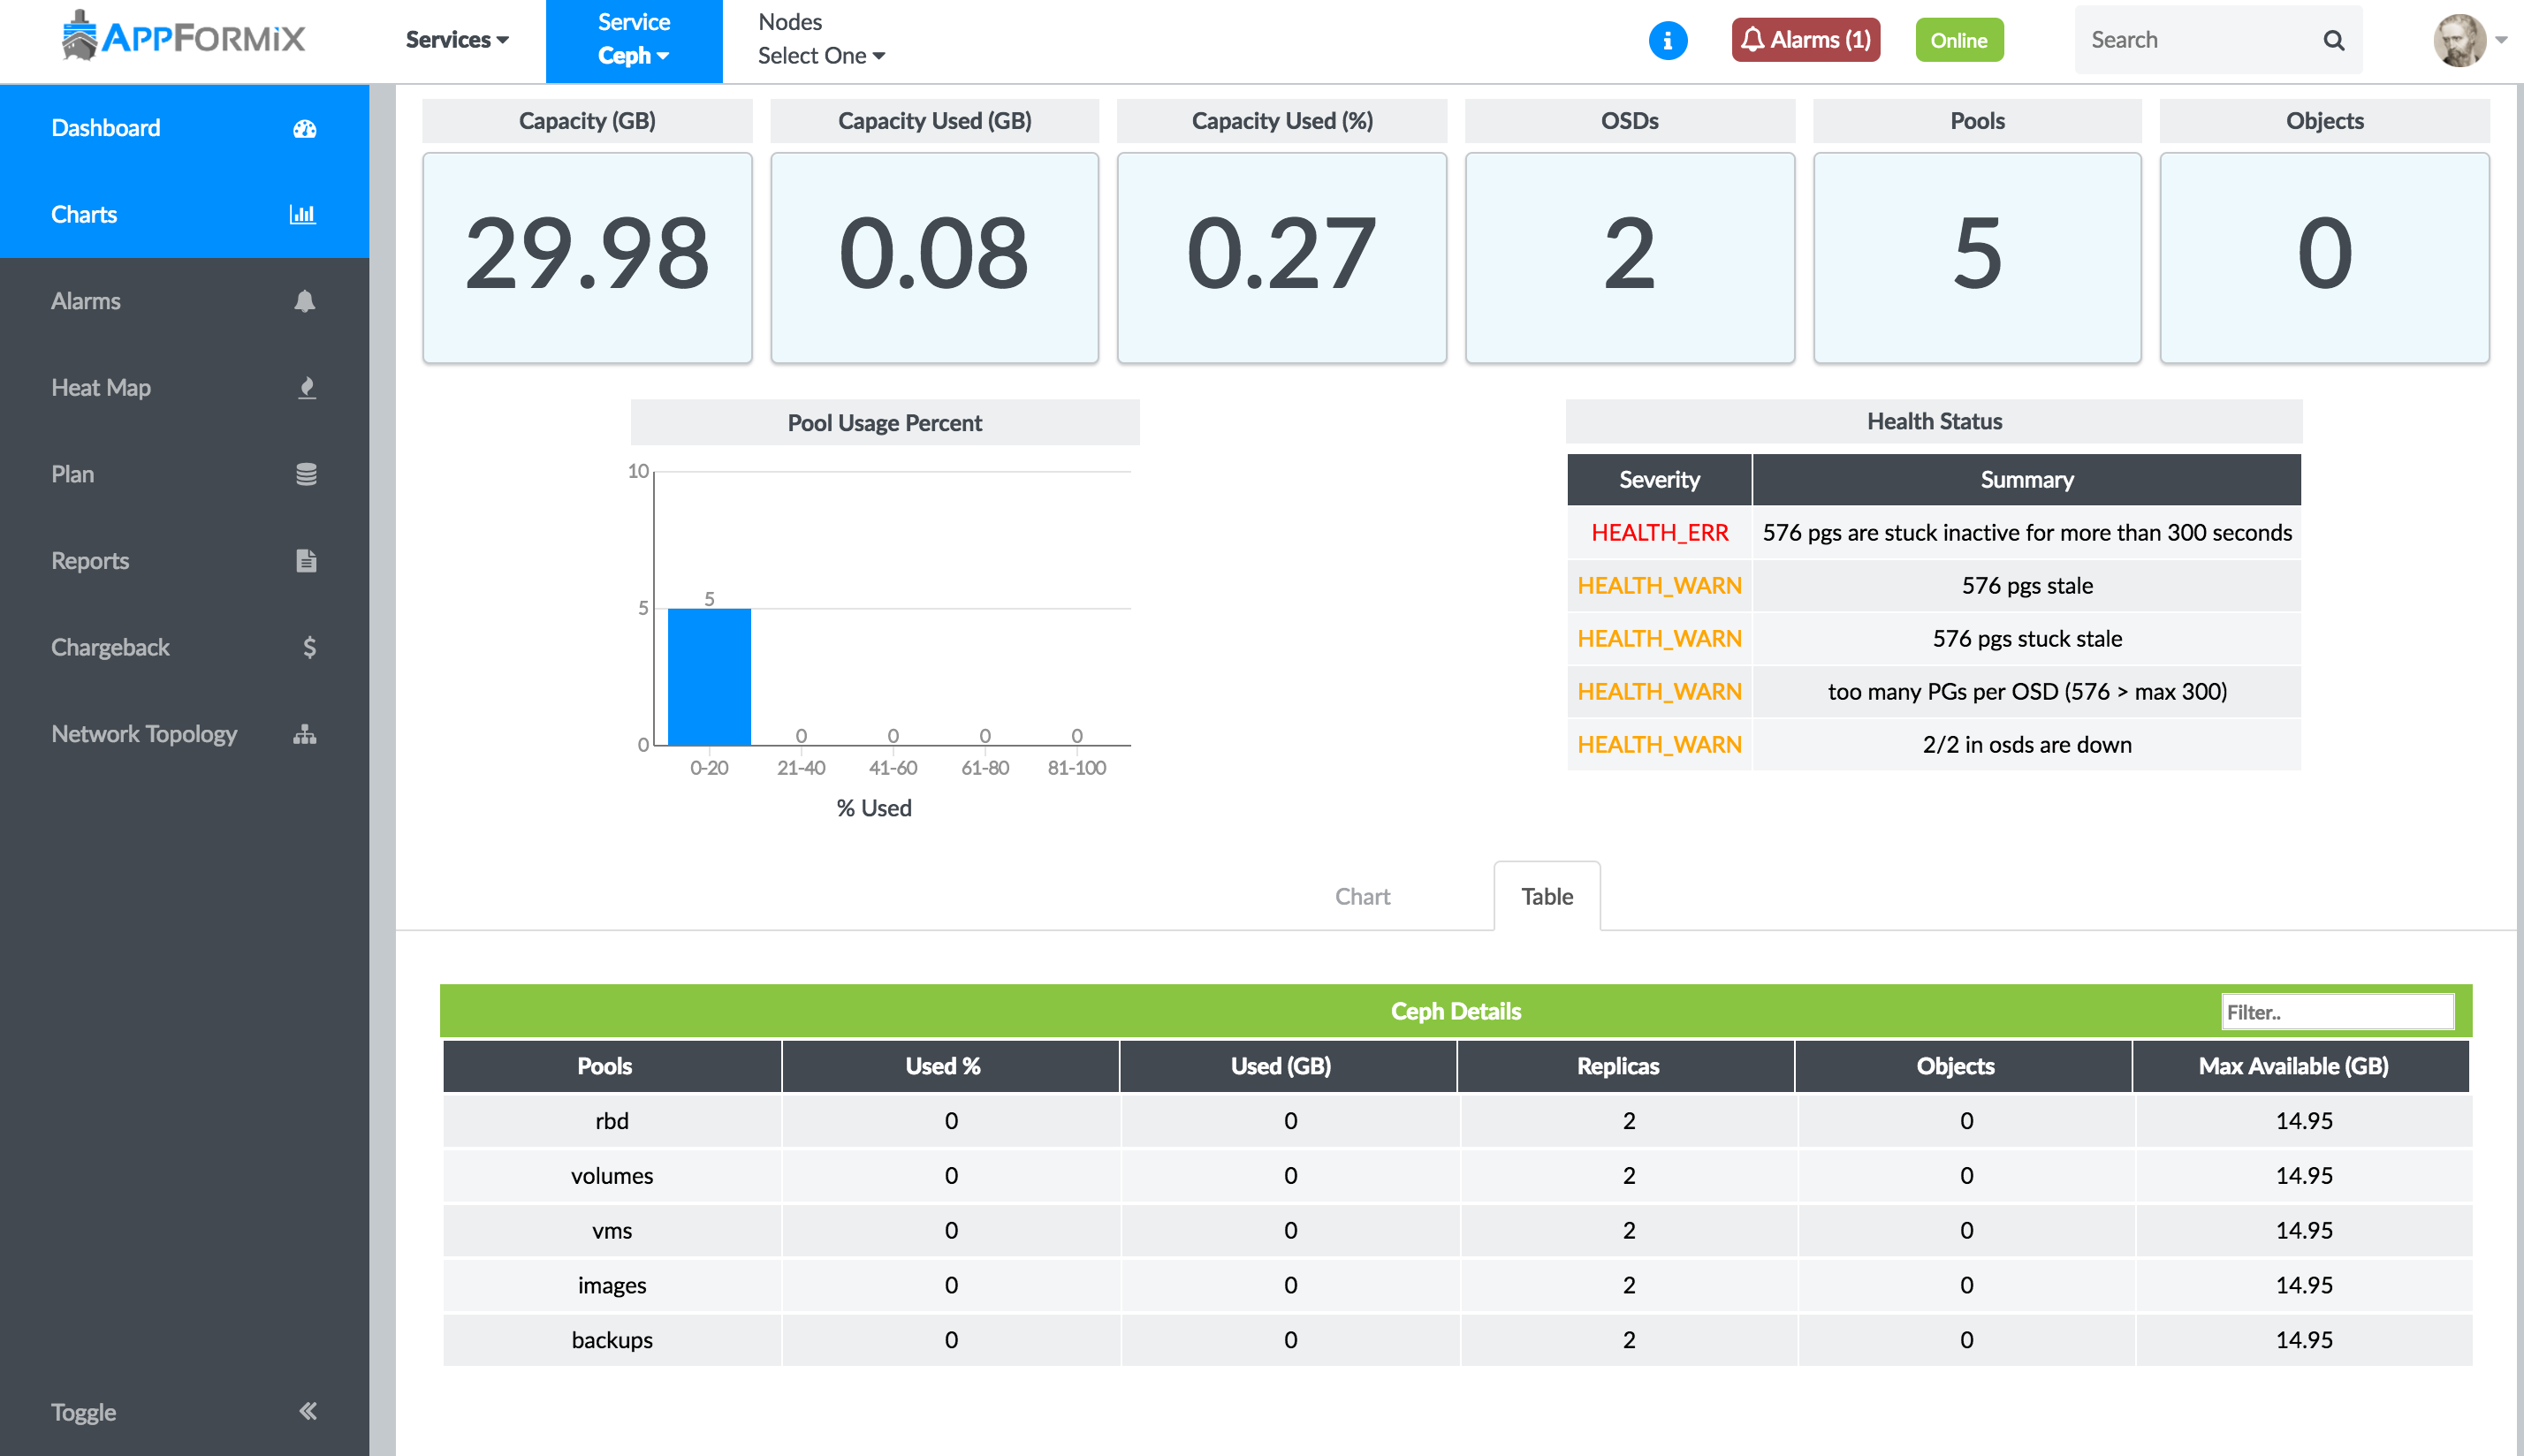
Figure 2 shows the Ceph service monitoring page and storage pool usage details in a chart.
Monitor Ceph OSD and Monitor Nodes
With Contrail Insights Agent installed on the Ceph storage hosts,
details are available about each OSD and Monitor node in the cluster.
Using the context menu, select Services > Ceph > Nodes.
Each host in the list has a tag of ceph-osd or ceph-monitor. When a host with a ceph-osd tag is selected, a summary of host performance
metrics are shown, as well as the health and status of each OSD on
the host. See Figure 3 for an
example summary.
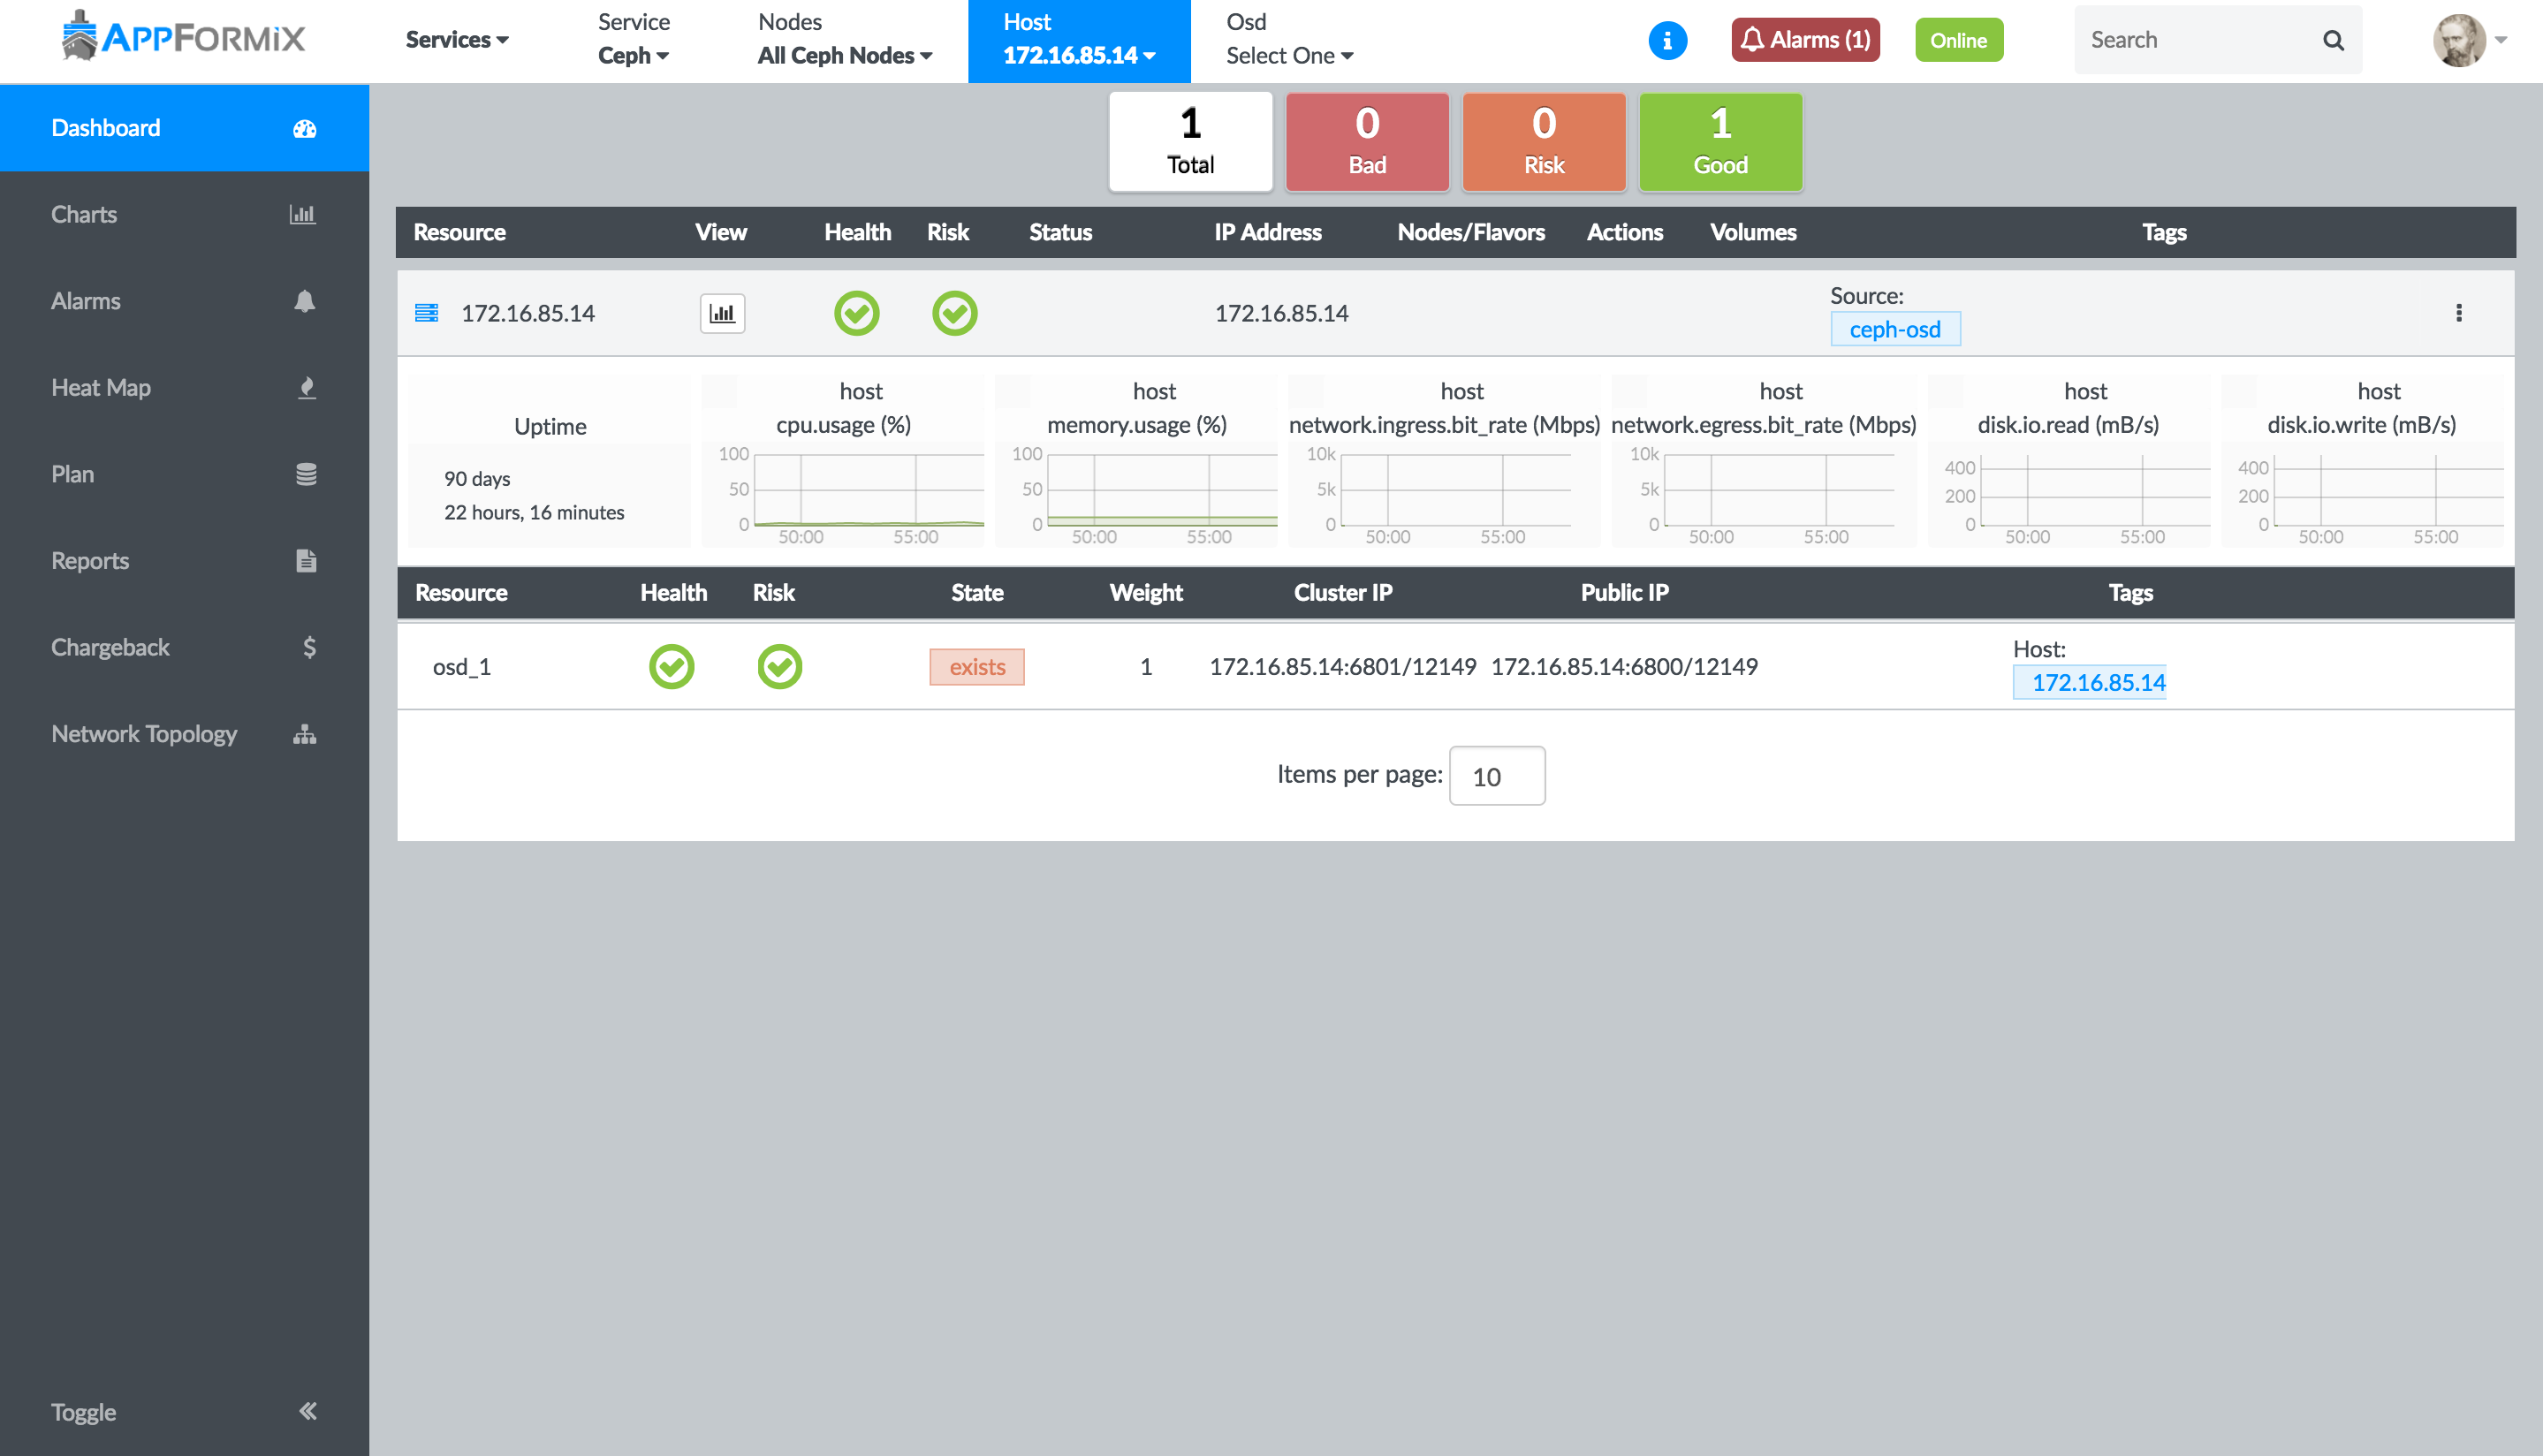
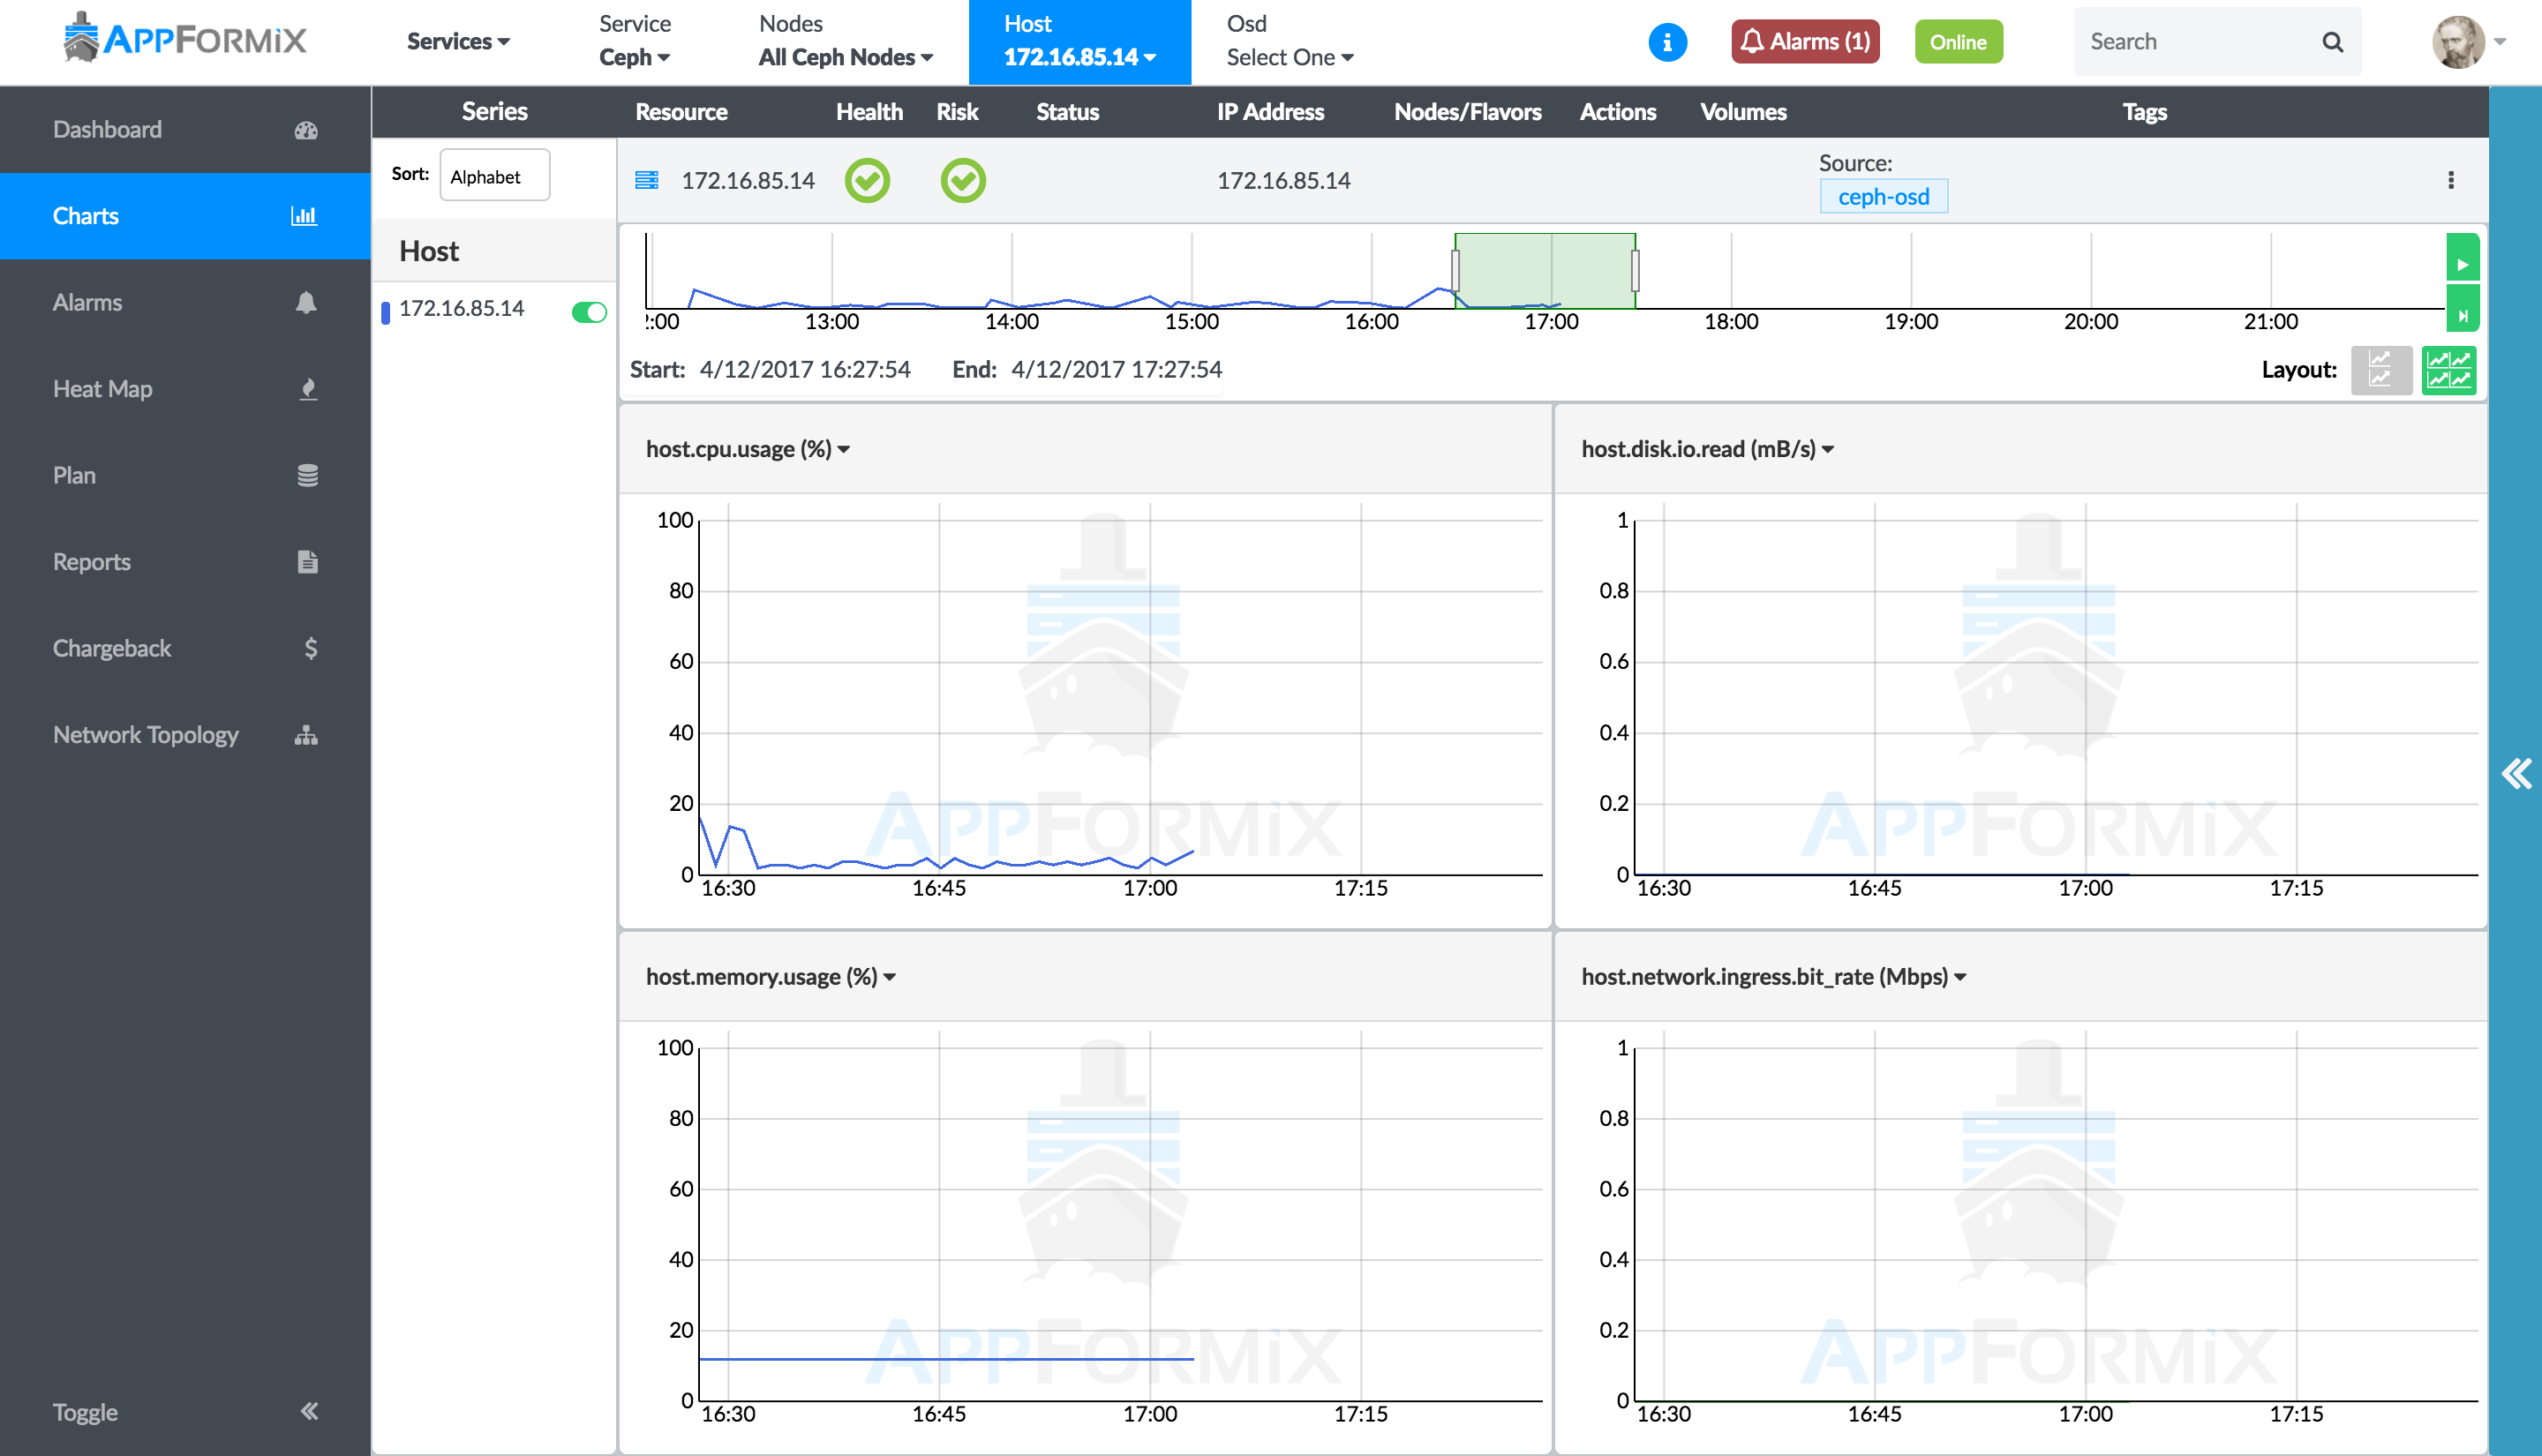
All of the Contrail Insights host monitoring functionality is available for the storage host, including Charts and Alarms. Navigate to Charts and Alarms in the left menu.
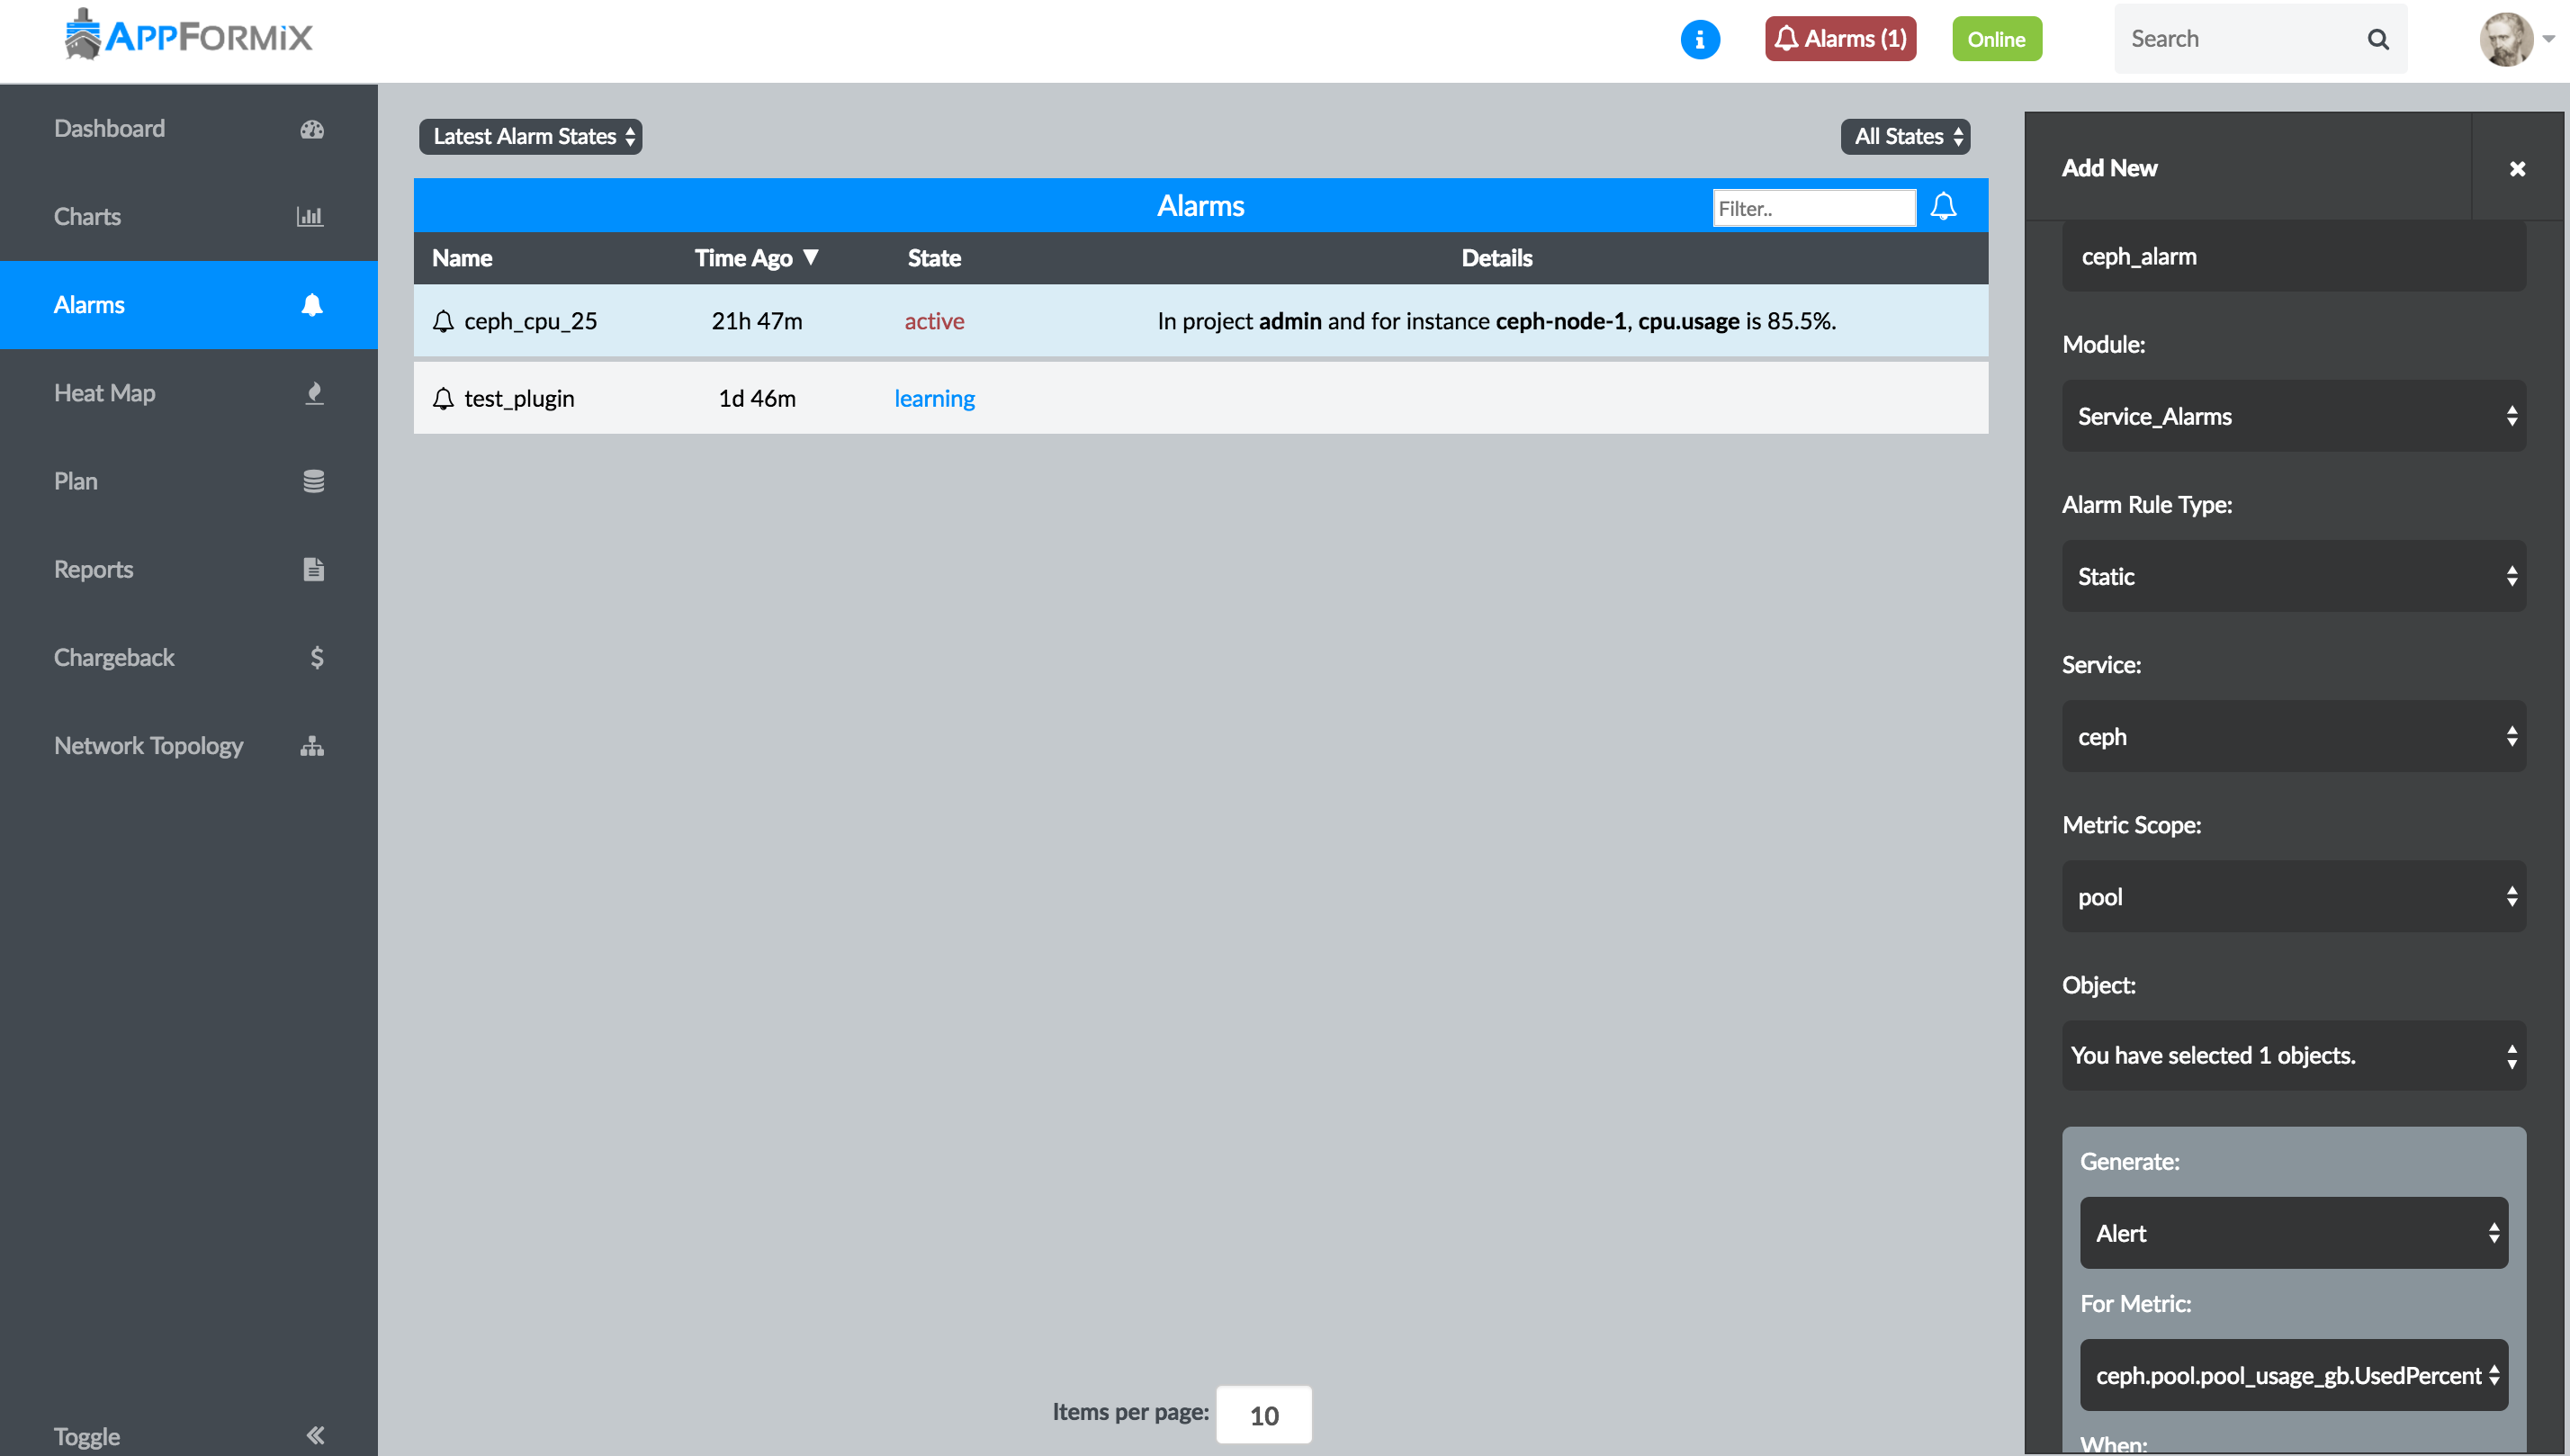
Service Alarms
Alarms can be configured to monitor the Ceph cluster metrics at the cluster, pool, or host level.
To configure an alarm for cluster-wide and per-pool metrics, select Alarms in the left menu. Choose the Service Alarms module, and select ceph from the Service drop-down list. Ceph service alarms can be created to monitor a cluster or a pool. With cluster scope, an alarm can be configured for cluster-wide metrics, such as the cluster storage usage. With pool scope, an alarm can be configured to monitor per-pool metrics for one or multiple pools.
To configure an alarm for a Ceph storage host, select the Alarms module in the Alarms pane. An alarm can be configured for one or multiple Ceph storage hosts. See Configuring Alarms in Alarms for details.
As with all alarms in Contrail Insights, Notifications can be configured for Ceph alarms. Figure 5 shows the alarm state for the Ceph cluster metrics.
Configuration
See Service Monitoring Ansible Variables for steps to configure Contrail Insights using Ansible to monitor a Ceph cluster.
Contrail Monitoring
Contrail Networking is a software-defined networking (SDN) platform based on the open-source network virtualization project, OpenContrail. The Contrail Networking platform automates and orchestrates the creation of highly scalable virtual networks.
Contrail Insights provides monitoring and orchestration for the Contrail Service. See the Service Monitoring Ansible Variables instructions for how to configure Contrail monitoring.
- Service Monitoring Dashboard
- Configuring Alarms
- Setting Health and Risk Rules for Contrail BGP Peers and XMPP Peers
- Flow Monitoring with Contrail vRouter
- Configuring Contrail Cluster Connection Details
- Configuring Dynamic Alarms Data Purge Rate
Service Monitoring Dashboard
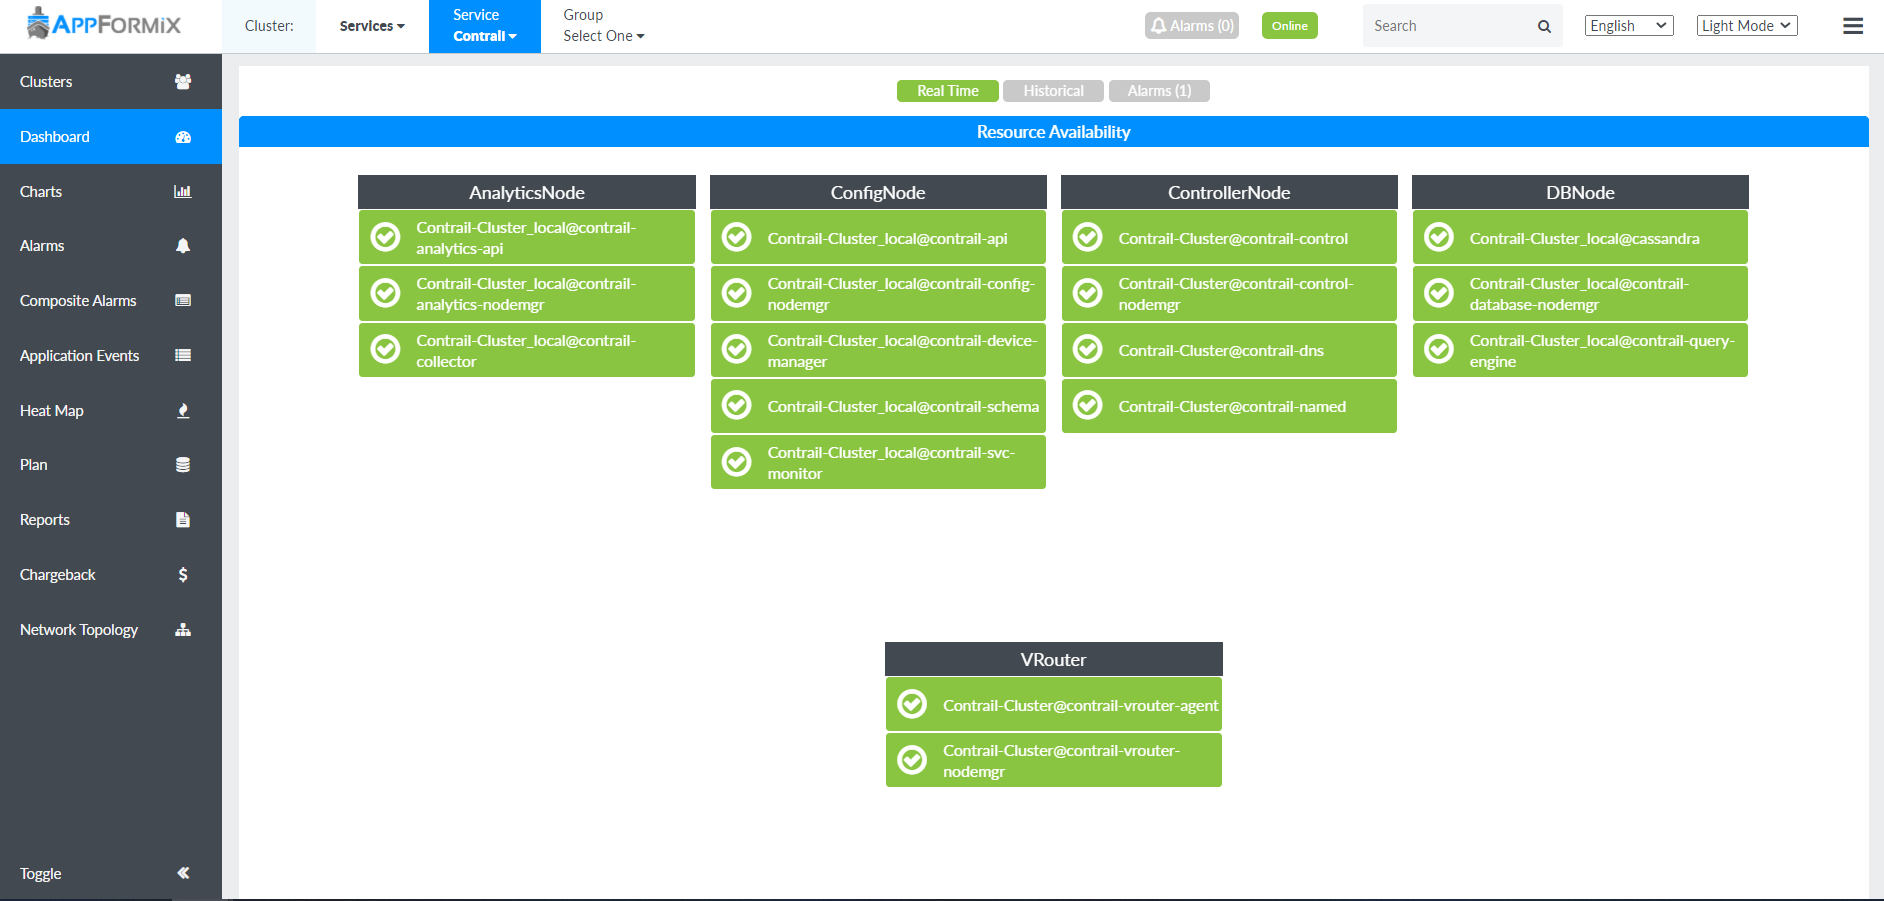
Contrail Insights service monitoring Dashboard for a Contrail cluster displays the overall state of the cluster and its components.
Contrail Insights provides real-time liveness for following five Contrail service groups.
Analytics Nodes
Config Nodes
Controller Nodes
DB Nodes
vRouter
Figure 6 shows real-time liveness for each Contrail service.
Starting with Contrail Insights Release 3.3.0, vRouter Contrail service group is also supported. These service groups run on all hosts that are configured during the Contrail Networking installation.
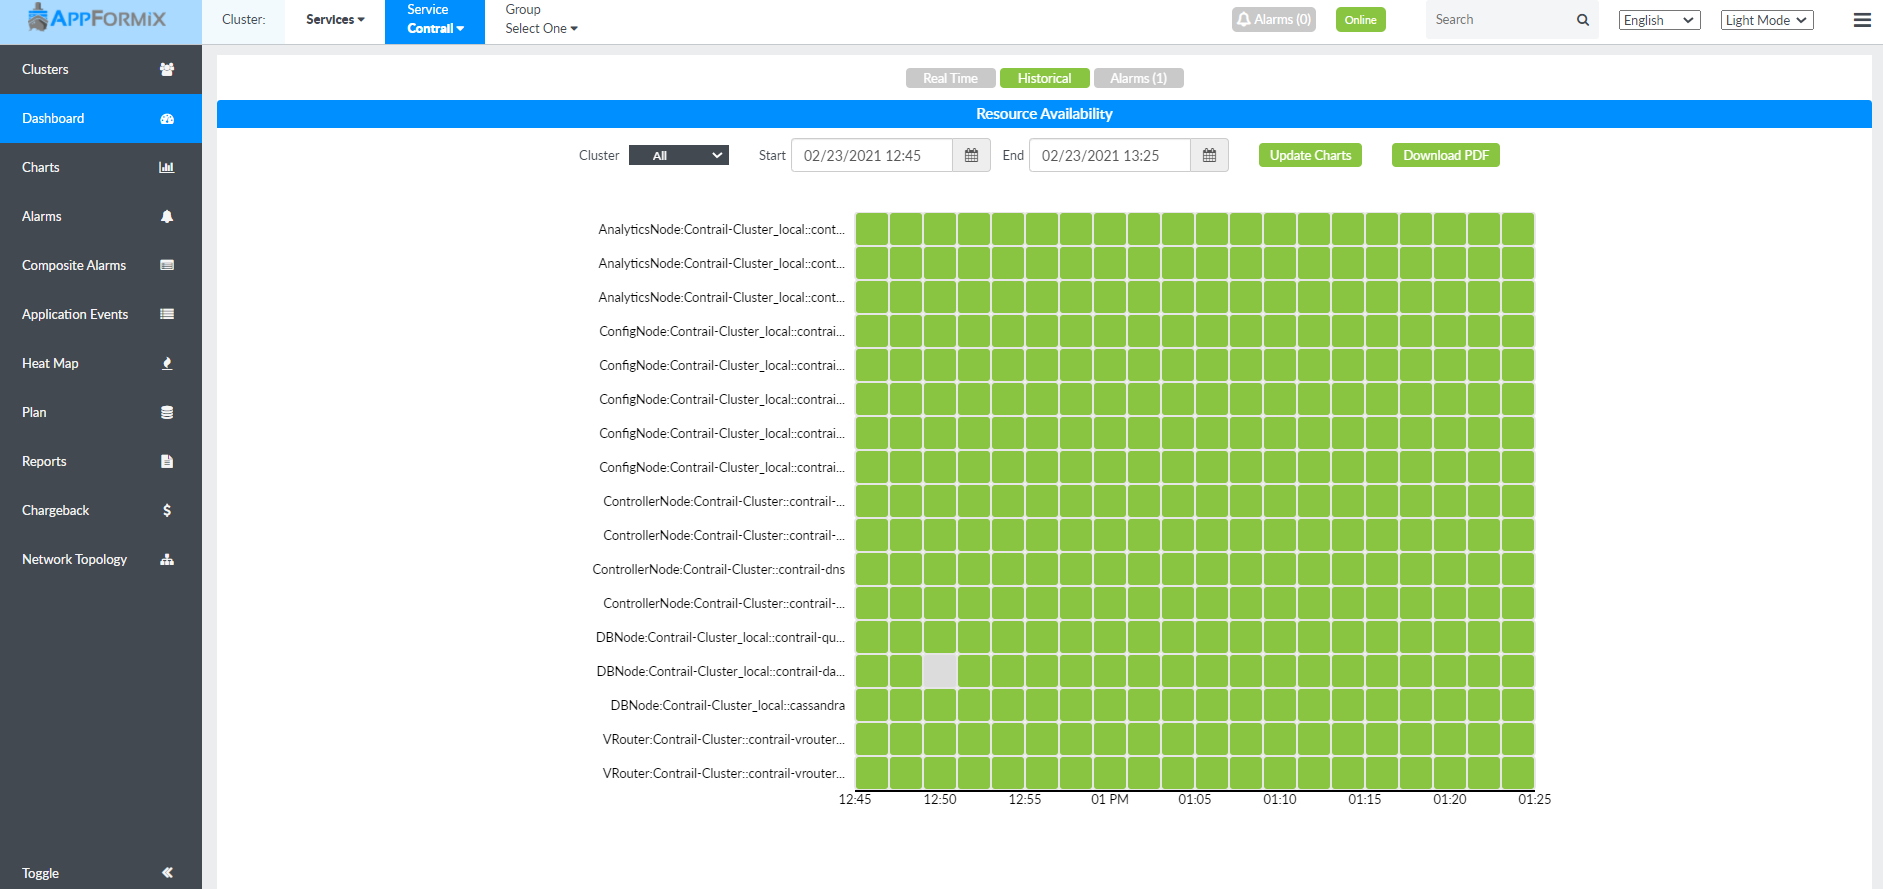
Contrail Insights also provides a historical liveness view of each Contrail service.
Figure 7 show a historical liveness view.
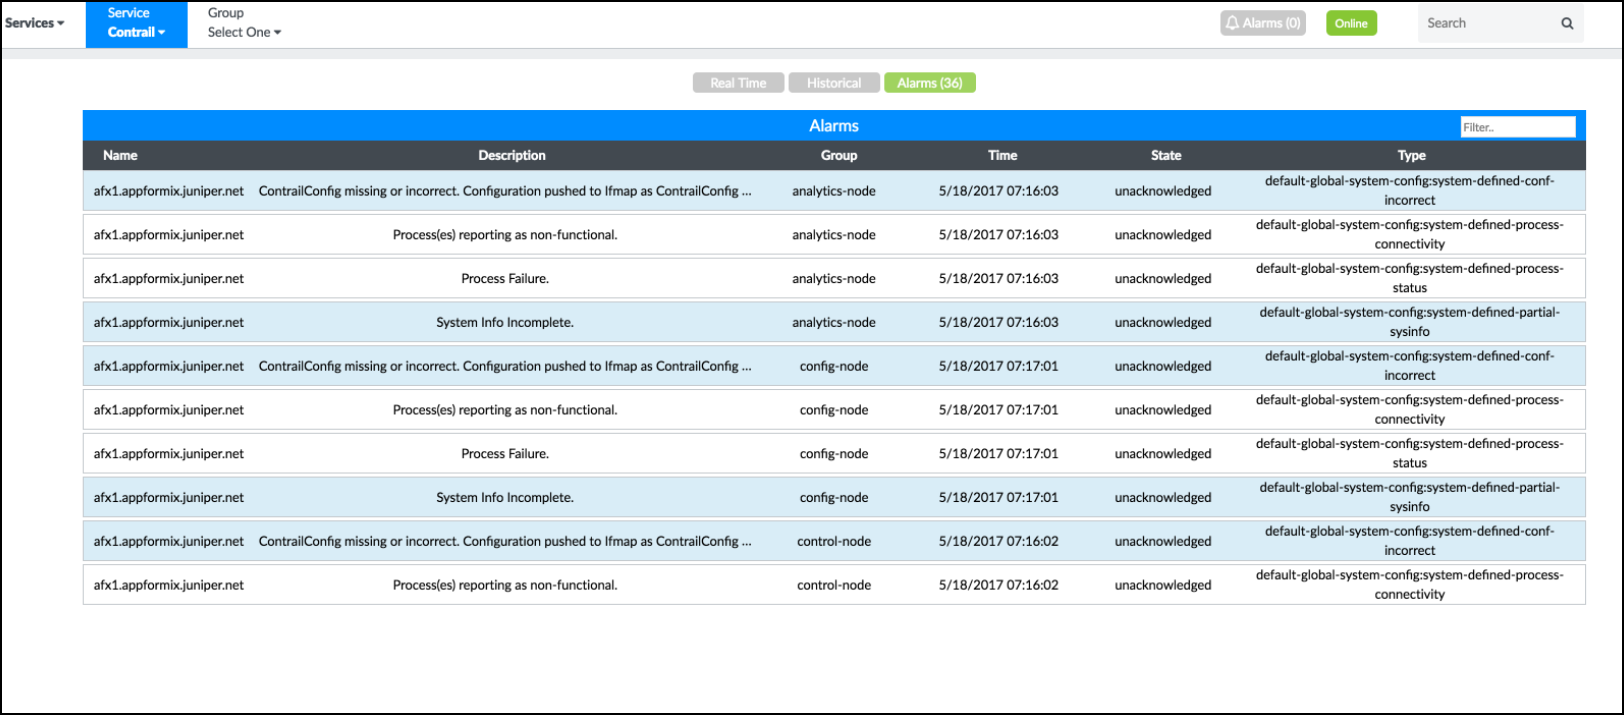
In addition, any alarm generated by the Contrail Service can also be accessed from the Contrail Insights Dashboard.
Figure 8 shows examples of Contrail service alarms.
Contrail Insights monitors the real-time status of every element of the Contrail cluster. You can select an element from the Group list for the Contrail service. For example, if you select Analytics Nodes service group, the Dashboard displays each service on every host that is configured for that particular service group. Liveness statistics and basic metrics are also available for each service in this view. Figure 9 shows statistics and metrics for the Contrail analytics nodes.
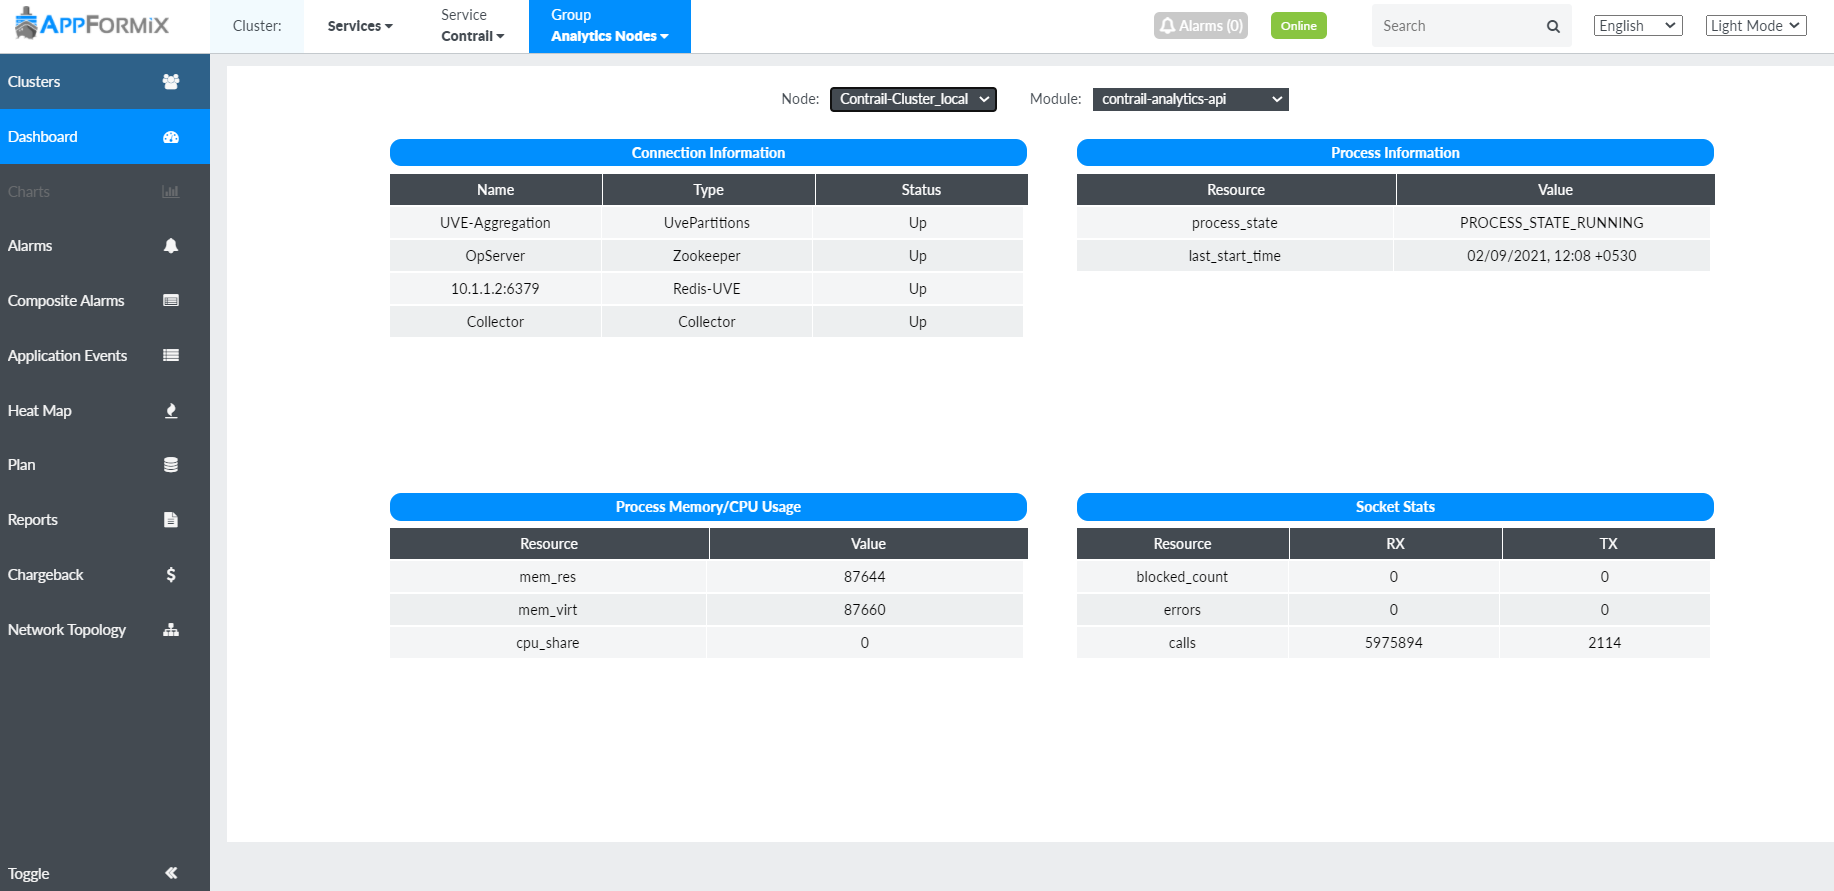
For Contrail Config Nodes, Contrail Insights enables a Peer view for XMPP and BGP peers. The information provides some rx and tx reachability statistics, as shown in Figure 10.

Configuring Alarms
An alarm can be configured for any of the Contrail metrics collected. In the Alarm panel, select the Alarms module. Then select Contrail from the Scope list. Additionally, notifications can also be configured for Contrail alarms. Figure 11 shows the Alarm pane for configuring Contrail alarms. For more information, see Alarms and Notifications.
Entity Type and Entity Names are mandatory fields.
Setting Health and Risk Rules for Contrail BGP Peers and XMPP Peers
In addition to Health and Risk rules that are preconfigured by Contrail Insights, you can set Health and Risk rules for two additional modules by following these steps:
Select Settings from the Dashboard as shown in Figure 12.
The AppFormix Settings page is displayed.
Figure 12: Select Settings from the Dashboard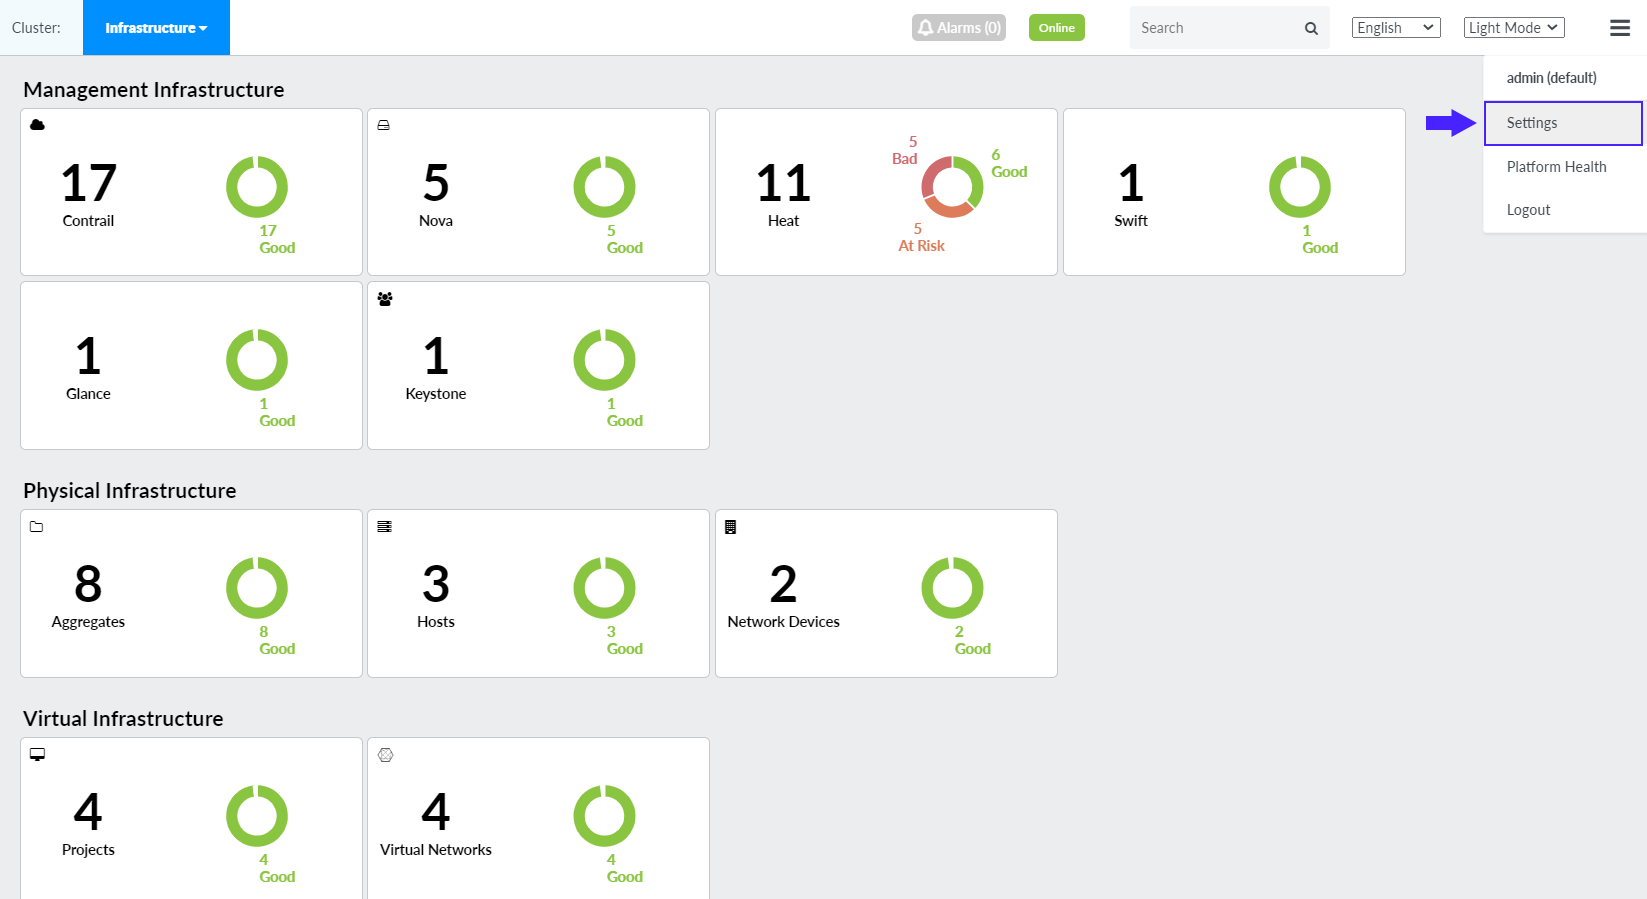
Click SLA Settings and then click Health or Risk.
Existing rules if any are displayed in the Contrail tab.
To apply a new rule, delete the existing rule by clicking Delete Profile as shown in Figure 13.
Figure 13: Delete Existing Rule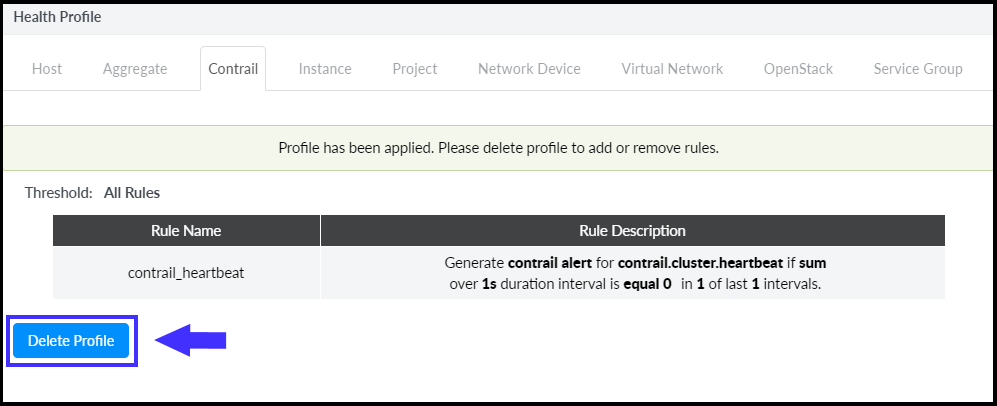
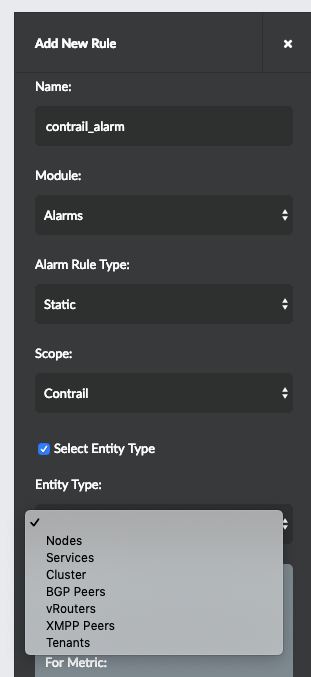
After you have deleted the existing rule, click Add New Rule. See Figure 14.
The Add New Rule pane is displayed.
From the Entity Type list in the Add New Rule pane, select BGP Peers or XMPP Peers. See Figure 14.
Figure 14: Setting Health or Risk Rules for Contrail Services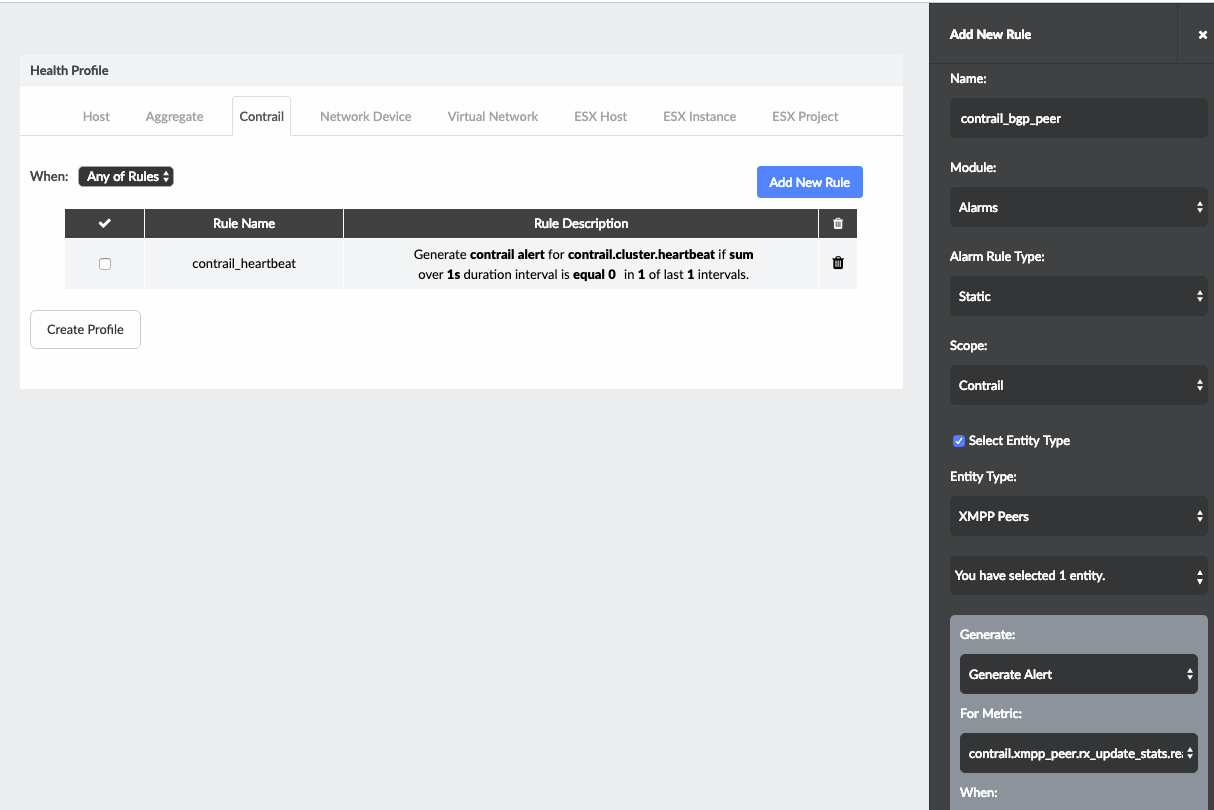
Click Save.
The new rule is also added to the table as shown in Figure 15.
Then select SLA Settings > Health or Risk > Contrail tab.
Select both rules by selecting the check box next to the Rule Name as shown in Figure 15, and then click Create Profile.
Figure 15: Creating Health Profile for Contrail XMPP Peer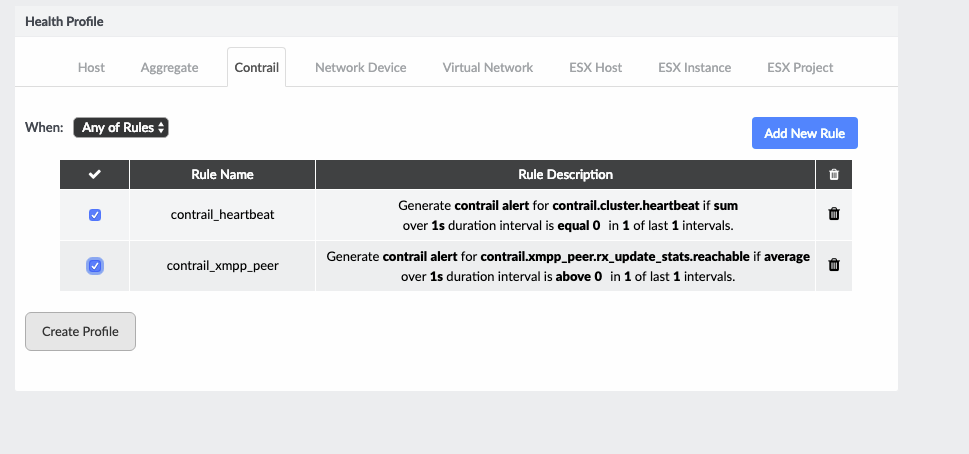
(Optional) You can also view XMPP and BGP peer resource and health information from the Contrail Insights Dashboard.
For example, to view XMPP Peer resource and health information, click Dashboard and select Services from the context menu.
From the Service list, select Contrail, and select Config Nodes from the Group list.
Finally, from the Peer Group list, select XMPP Peers to view XMPP peer resource and health information. See Figure 16.
Figure 16: Viewing XMPP Peer Resource and Health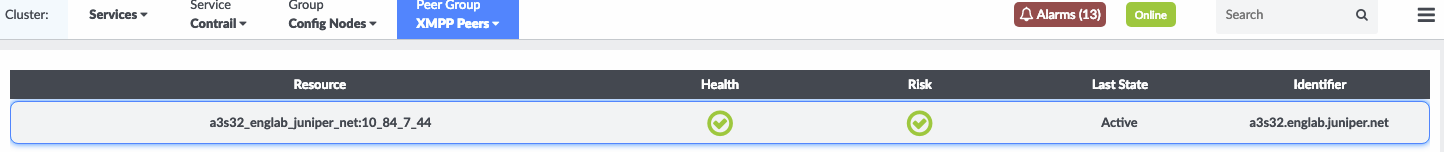
Flow Monitoring with Contrail vRouter
When the Contrail vRouter is installed on a compute node, Contrail Insights provides debug mode functionality in the Network Topology panel.
In this mode, the top flows on each compute node are available for visualization with details on flow tuples, packets, and bytes. Figure 17 shows the flow monitoring details and visualization.
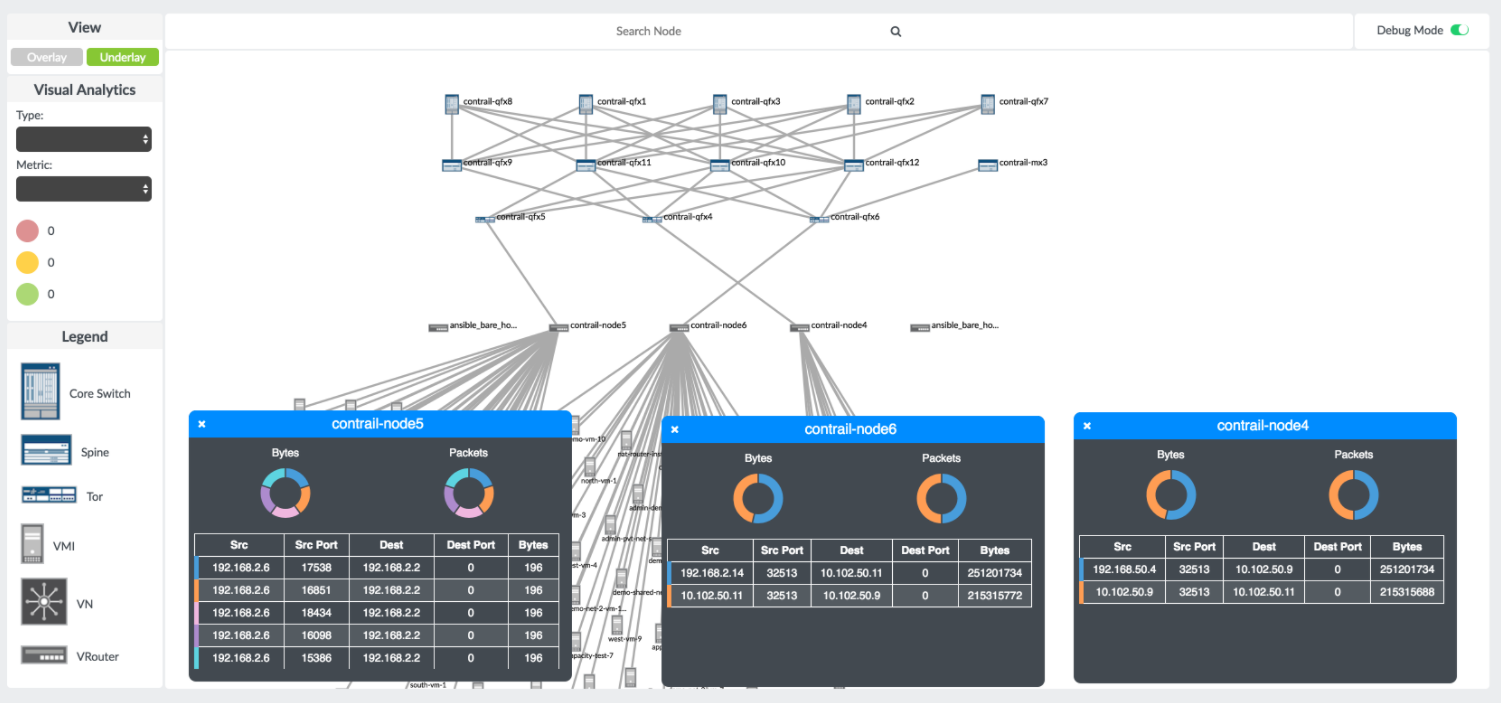
In debug mode, you can analyze details on the top-n flows on any compute part of the Network Topology view. Figure 18 shows the Contrail flow details.

Configuring Contrail Cluster Connection Details
Contrail service monitoring is supported by the following Contrail Insights adapters:
OpenStack
Kubernetes
Network Device Adapter
Network Device Adapter for monitoring Contrail service can only be used when Contrail Analytics endpoints are not authenticated.
If more than one adapters are deployed, there is internal precedence to decide which adapter should monitor Contrail. Precedence ranking is as follows: Openstack, Kubernetes, Network Device Adapter.
In order for Contrail Insights to monitor Contrail metrics,
the Contrail Insights Platform host must be able to open connections
to the Analytics API and Config API. For example, ports 8081 and 8082 on the Contrail
controller.
Contrail cluster connection details can be configured in Contrail Insights Dashboard or Ansible playbooks.
To configure Contrail cluster connection details from the Dashboard:
Select Settings > Service Settings. Then select the Contrail tab, as shown in Figure 19.
Figure 19: Configure Contrail Cluster Connection Details
Click Add Cluster.
Enter the cluster name, analytics URL, and configuration URL. The URLs should specify only the protocol, address, and optional port.
For example,
http://contrail.example.com:8081for the analytics URL andhttp://contrail.example.com:8082for the configuration URL.Click Setup. On success, a Submission Successful message appears in the Dashboard.
Contrail service monitoring is configured by the Ansible role appformix_contrail_config. This Ansible role is applied
to the appformix_controller group of hosts.
Ansible performs the configuration if the variables are set as extra
vars, group vars, etc.
For configuration using Ansible playbooks, see Service Monitoring Ansible Variables for steps to configure Contrail Insights to monitor a Contrail cluster.
Configuration of Contrail uses the same OpenStack credentials
as provided for Contrail Insights to access OpenStack services. The
Ansible role reads the credentials from environment variables (for
example, OS_USERNAME, OS_PASSWORD). Administrator credentials to the OpenStack cluster are also needed.
Contrail Insights connects to the analytics and configuration nodes
of Contrail.
- Contrail Configuration Starting with Contrail Insights Release 2.15
- Contrail Configuration Prior to Contrail Insights Release 2.15
Contrail Configuration Starting with Contrail Insights Release 2.15
Starting with Contrail Insights Release 2.15, connections to Contrail are configured by providing complete URLs to access the analytics and configuration API services.
The URL for Contrail analytics API (
contrail_analytics_url) should specify protocol, address, and port.For example, http://contrail.example.com:8081.
The URL for Contrail configuration API (
contrail_config_url) should specify protocol, address, and port.For example, http://contrail.example.com:8082.
In certain cases, optional variables can be specified as well.
For example, in the Dashboard, when the Contrail cluster name (
contrail_cluster_name) is not provided, a default variable value (default_contrail_cluster) is set.
Contrail Configuration Prior to Contrail Insights Release 2.15
For releases prior to Contrail Insights Release 2.15, the configuration is specified as a single hostname by which both the analytics and configuration APIs are accessed.
Contrail Insights connects to port 8081 for the analytics API and port 8082 for the configuration API.
Hostname (contrail_host) is the IP
address or hostname of the Contrail API server.
Configuring Dynamic Alarms Data Purge Rate
You can configure dynamic alarms data purge rate by using the Contrail Insights user interface (UI).
Follow these steps to configure dynamic alarms data purge rate.
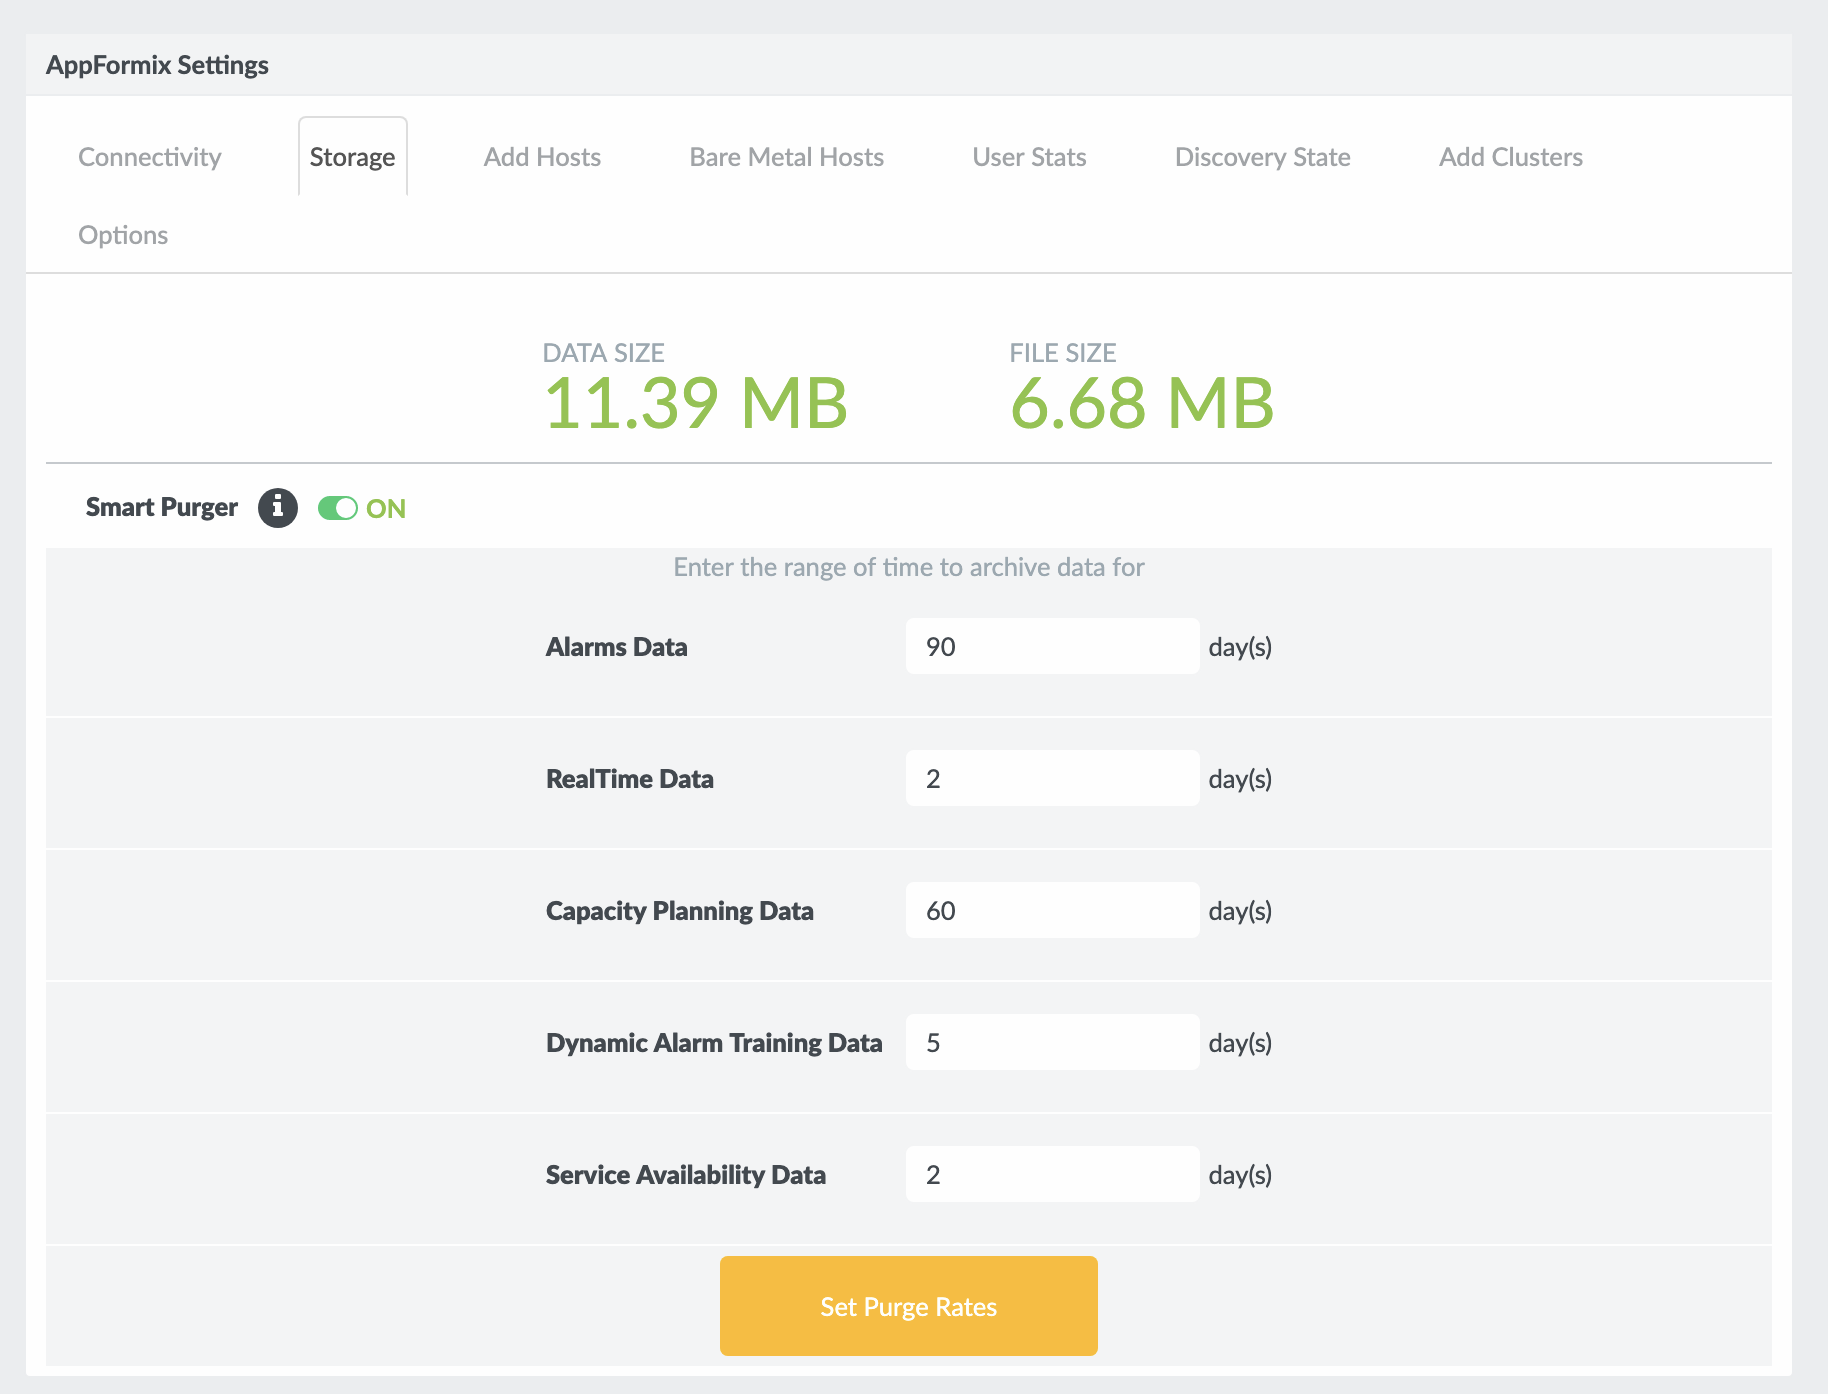
Click Settings as shown in Figure 20.
The Connectivity tab of the AppFormix Settings page is displayed.
Figure 20: Click Settings Button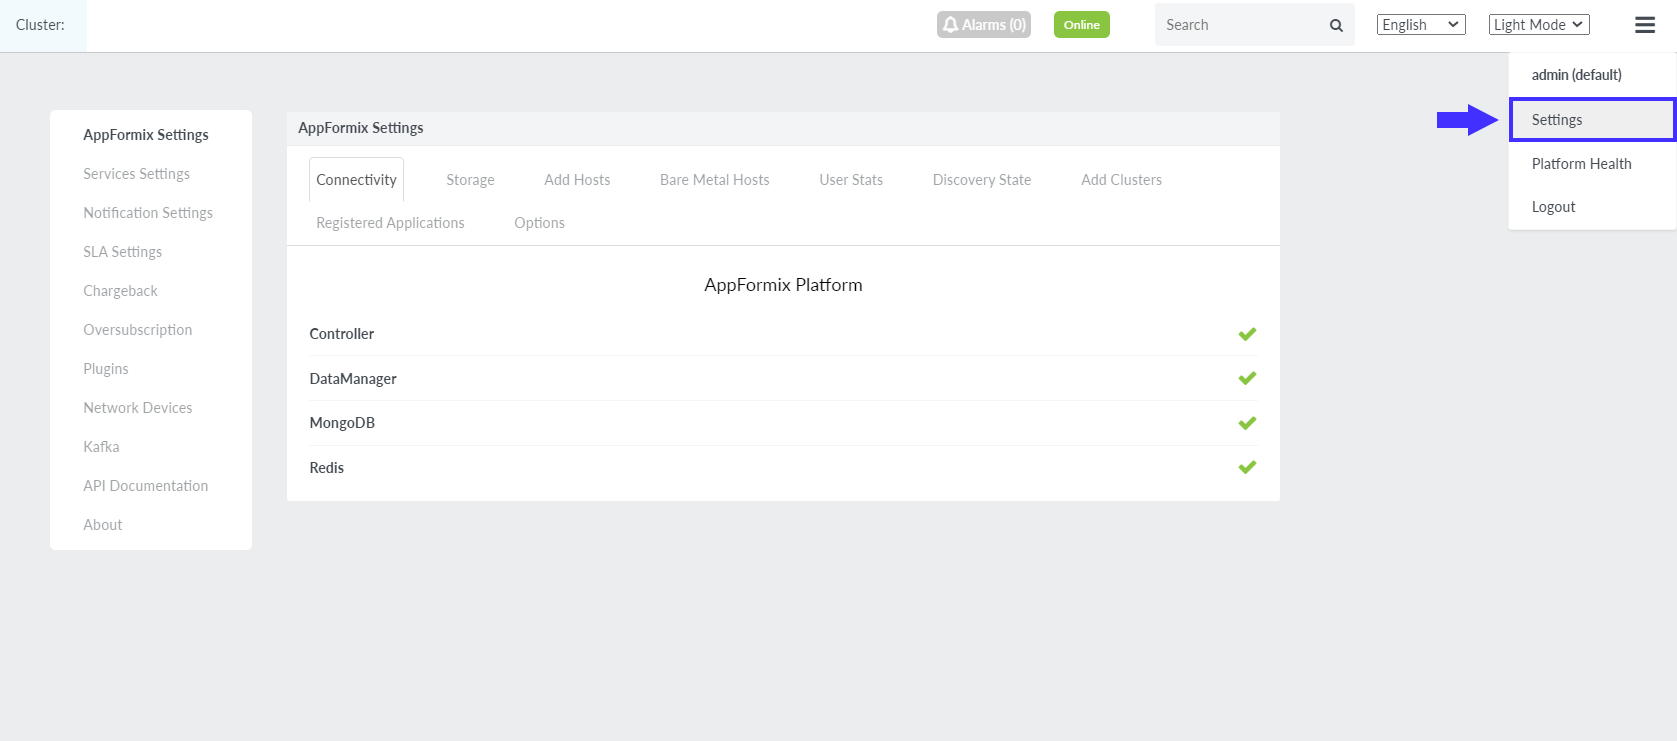
Click the Storage tab as shown in Figure 21.
Enter the required values as shown in Figure 21.
Note:Ensure that the values entered in the Dynamic Alarm Training Data and Service Availability Data fields are not zero.
Click Set Purge Rates to confirm.
Cassandra Monitoring
Contrail Insights supports Cassandra monitoring.
The Cassandra configuration can be specified by using Ansible or by using the Contrail Insights UI.
However, before you begin, ensure that you specify the Cassandra
plug-in in the group_vars/all file.
appformix_plugins:
  - { plugin_info: certified_plugins/cassandra_node_usage.json }
Configuring Cassandra by using Ansible
Specify these variables in the
group_vars/allfile.cassandra_username: Cassandra username to access API cassandra_password: Cassandra password to access API cassandra_host: Hostname or IP address of Cassandra API server cassandra_cluster_name: A name by which the Cassandra instance will be displayed in the Dashboard. If not specified, this variable has a default value of default_cassandra_cluster. cassandra_cluster_port: (Optional) Port used by the Cassandra service. Default port is 9042. appformix_cassandra_ssl_ca: (Optional) /path/to/ca_cert when SSL is enabled on cassandra cluster.When SSL is enabled on the Cassandra cluster, ensure that the Certificate Authority (CA) used for the certificates for the Cassandra nodes are trusted across all Contrail Insights platform nodes. In order for Contrail Insights containers to communicate with Cassandra, the CA file must be set as a group_vars/all variable (
appformix_cassandra_ssl_ca) during installation. For SSL, Cassandra cluster must be added by using Ansible and not by using the UI.Configuring Cassandra by using the Contrail Insights UI
Follow these steps to configure Cassandra by using the Contrail Insights UI.
Navigate to the Settings>Service Settings page.
Click the Cassandra tab and then click +Add Cluster.
Fields related to configuring Cassandra cluster are displayed as shown in Figure 22.
Figure 22: Cassandra Service Settings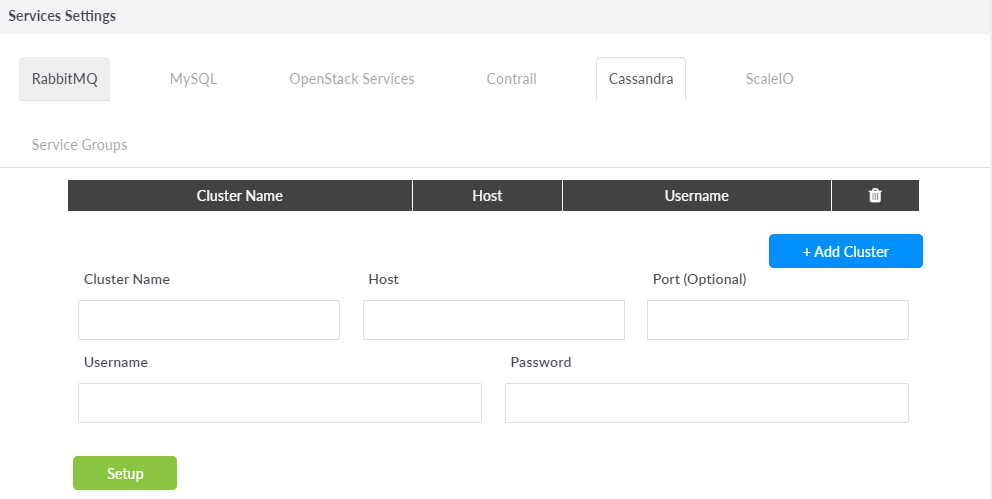
Enter the information as provided in Table 1.
Table 1: Configuring Cassandra Cluster Field
Action/Description
Cluster Name
Enter a name for the Cassandra cluster.
Host
Enter the Cassandra cluster host IP address.
Port (Optional)
Enter the port number.
This field is optional.
Username
Enter a user name for the Cassandra cluster.
Password
Enter a password for the Cassandra cluster.
Click Setup to save configuration.
MySQL Monitoring
A MySQL database is integral to the operation of OpenStack infrastructure services. Metrics for MySQL performance are available in real-time charts and alarms. Mulitple MySQL clusters can be configured to be monitored.
Resource Availability
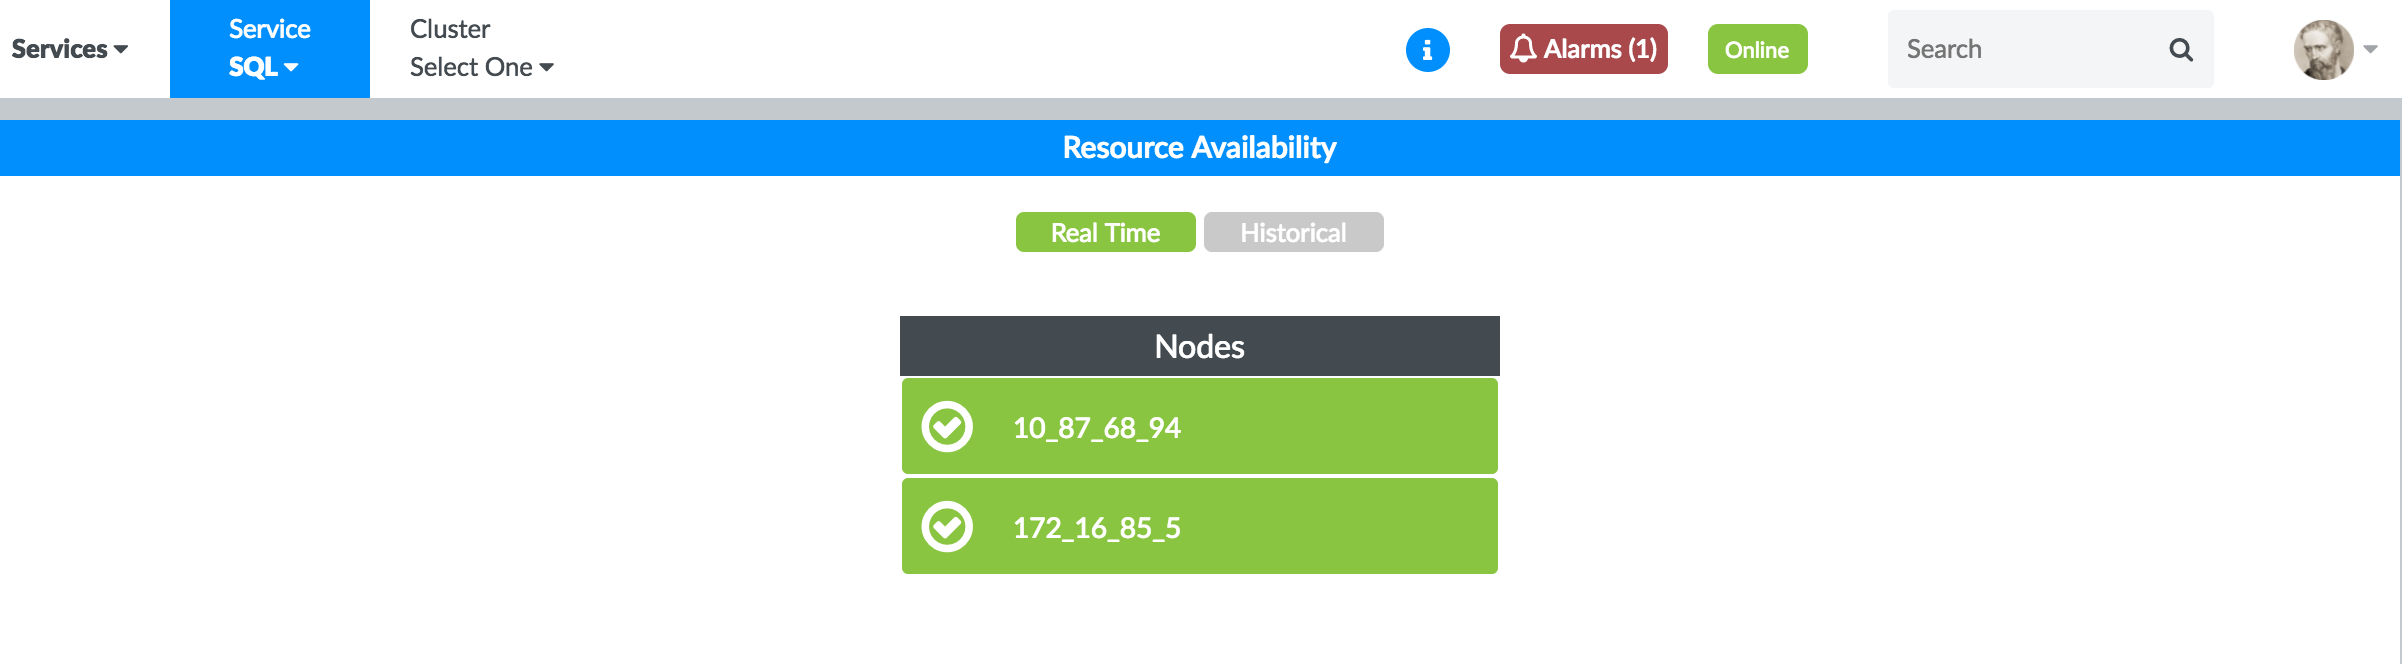
The availability of MySQL nodes for each of the configured MySQL clusters is recorded periodically. You can view both the current status, as well as the historical status over a specified period of time by selecting All Services > MySQL from the context menu at the top and, then select Dashboard from the left pane. Figure 23 shows the historical resource availability for the MySQL nodes.
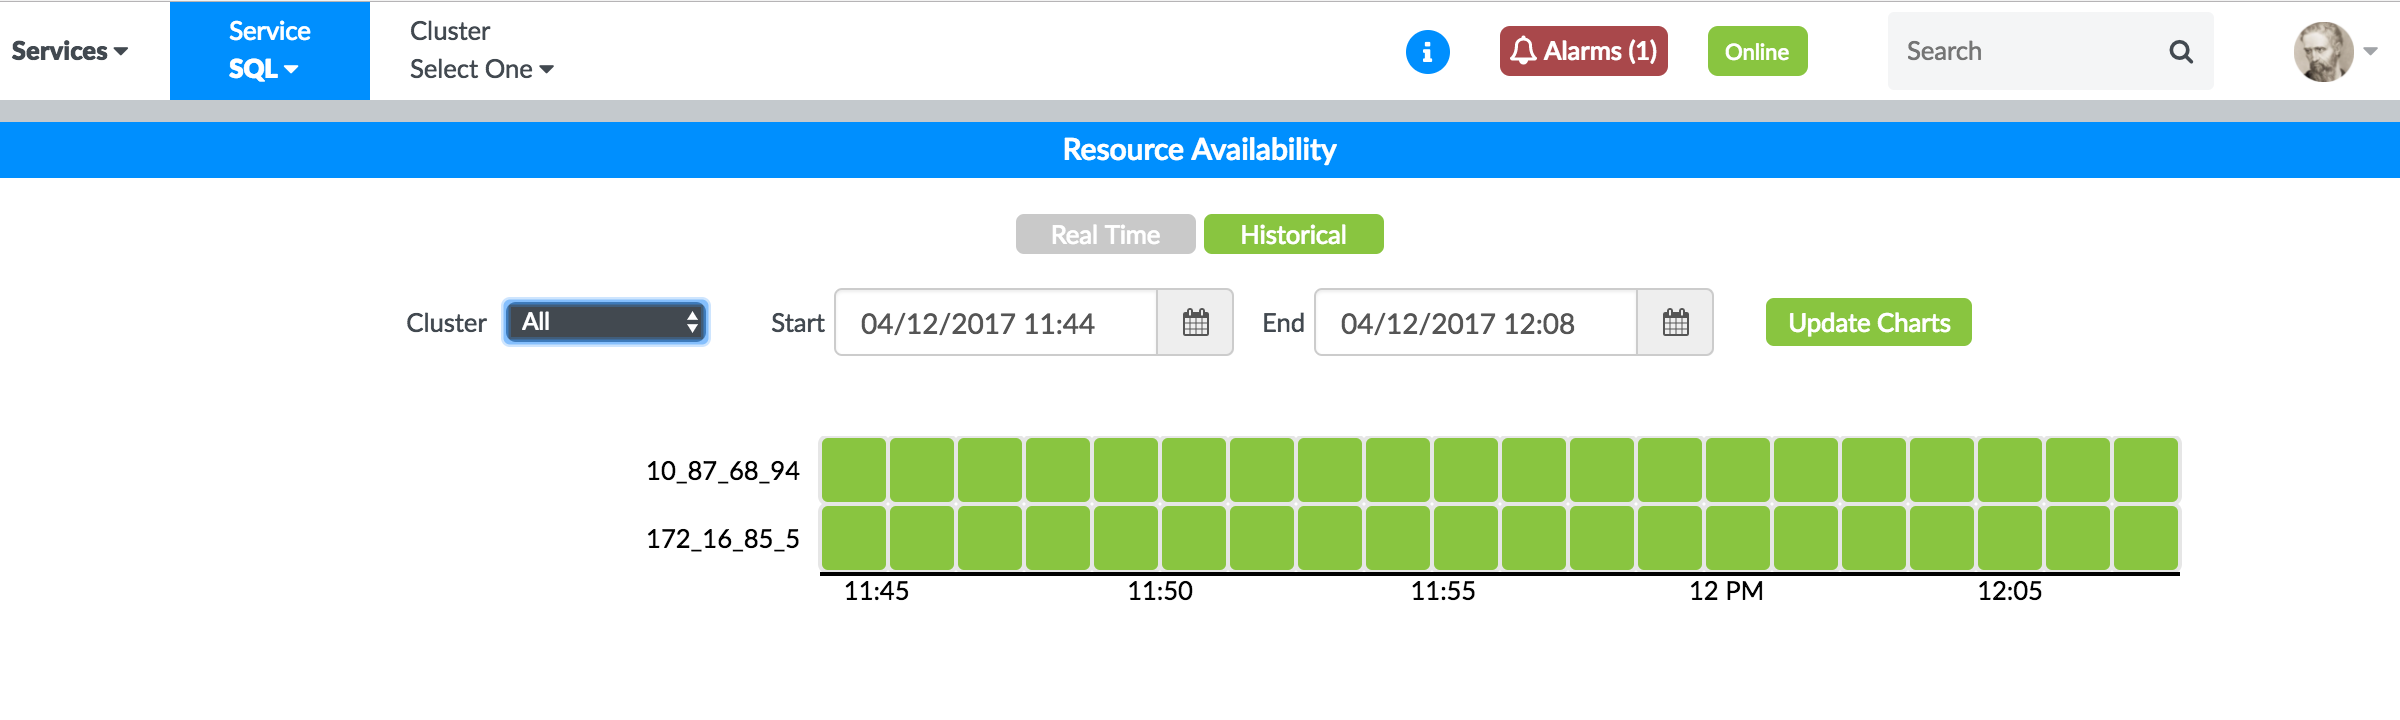
Figure 24 shows the real-time resource availability for the MySQL nodes.
Dashboard
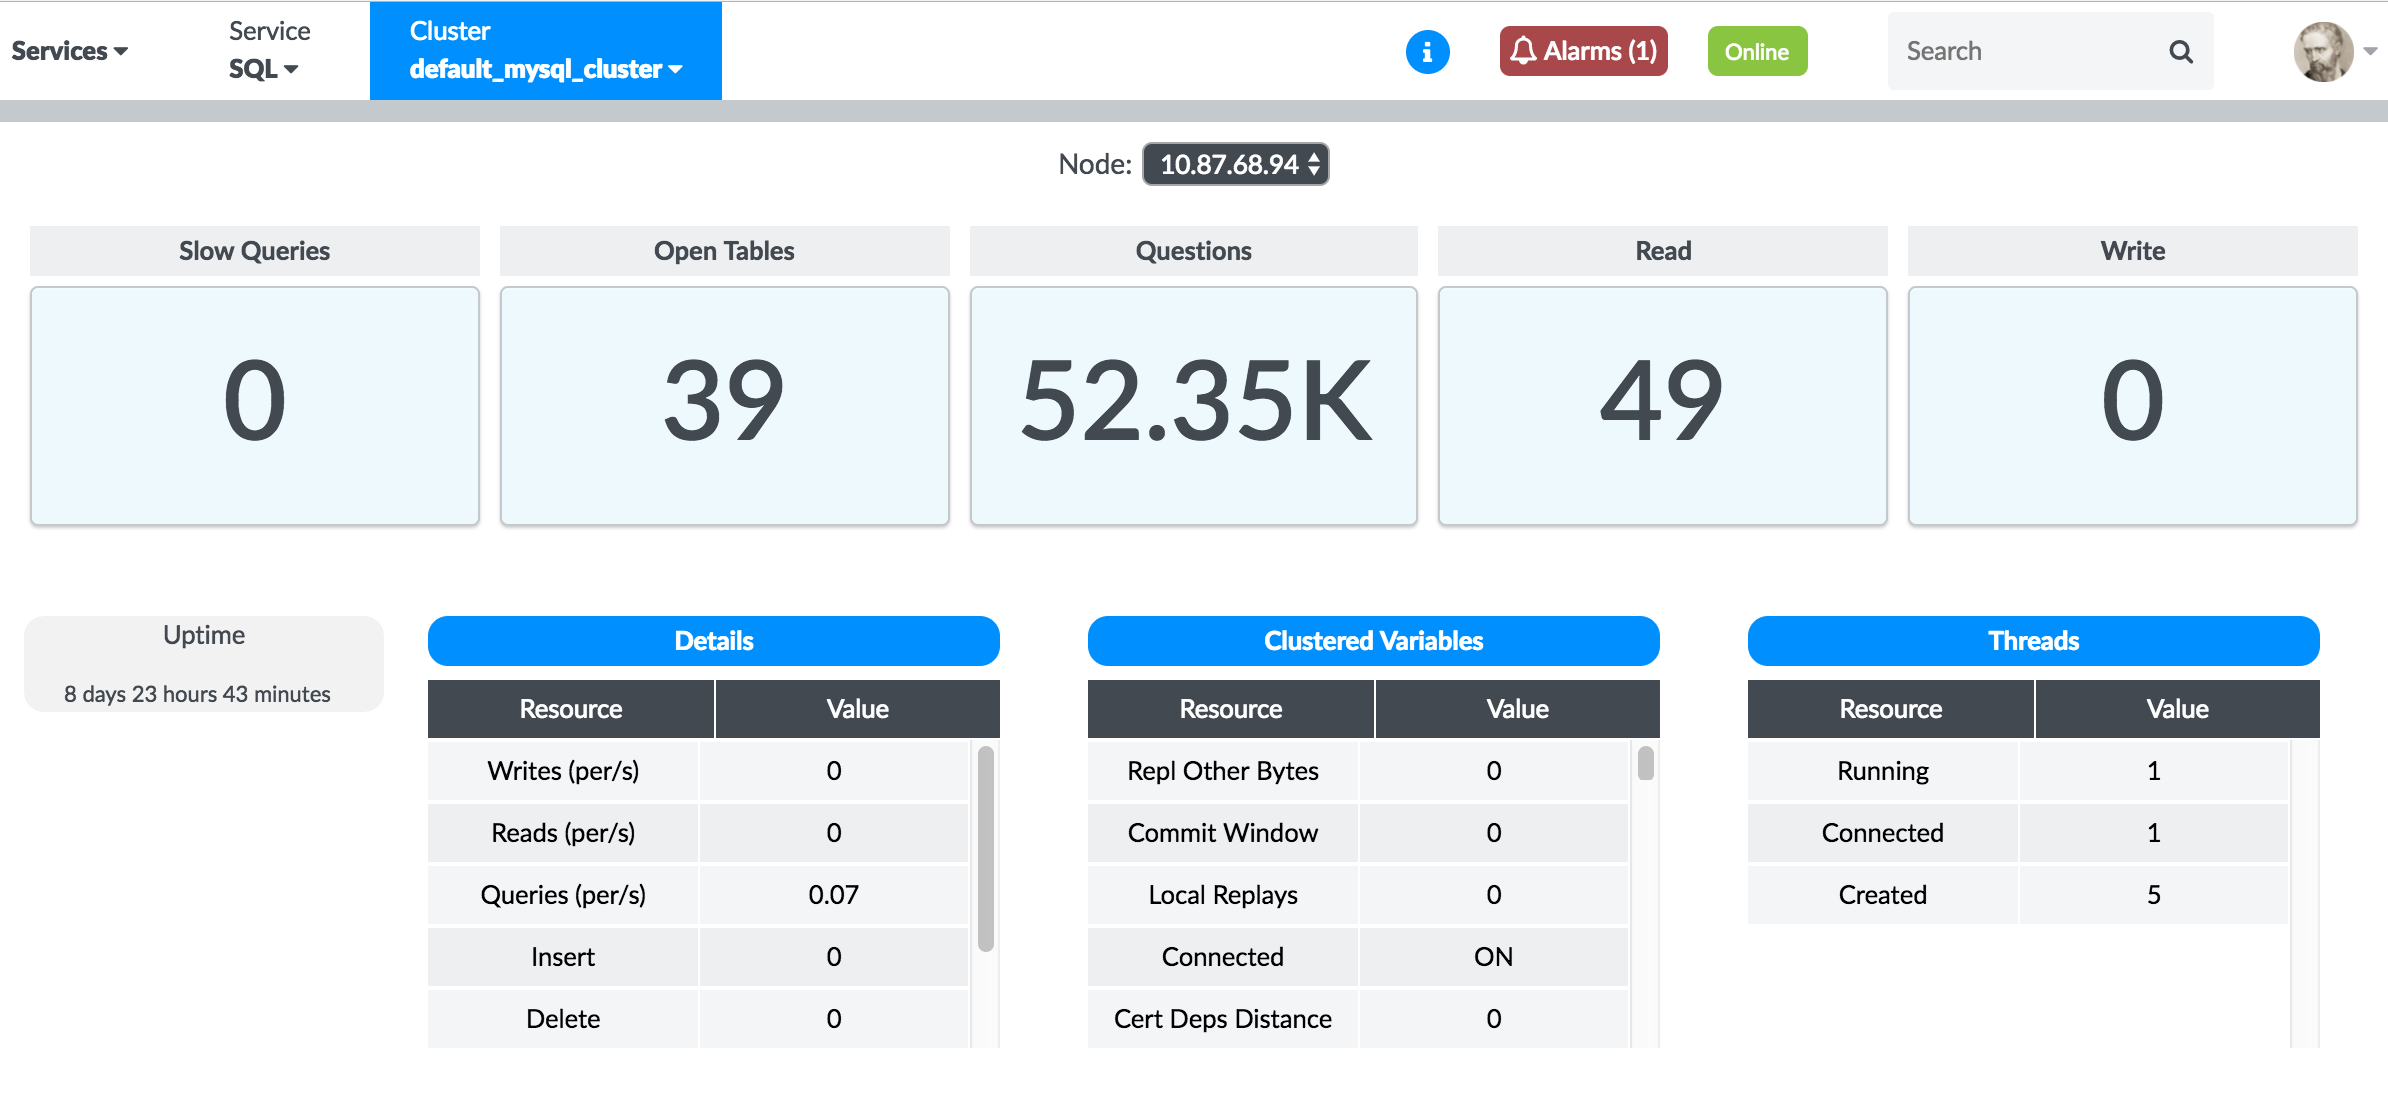
Each MySQL cluster has a dashboard displaying real-time usage metrics for each of its nodes, as shown in Figure 25.
Real-Time Charts
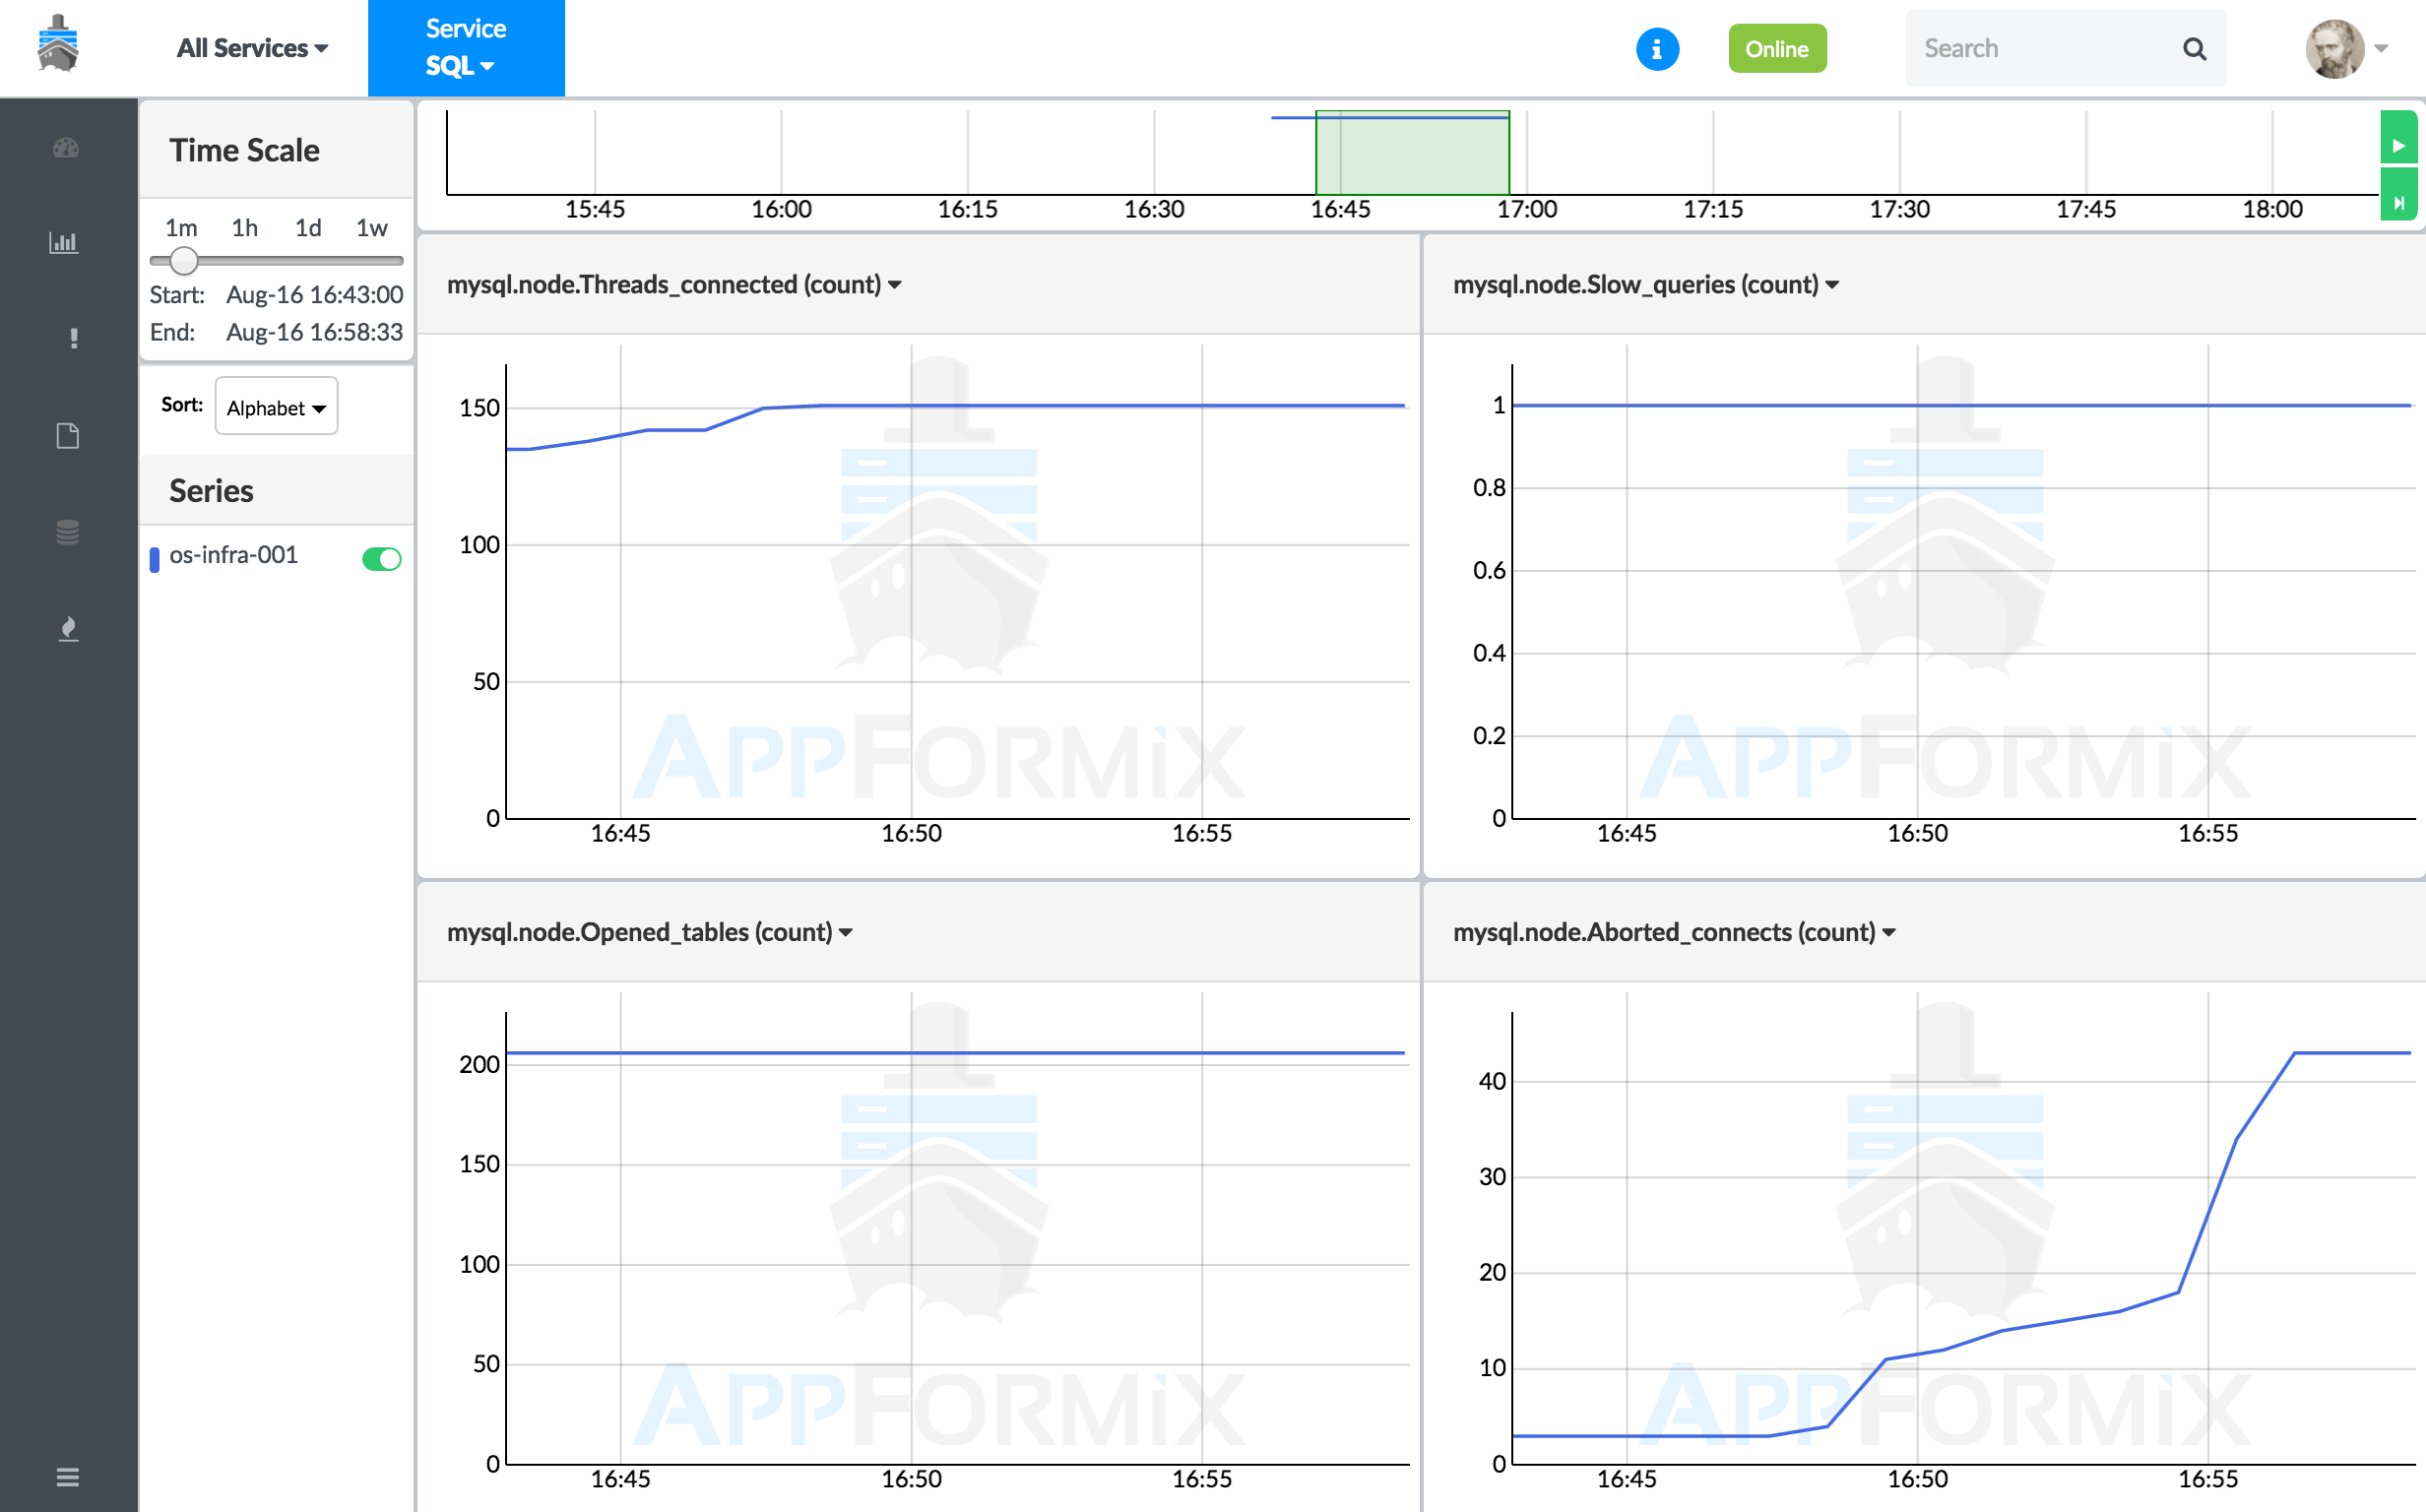
From the context menu, select All Services > MySQL. Click the Charts icon from the left navigation pane. Figure 26 shows MySQL performance metric charts.
Service Alarms
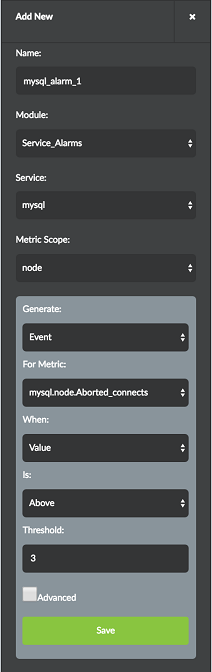
An alarm can be configured for any of the MySQL metrics collected. In the Alarm pane, select the Service Alarms module. Then select mysql from the Service drop-down list. MySQL alarms can be created for one or more MySQL nodes. Additionally, Notifications can also be configured for MySQL Alarms. Figure 27 shows the Alarm Input pane for MySQL alarm configuration.
Configuration
For Contrail Insights to monitor MySQL metrics, there must exist a MySQL user with remote, read-permission. In this topic, we create a new user with read-only access to the database. Alternately, an existing user account can be used.
To configure MySQL monitoring:
Create a read-only user account 'appformix' that can access the MySQL database from any host:
$ mysql -u root -p
mysql> grant SELECT on *.* to ''appformix’'@’'%’'' identified by 'mypassword';
mysql> flush privileges;
Change 'mypassword' to a strong password. Optionally, you may restrict the 'appformix' account to only connect from a specific IP address or hostname by replacing '%' with the host on which Contrail Insights Platform runs.
Next, configure the MySQL connection details in Contrail Insights. From the Settings menu, select Service Settings. Then, select the MySQL tab.
Enter the host and port on which MySQL runs. The default port for MySQL is 3306.
Enter the username and password from Step 1. Finally, click the Setup button. On success, the button changes to Submitted. Figure 28 shows MySQL connection and credential settings.
Figure 28: My SQL Connection and Credential Settings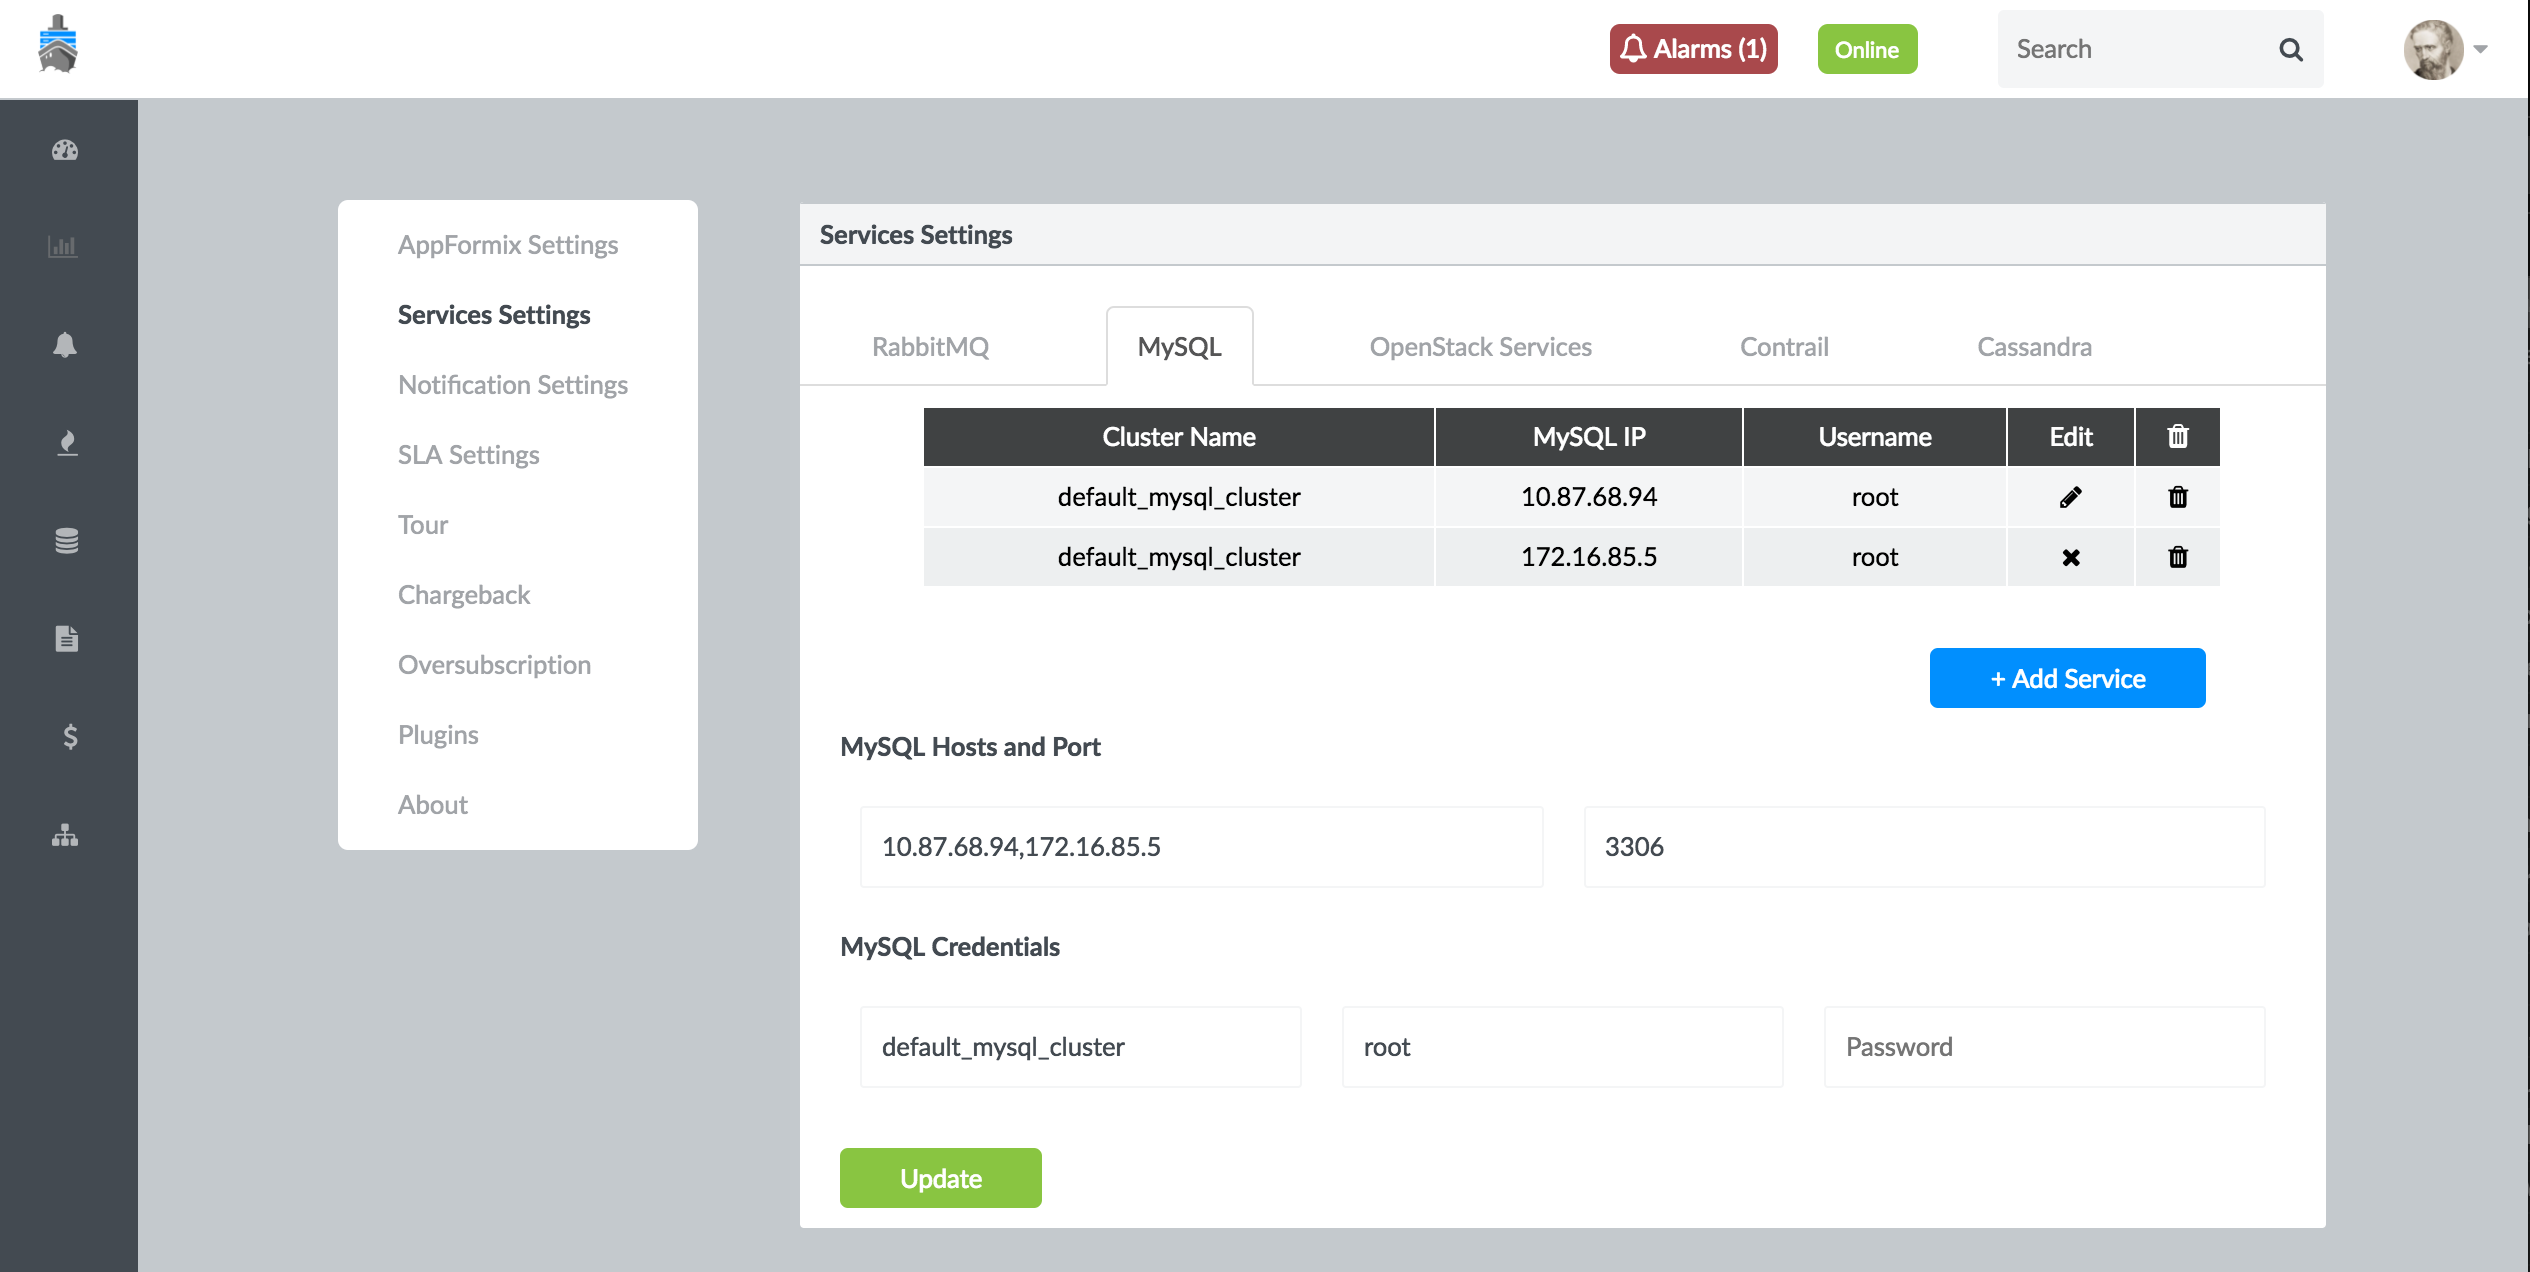
OpenStack Services Monitoring
Contrail Insights monitors Keystone, Nova, and Neutron services that power the OpenStack cloud management system. Starting with Release 3.3.4, Contrail Insights also monitors Octavia that provides load balancing services.
Contrail Insights performs status checks for processes that implement the services on both controller and compute hosts. The overall connectivity to each API and the status of components that comprise of these services, are also monitored.
Overall connectivity is monitored in the following ways:
Component service list in the case of Nova and Keystone.
API call for listing all load balancers in the case of Octavia.
Agent list in the case of Neutron.
For example, if the nova-api sub-service is up and responds
to the API call successfully, then the Health of the default_openstack_cluster_status for Nova will be Good - even if an individual sub-service of Nova has
failed.
As an alternative example, consider that the nova-scheduler
is not running. In such a scenario, if the API call to list the status
of Nova sub-services succeeds, then the default_openstack_cluster_status will be Good. However, health of the nova-scheduler will be Bad.
- Using Dashboard to View Current and Historical Status
- Configuring Service Alarms
- OpenStack Configuration Parameters
Using Dashboard to View Current and Historical Status
You can view the current status and the historical status of a service over a specified period of time in the Dashboard.
To view the current status or historical status of a service, select Dashboard from the left pane and select the name of a service from Services list.
To view the current status or historical status of a service,
Select Dashboard from the left pane and then select Services from the context menu at the top.
The Service list appears next to Services.
Select Keystone from the Service list.
The Resource Availability pane is displayed showing the OpenStack Keystone nodes in real-time (current status) availability. See Figure 29.
Figure 29: OpenStack Keystone Nodes Real-Time Availability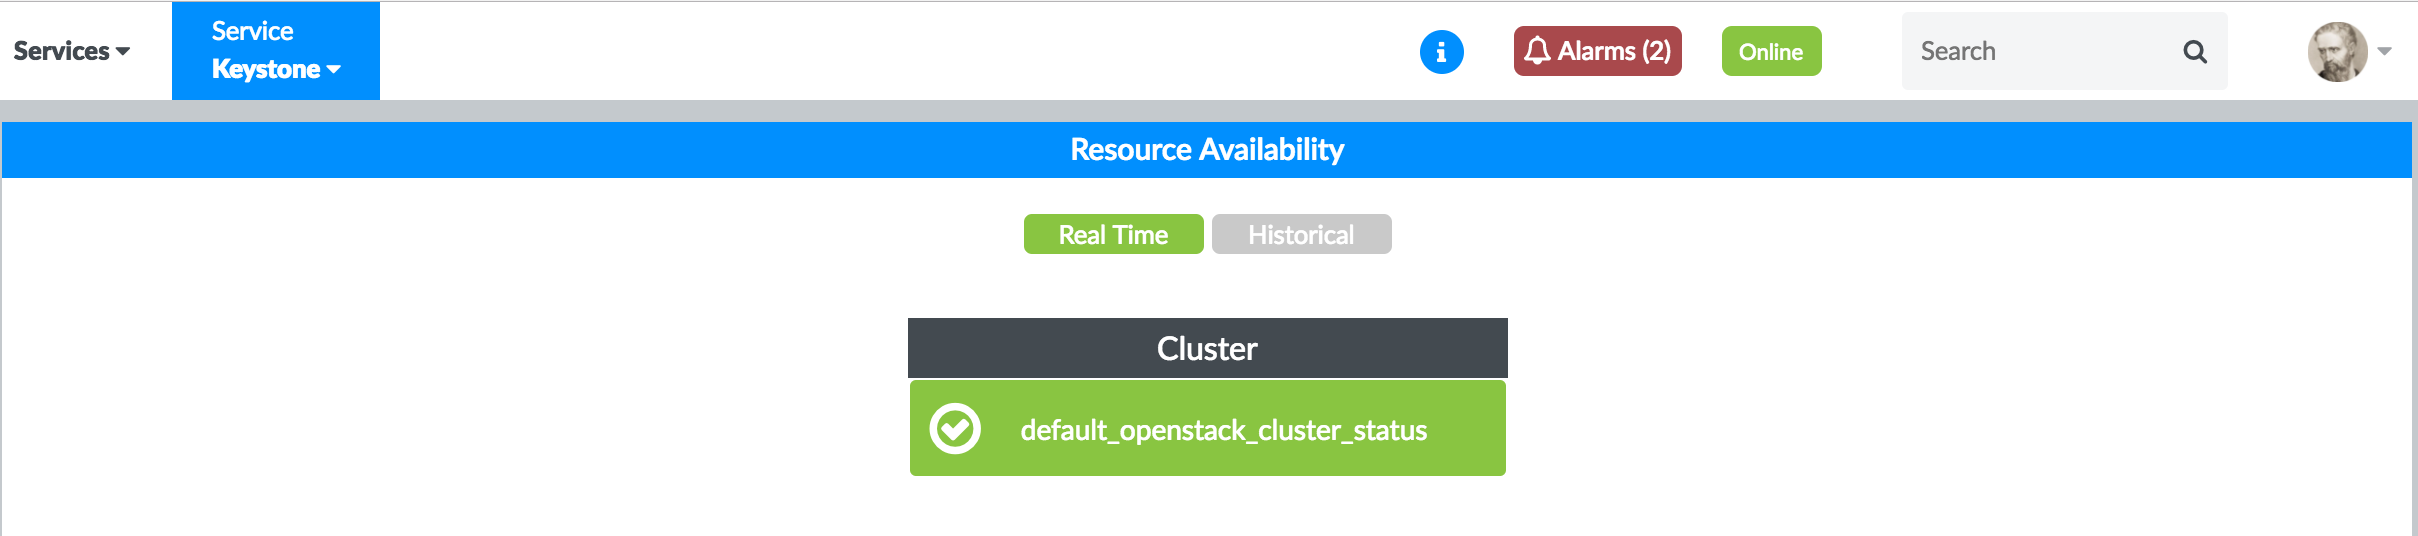
Figure 30 and Figure 37 are examples of real-time availability of OpenStack Nova and OpenStack Neutron nodes.
Figure 30: OpenStack Nova Nodes Real-Time Availability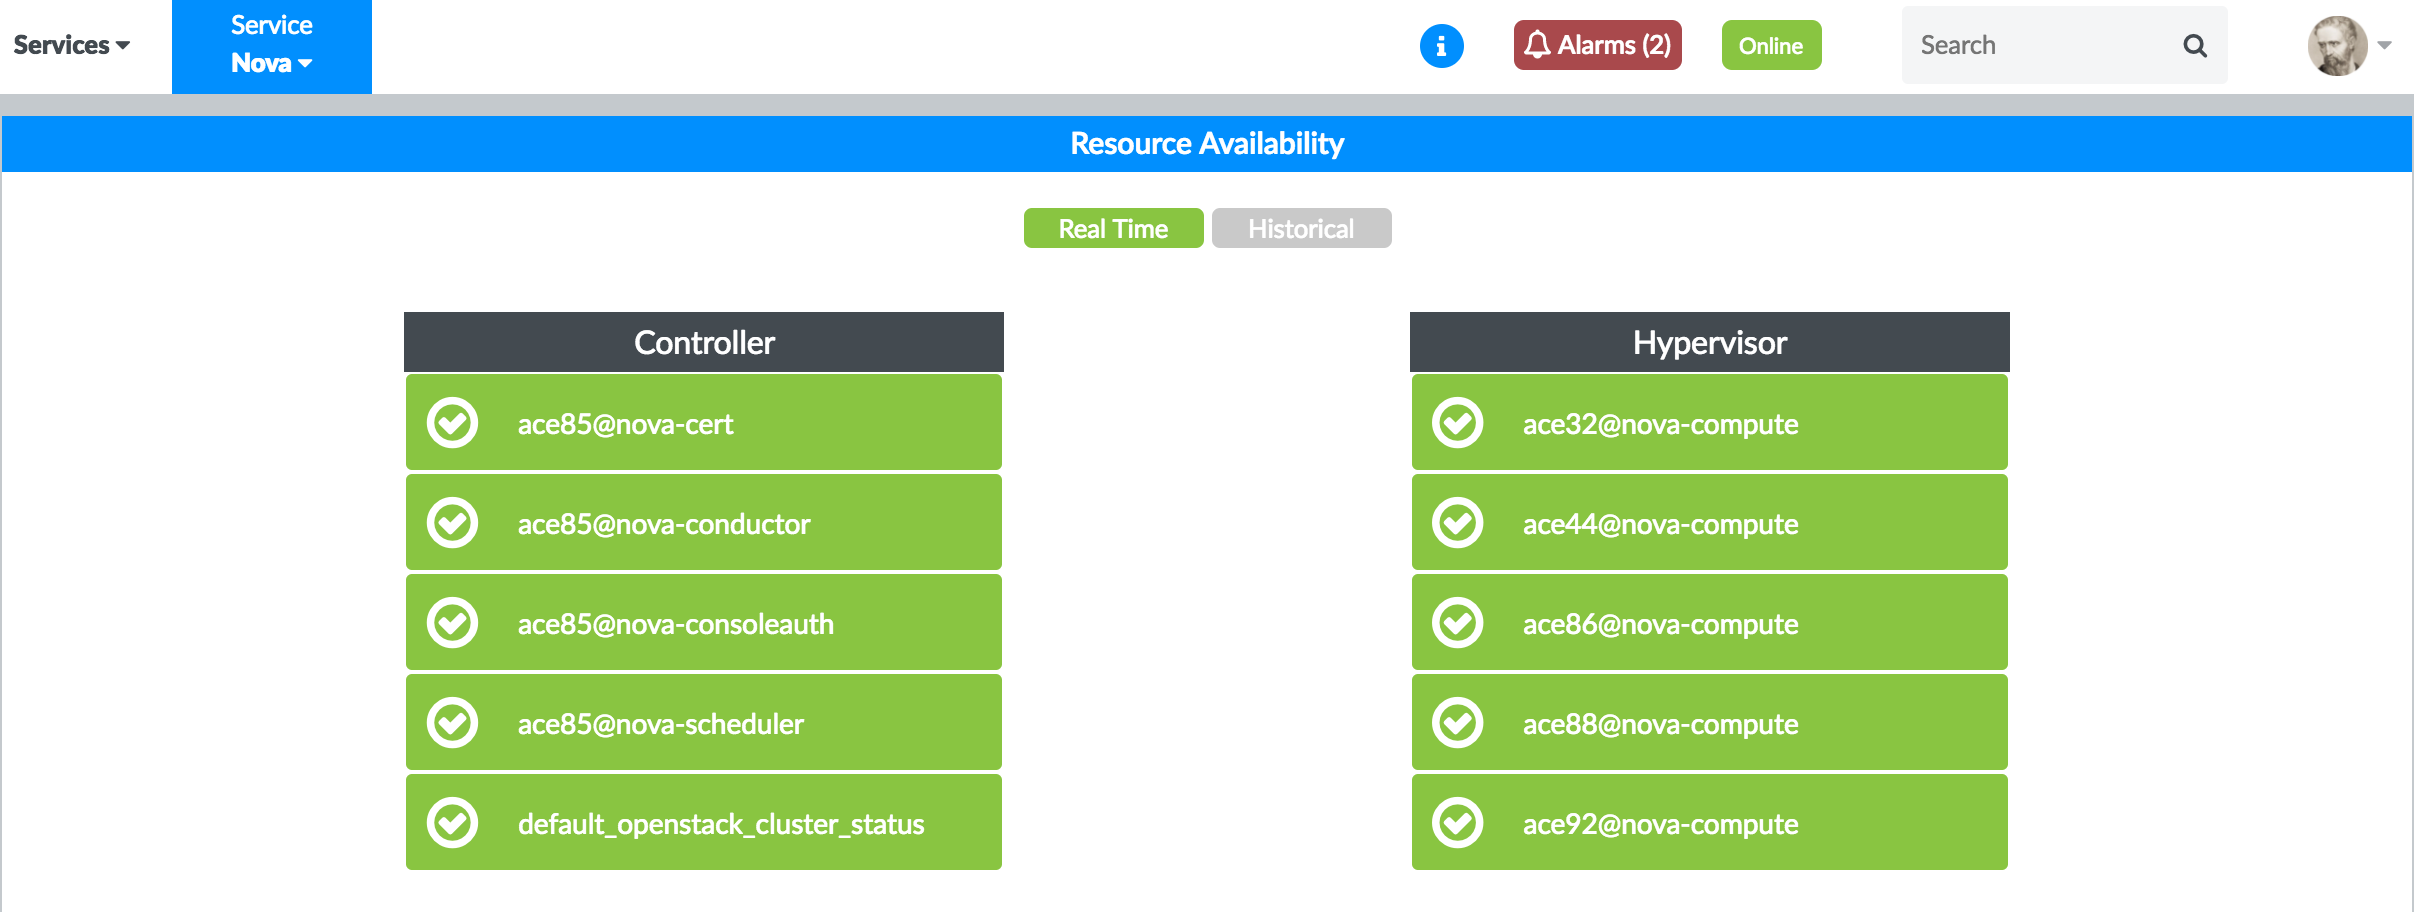 Figure 31: OpenStack Neutron Nodes Real-Time Availability
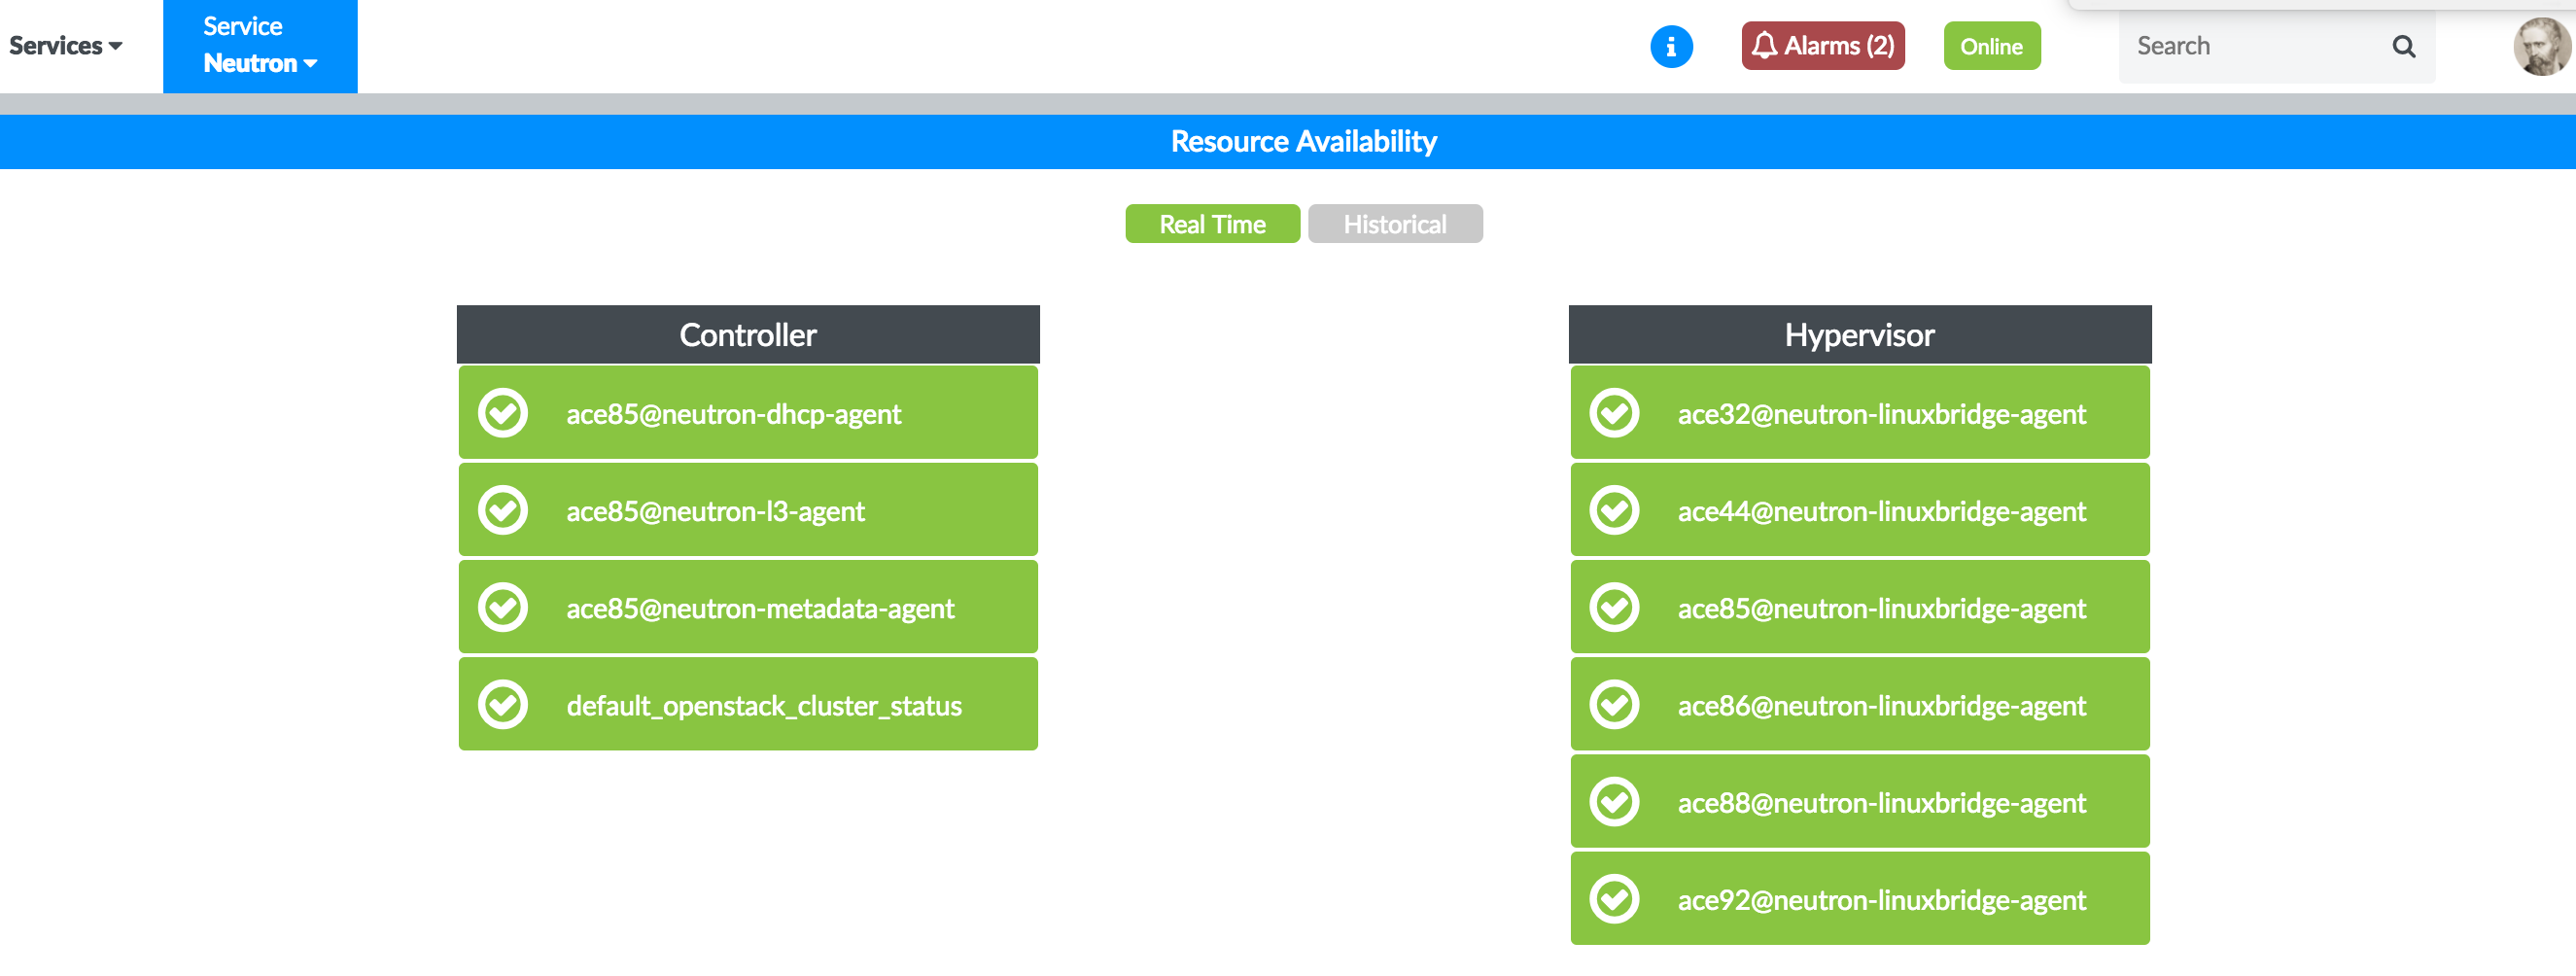
To view historical availability of a service, click Historical in the Resource Availability pane.
For example, Figure 32 shows the historical availability of the OpenStack Keystone nodes.
Figure 32: OpenStack Keystone Nodes Historical Availability
You can also view historical availability of a service in a particular period.
To view historical availability of a service for a particular period, select start date and time from the Start list and end date and time from the End list, and click Update Charts.
Figure 33 and Figure 34 are examples of historical availability of OpenStack Nova nodes and OpenStack Neutron nodes.
Figure 33: OpenStack Nova Nodes Historical Availability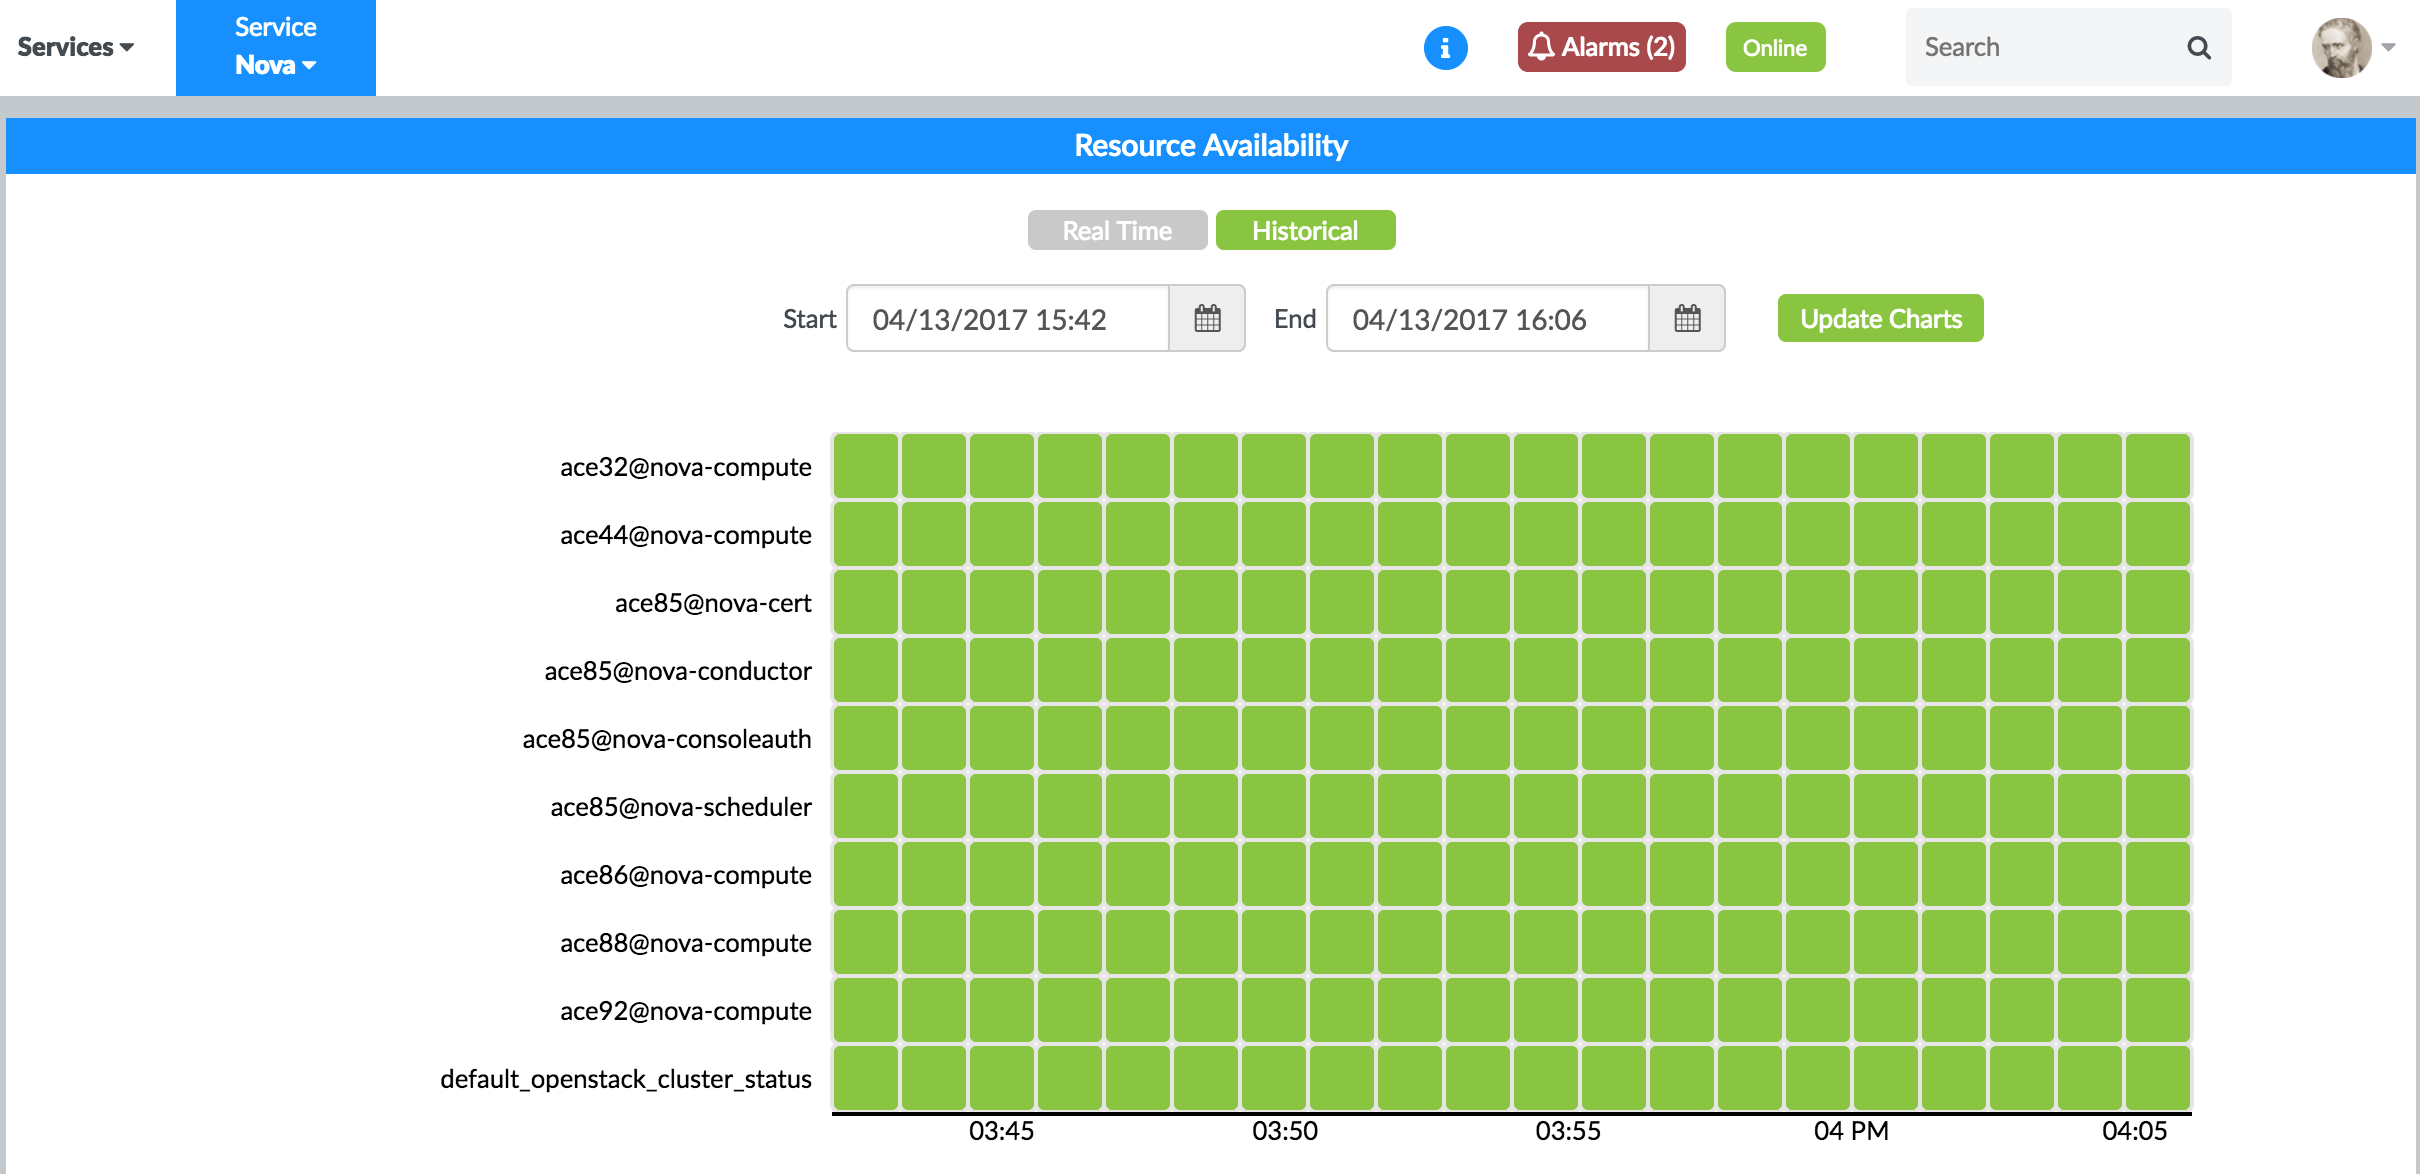 Figure 34: OpenStack Neutron Nodes Historical Availability
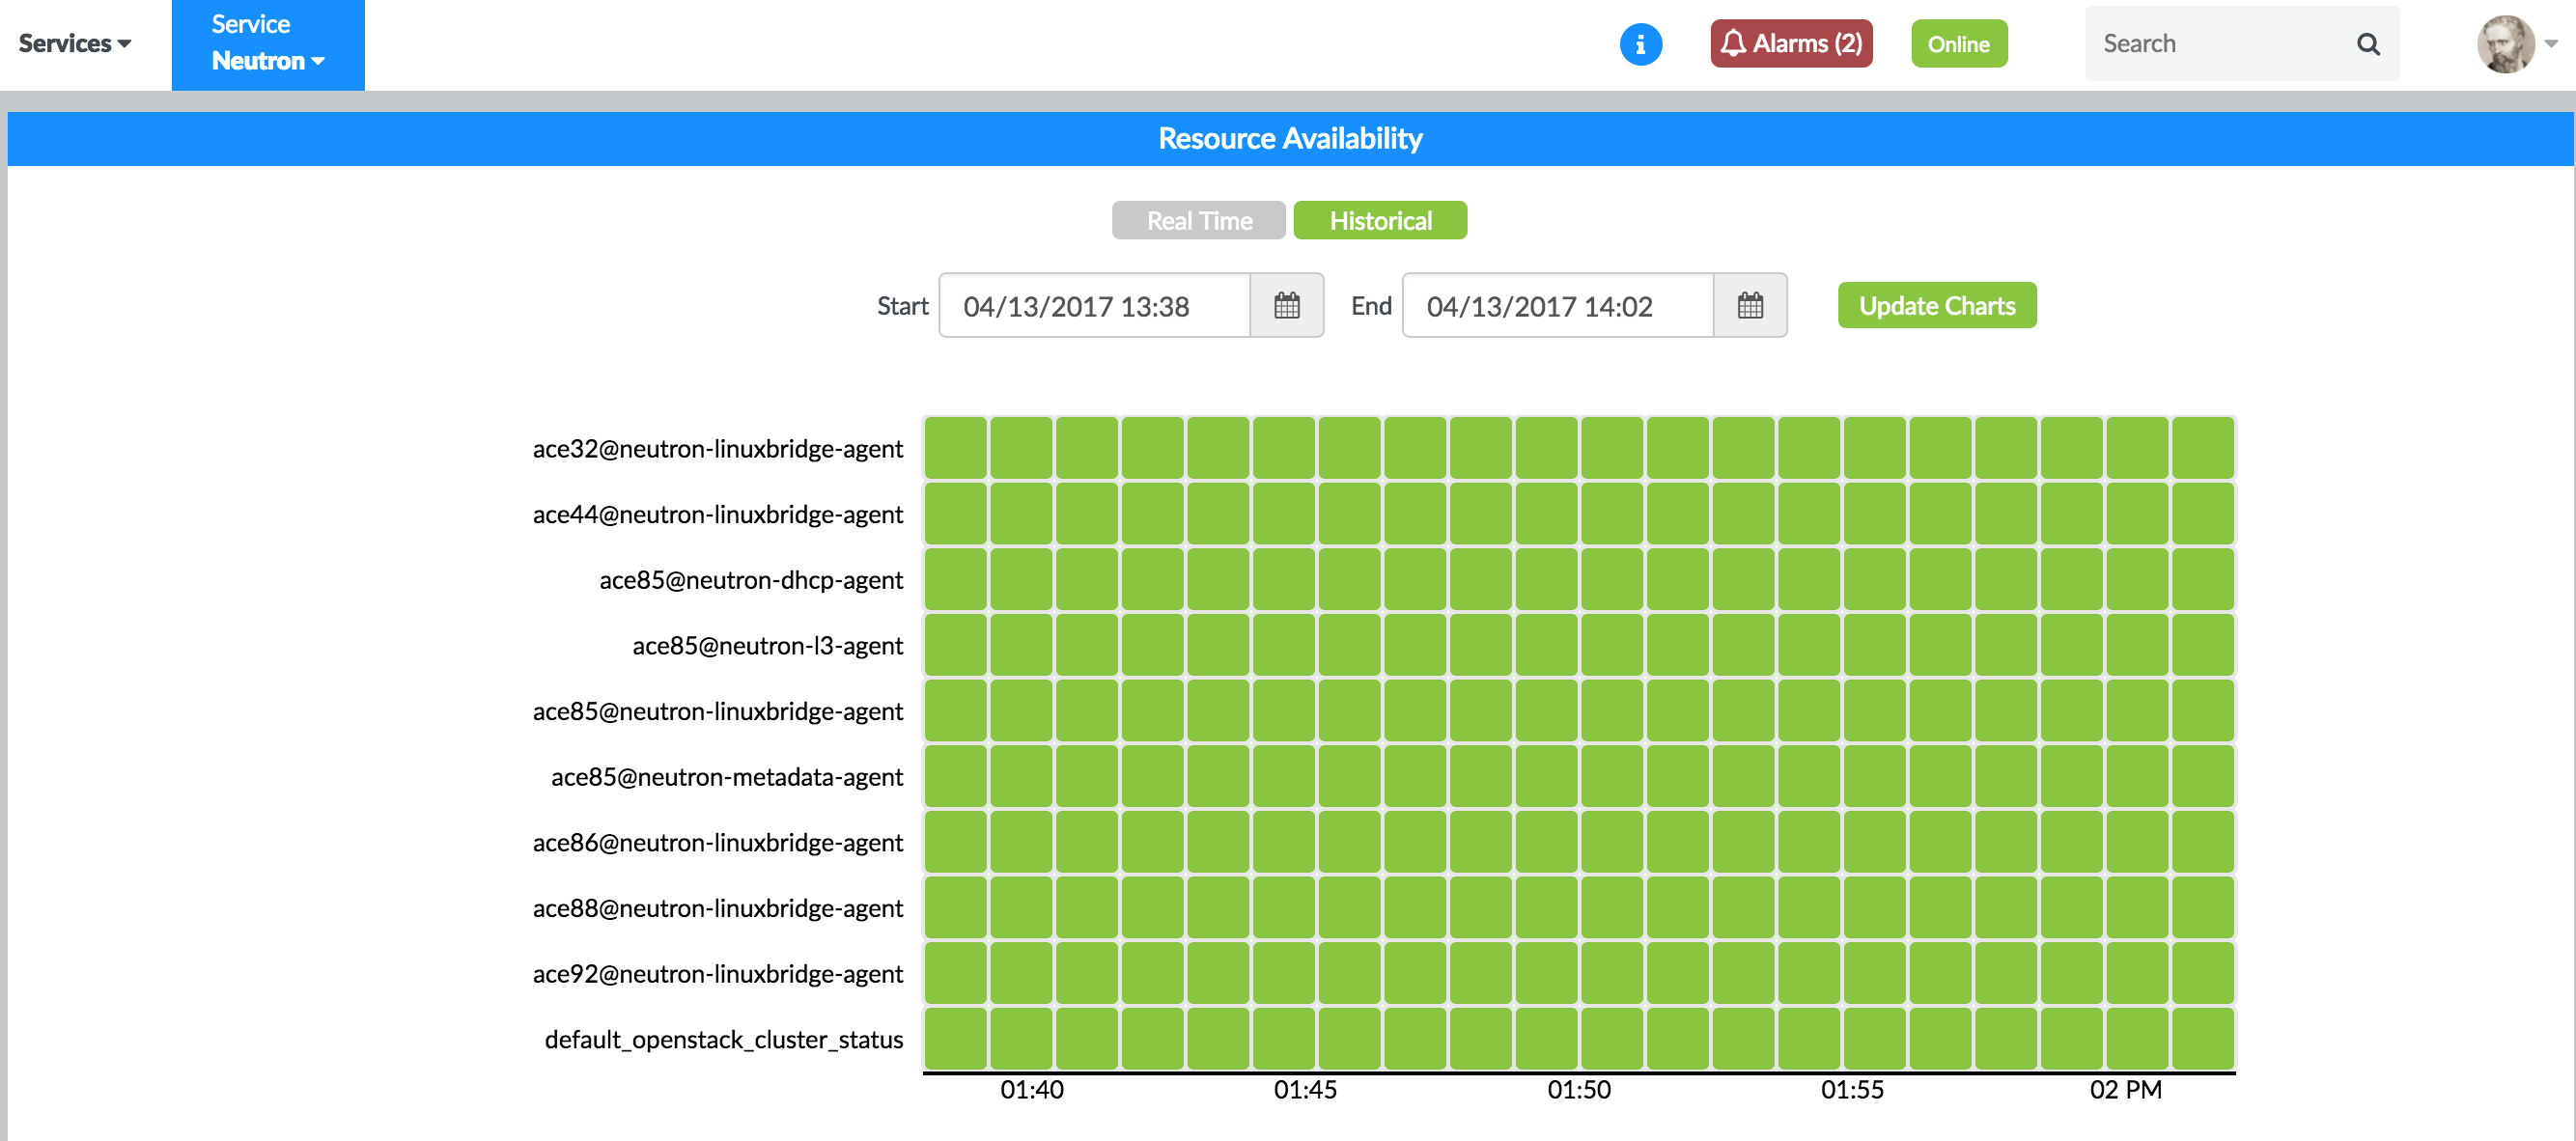
Configuring Service Alarms
An alarm can be configured for any OpenStack services.
To configure an alarm, select the Service Alarms module from the Alarm pane. Then select openstack from the Service drop-down list.
The metrics for which alarms can be configured are broadly categorized into three scopes:
| Cluster | Heartbeat metrics, such as liveness checks for Nova, Neutron, Octavia, and Keystone APIs. |
| Host | Allocation of resources on compute hosts. Alarms can be configured for absolute count or as a percentage of host capacity. Metrics include virtual CPU (vCPU), memory, and local storage. |
| Project | Allocation of resources by a project. Alarms can be configured for absolute count or as a percentage of project quota. Resource metrics include instances, vCPU, memory, storage, floating IP addresses, and security groups. |
As with other alarms, notifications can also be configured for any OpenStack service alarm, as shown in Figure 35.
SLA profiles can be configured for Nova, Neutron, Octavia, and Keystone by navigating to the Settings > SLA Settings page. You can then select the appropriate tab for the service. A list of rules can be defined for both Health and Risk.

OpenStack Configuration Parameters
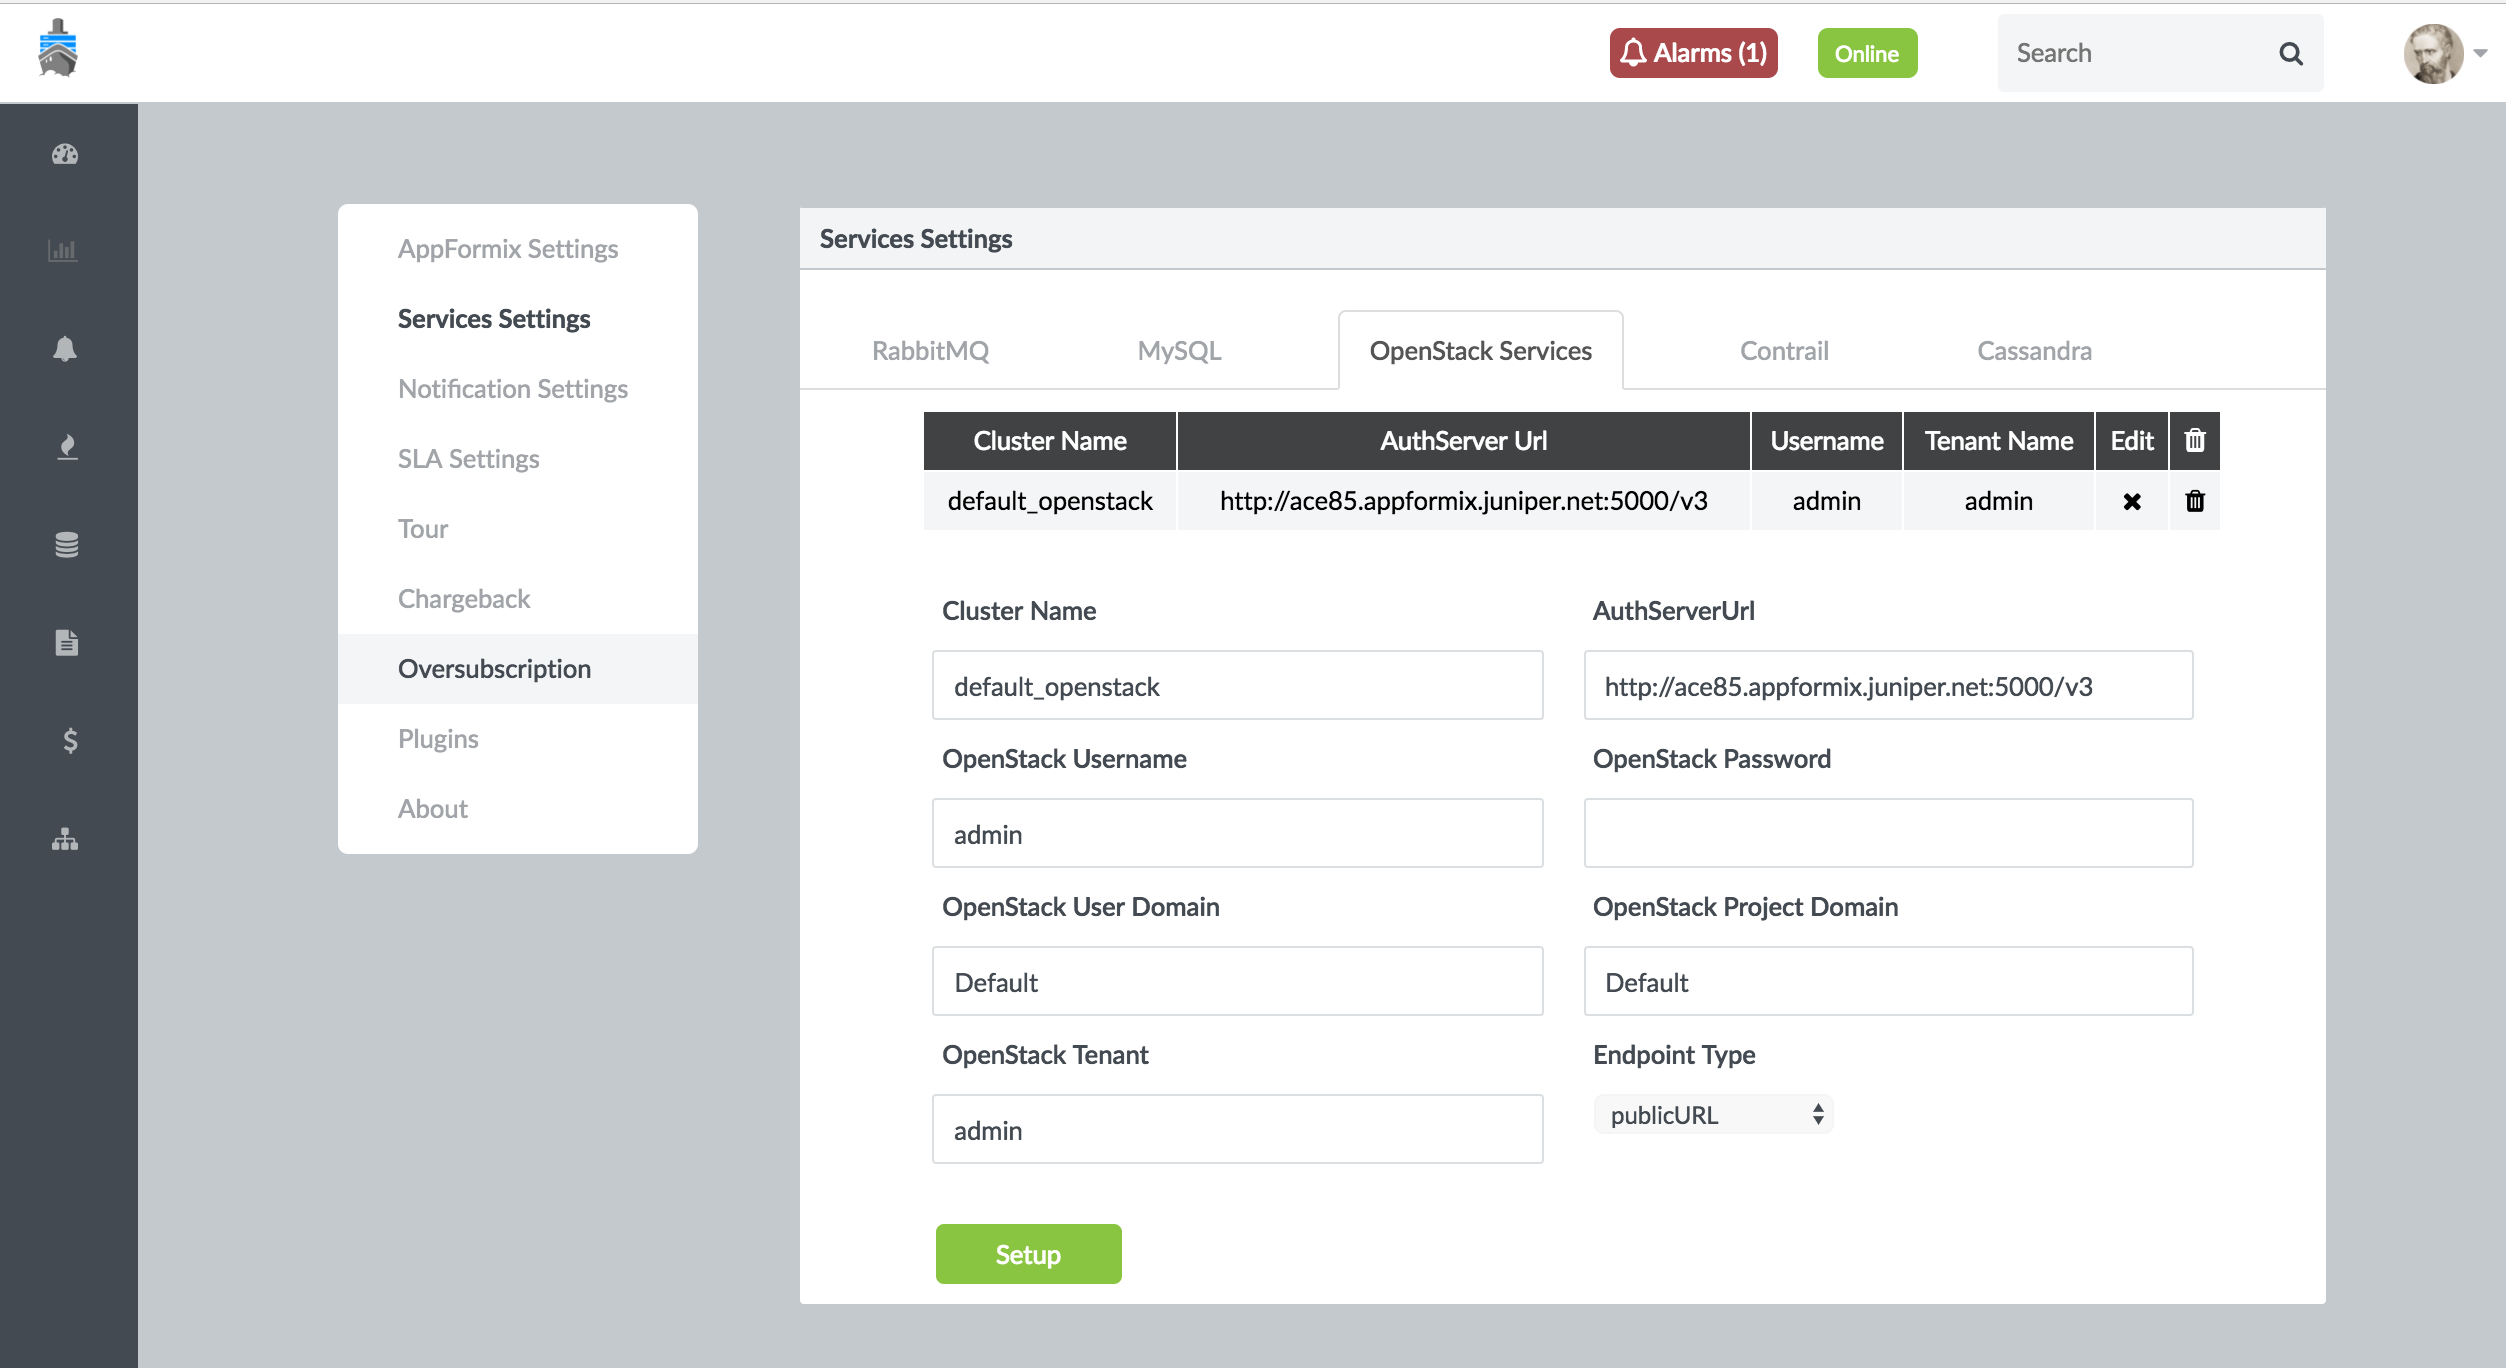
The OpenStack configuration parameters provided during Contrail Insights installation are sufficient for monitoring OpenStack services. No additional configuration is required. To modify the current values, from the Settings menu, select Service Settings. Then select the OpenStack Services tab. Figure 36 shows the OpenStack services settings and configuration parameters.
RabbitMQ Monitoring
OpenStack depends on RabbitMQ to deliver messages between services. Contrail Insights Service Monitoring can be used to monitor RabbitMQ metrics through real-time charts. Service alarms can also be configured for these metrics.
Resource Availability
The connectivity of nodes for each of the configured Rabbit clusters is recorded periodically. You can view both the current status, as well as the historical status over a specified period of time by selecting Services > RabbitMQ from the context menu at the top, and selecting Dashboard in the left pane.
Dashboard
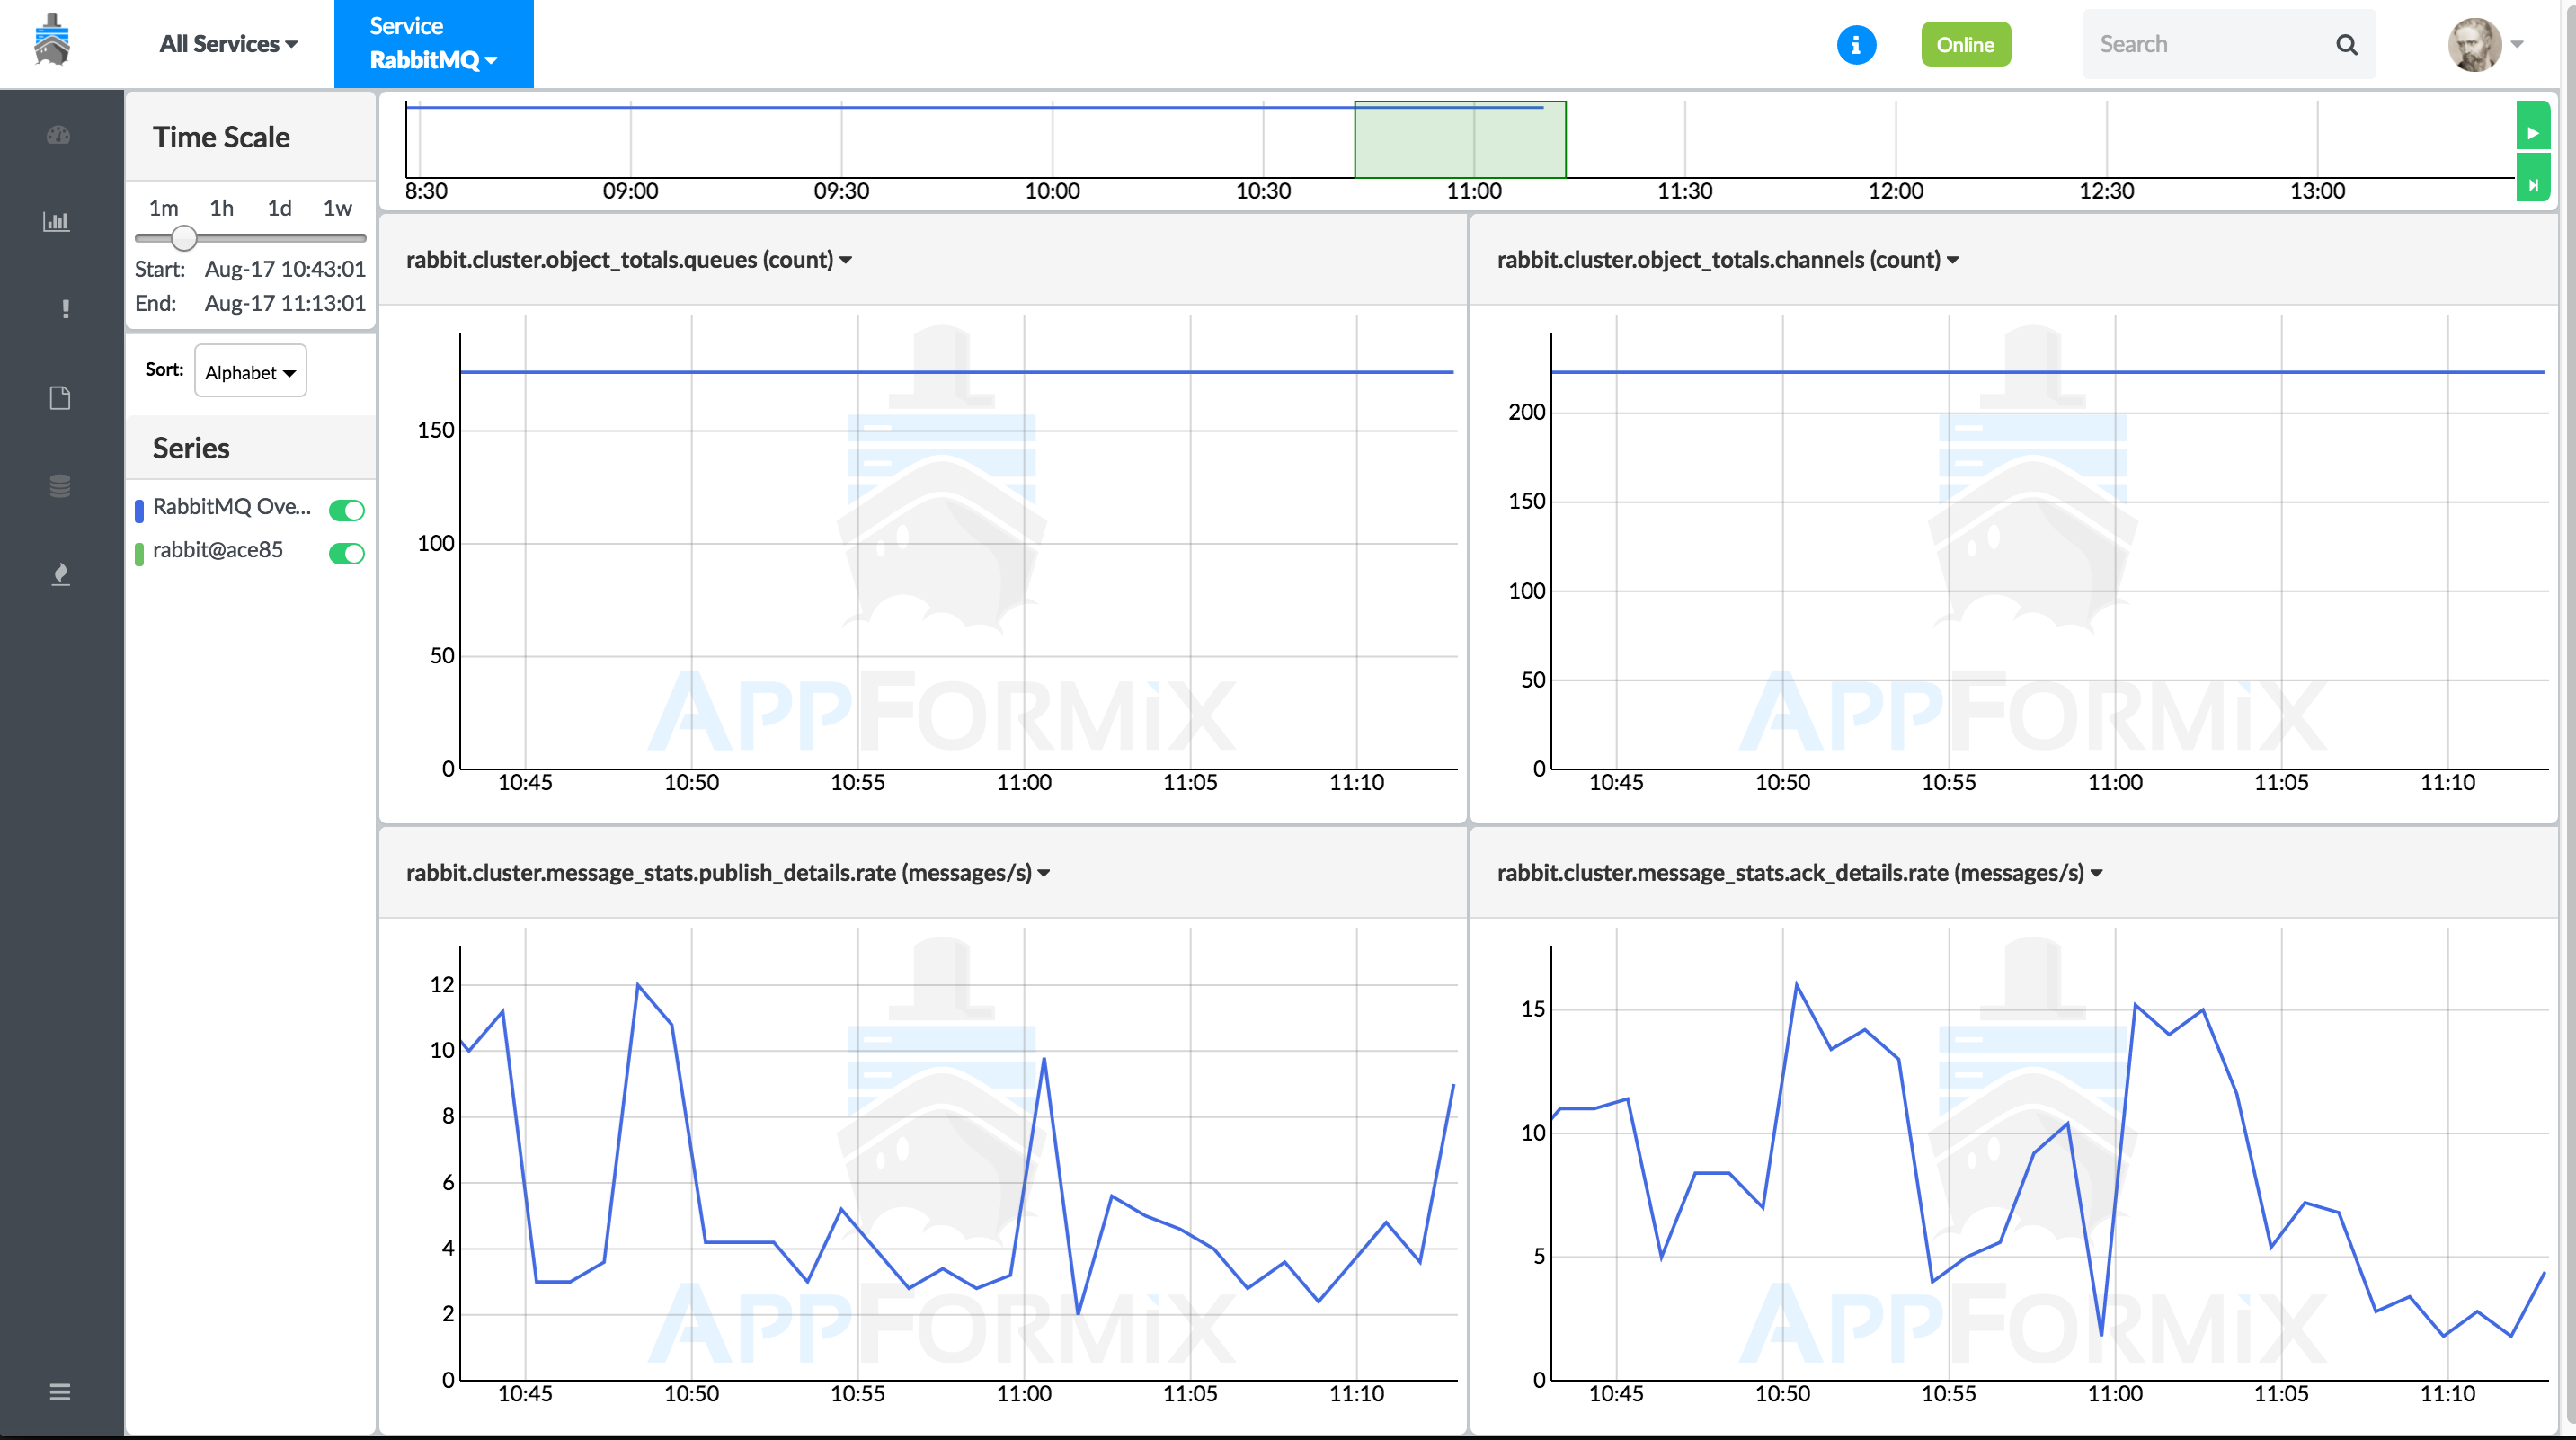
The Dashboard also provides detailed metrics for a single RabbitMQ cluster, as shown in Figure 37. Select Dashboard in the left pane, then Services > RabbitMQ in the top context menu, and then select a Rabbit Cluster by name.

The counters in the top pane display the number of active channels, connections, consumers, exchanges, and queues. Below, tables display statistics about message rates across the cluster, and per-node resource consumption.
Real-Time Charts
Contrail Insights UI provides a real-time view of RabbitMQ metrics.
Follow these steps to view RabbitMQ metrics in real time.
Select Dashboard from the left-nav pane.
The Contrail Insights dashboard is displayed.
When in the Dashboard view, select Services from the context menu.
The Service drop-down list is displayed.
Select RabbitMQ from the service drop-down list.
The Resource Availability page is displayed.
Click the Charts icon in the left-nav pane to view real-time metric charts.
Figure 38 shows RabbitMQ real-time metric charts.
Service Alarms
In releases prior to Contrail Insights Release 3.3.0, you can configure a service alarm to monitor RabbitMQ metrics by selecting Alarms from the left-nav pane. For more information on alarms, see Alarms.
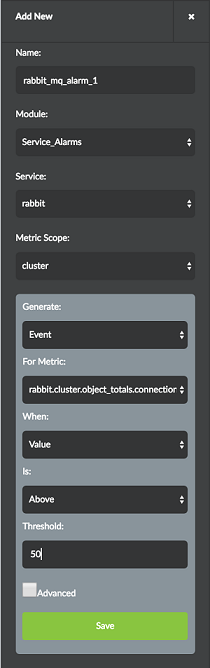
Ensure that you select Service_Alarms for the module, and rabbit for the service. An alarm can be configured for a metric on a per-cluster, per-node, or per-queue basis. After you have selected the appropriate metric scope, you then choose a metric to monitor. As with other alarms, you can optionally configure Notifications in the Advanced settings. Figure 39 shows the RabbitMQ alarm configuration pane.
Alarms
Starting with Contrail Insights Release 3.3.0, you can configure alarms to monitor RabbitMQ metrics.
Follow these steps to configure alarms to monitor RabbitMQ metrics from the Contrail Insights UI.
Select Alarms from the left-nave pane.
The Alarms page and the Alarms pane is displayed.
Click Add Rule in the Alarms pane on the left.
The Add New Rule pane is displayed. See Figure 40.
Figure 40: Configure Alarm - Add New Rule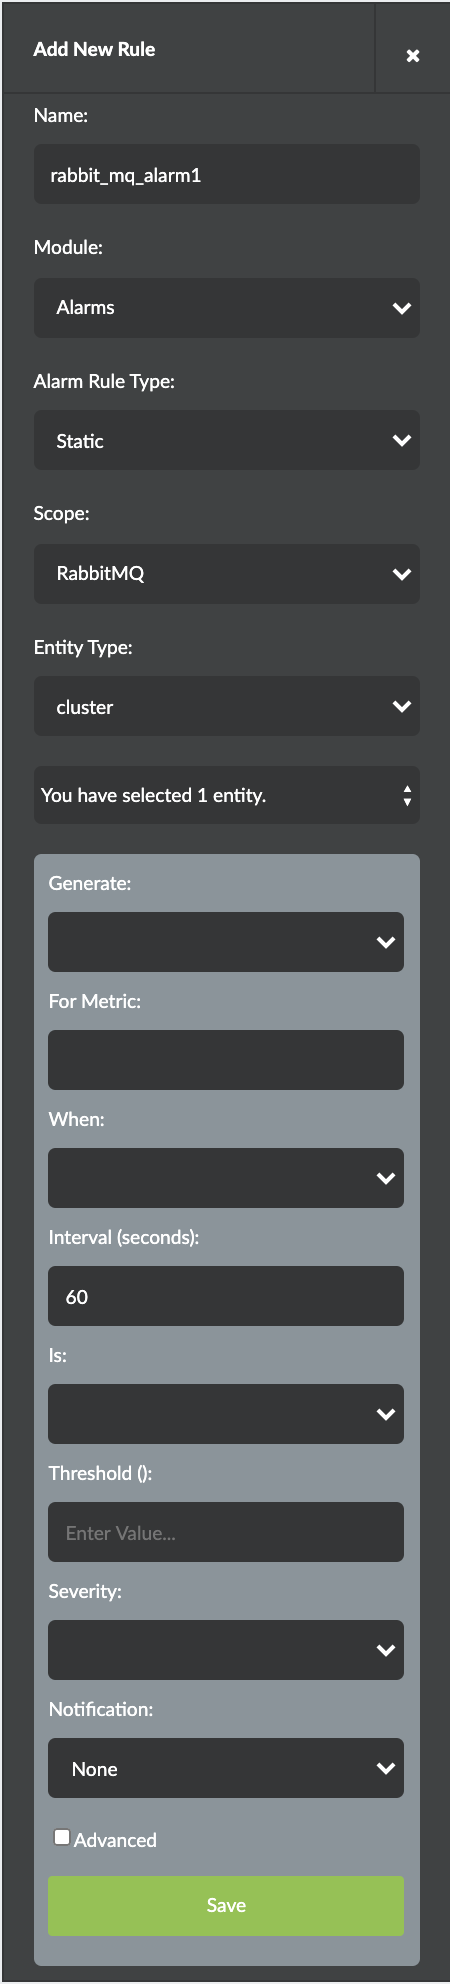
Enter the following information as given in Table 2.
Table 2: Configure New Alarm Field
Action/Description
Name
Enter a name for the alarm.
Module
Select Alarms from the module drop-down list.
Alarm Rule Type
Select Static or Dynamic from the drop-down list.
Scope
Select RabbitMQ as the alarm scope from the drop-down list.
Entity Type
Select cluster from the drop-down list.
Note:An alarm can be configured for a metric on a per-cluster, per-node, or per-queue basis.
In the Generate section,
Select a generate option from the Generate drop-down list.
You can either select Generate Event or Generate Alert.
Select a metric to monitor from the For Metric drop-down list.
Select from when you want to monitor the metric from the When drop-down list.
Enter the interval (in seconds) in the Interval (seconds) field.
60 seconds is the default value.
Select the Is parameter from the Is drop-down list.
Enter the threshold value in the Threshold (Number of connections in blocked or blocking state) field.
Select the level of severity from Severity drop-down list.
Select notification type from the Notification drop-down list.
(Optional) Select the Advanced check box to configure the following advanced interval settings.
Intervals with Exception
1 is the default value.
Of Last Intervals
1 is the default value.
Status
Options: Enable, Disable
Click Save to save configuration for this alarm.
Configuration
For Contrail Insights to be able to collect metrics from RabbitMQ, the RabbitMQ management plug-in must be enabled, and Contrail Insights must be configured with user credentials to collect RabbitMQ metrics.
To configure RabbitMQ monitoring:
Enable the RabbitMQ plug-in by issuing the following commands on the host that runs RabbitMQ:
$ rabbitmq-plugins enable rabbitmq_management
$ service rabbitmq-server restart
Contrail Insights requires RabbitMQ user credentials with privileges to read the metrics. You can use an existing RabbitMQ user with an administrator or monitoring role, or create a new user account. To create a user account with “monitoring” privileges, issue the following commands on the host that run RabbitMQ:"" "" ".*"
$ rabbitmqctl add_user appformix mypassword
$ rabbitmqctl set_user_tags appformix monitoring
$ rabbitmqctl set_permissions -p / appformix "" "" ".*"
Replace the sample
mypasswordwith a strong password.Verify the settings by opening http://<rabbit-host>:15672/ in a Web browser, and log in with the RabbitMQ user credentials.
Configure Contrail Insights with the details of the RabbitMQ cluster. Click Settings from the Dashboard. In the Services Settings page, select the RabbitMQ tab.
Enter the Rabbit Cluster URL from Step 1. Enter the username and password from Step 2. Click Setup. On success, the button changes to Submitted. Figure 41 shows the RabbitMQ URL and credential settings.
Figure 41: RabbitMQ URL and Credential Settings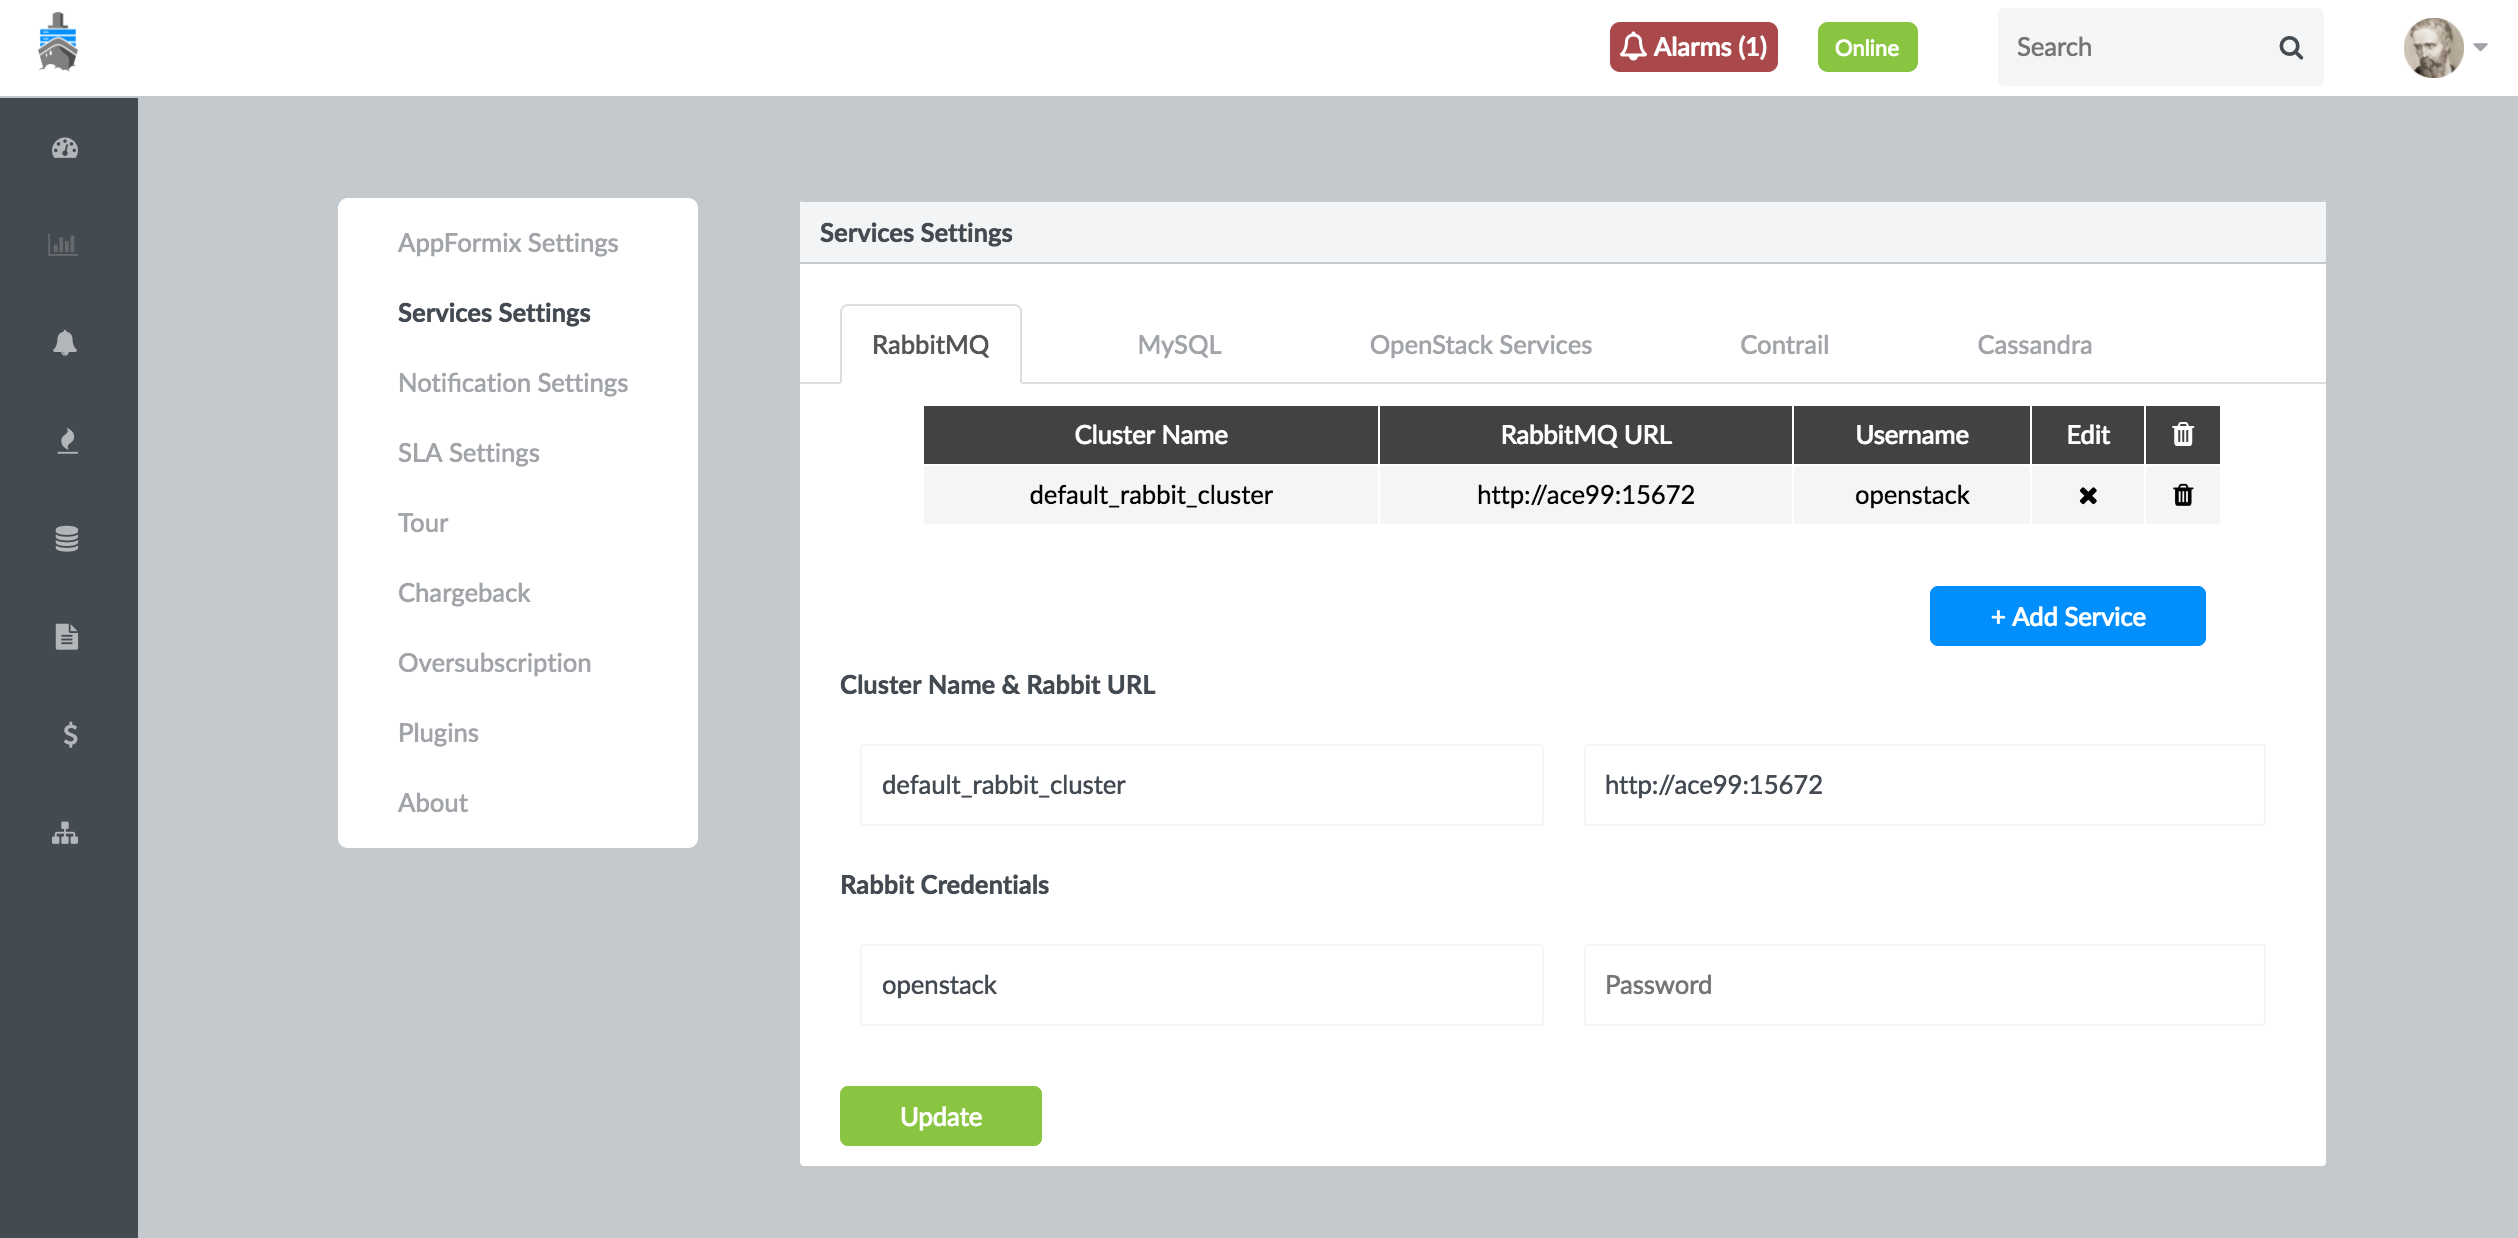
ScaleIO Monitoring
ScaleIO provides software-defined block storage. Contrail Insights metrics for ScaleIO performance and availability are available in real-time charts and alarms.
- Dashboard
- Real-Time Charts
- Real-Time Status of ScaleIO Components
- Service Alarms
- Per-Instance Storage Volume Metrics
- Configuration
Dashboard
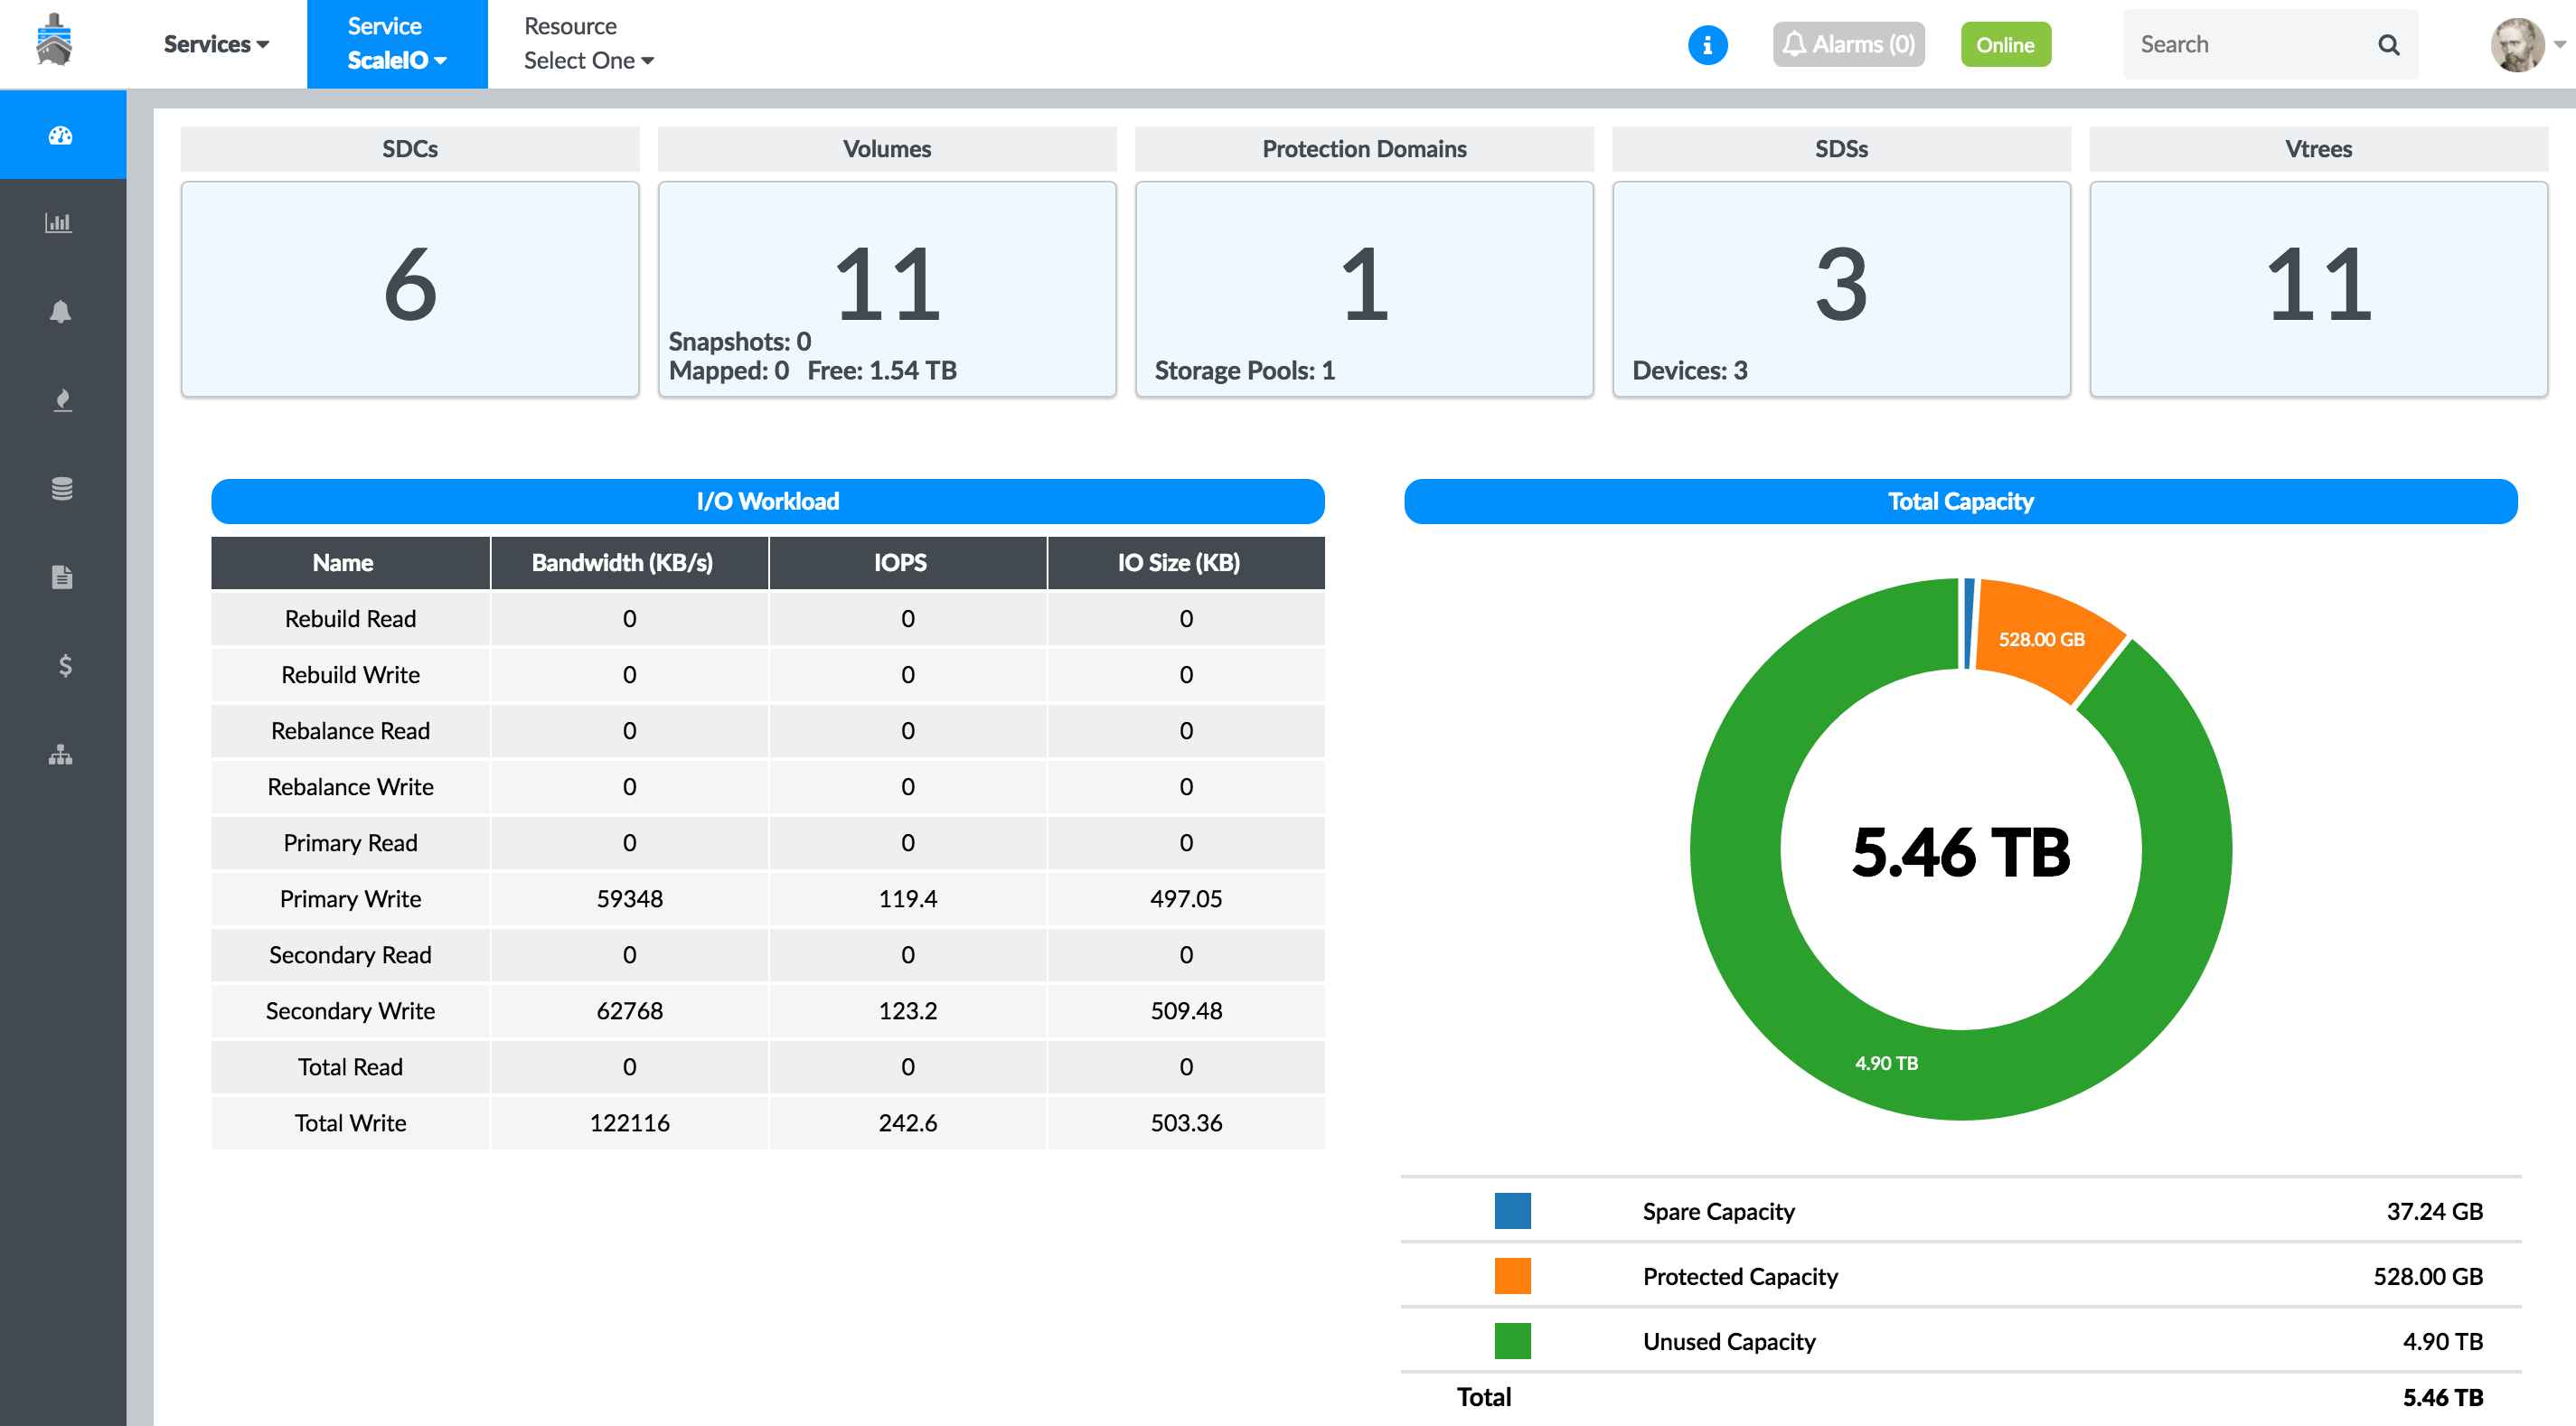
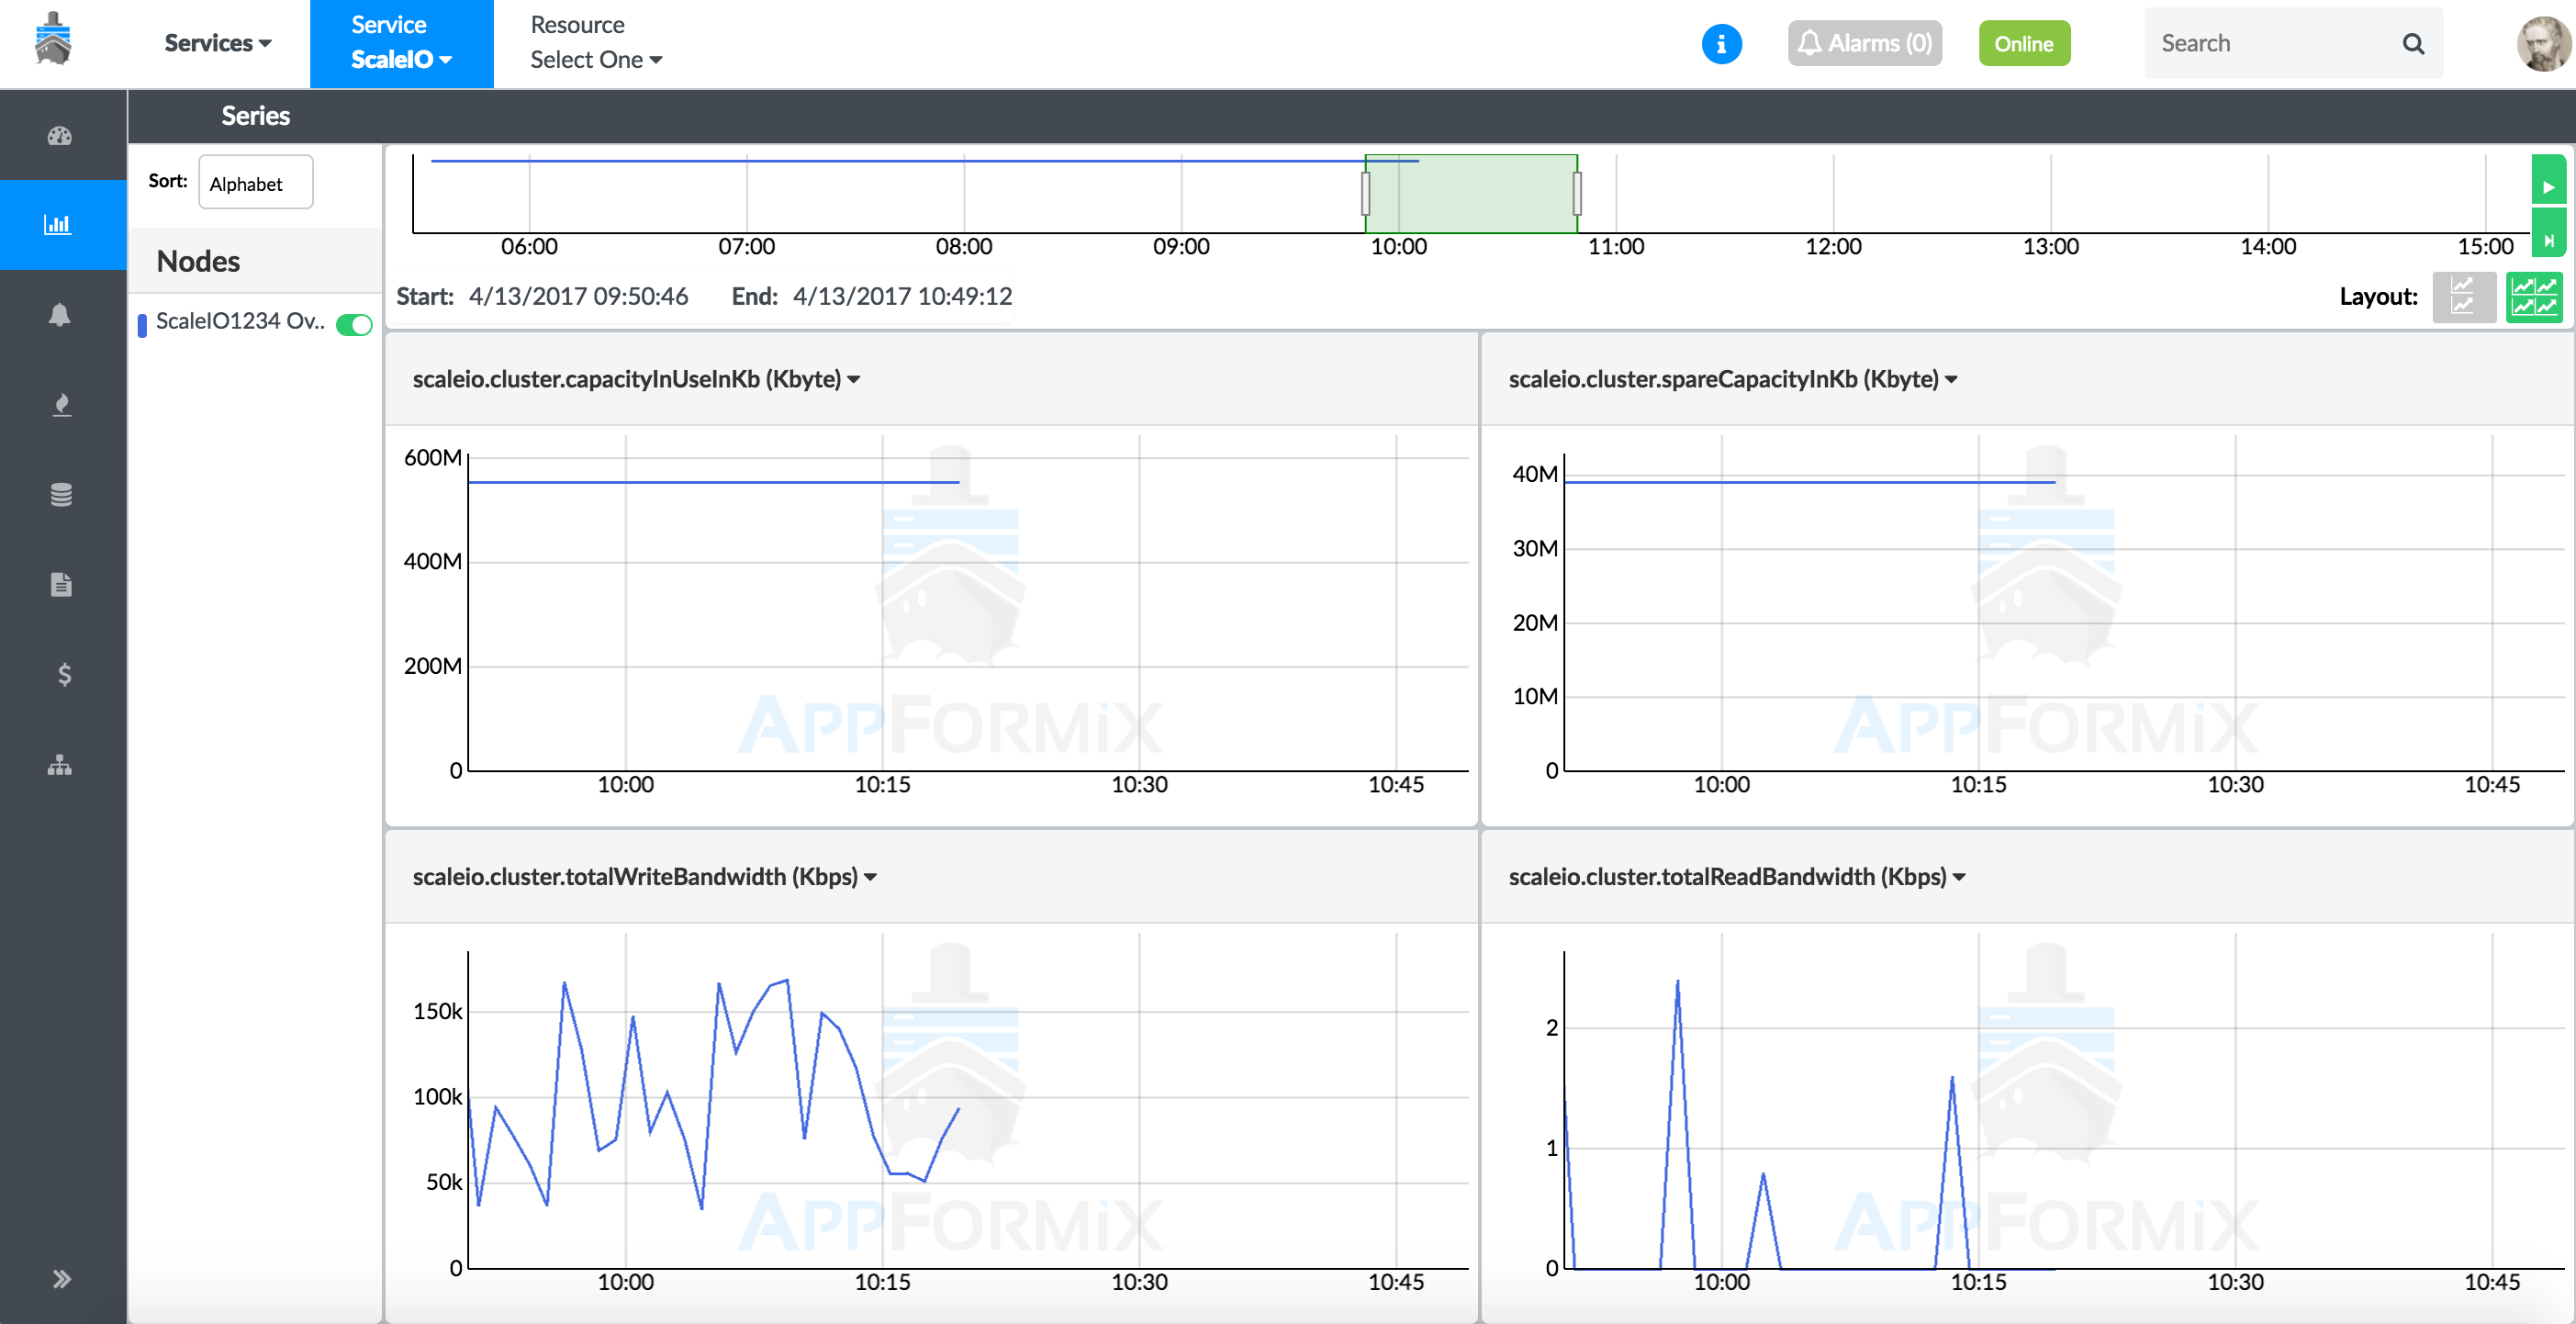
The Contrail Insights service monitoring dashboard for a ScaleIO cluster displays the overall state of the cluster and its components. It also displays real-time storage capacity and read/write bandwidths of the cluster, as shown in Figure 42.
Real-Time Charts
To view cluster-wide metrics in the charts, select Services > ScaleIO from the top context menu. Select the Charts icon from the left pane. Figure 43 shows the ScaleIO service summary of cluster metrics in a chart view.
Real-Time Status of ScaleIO Components
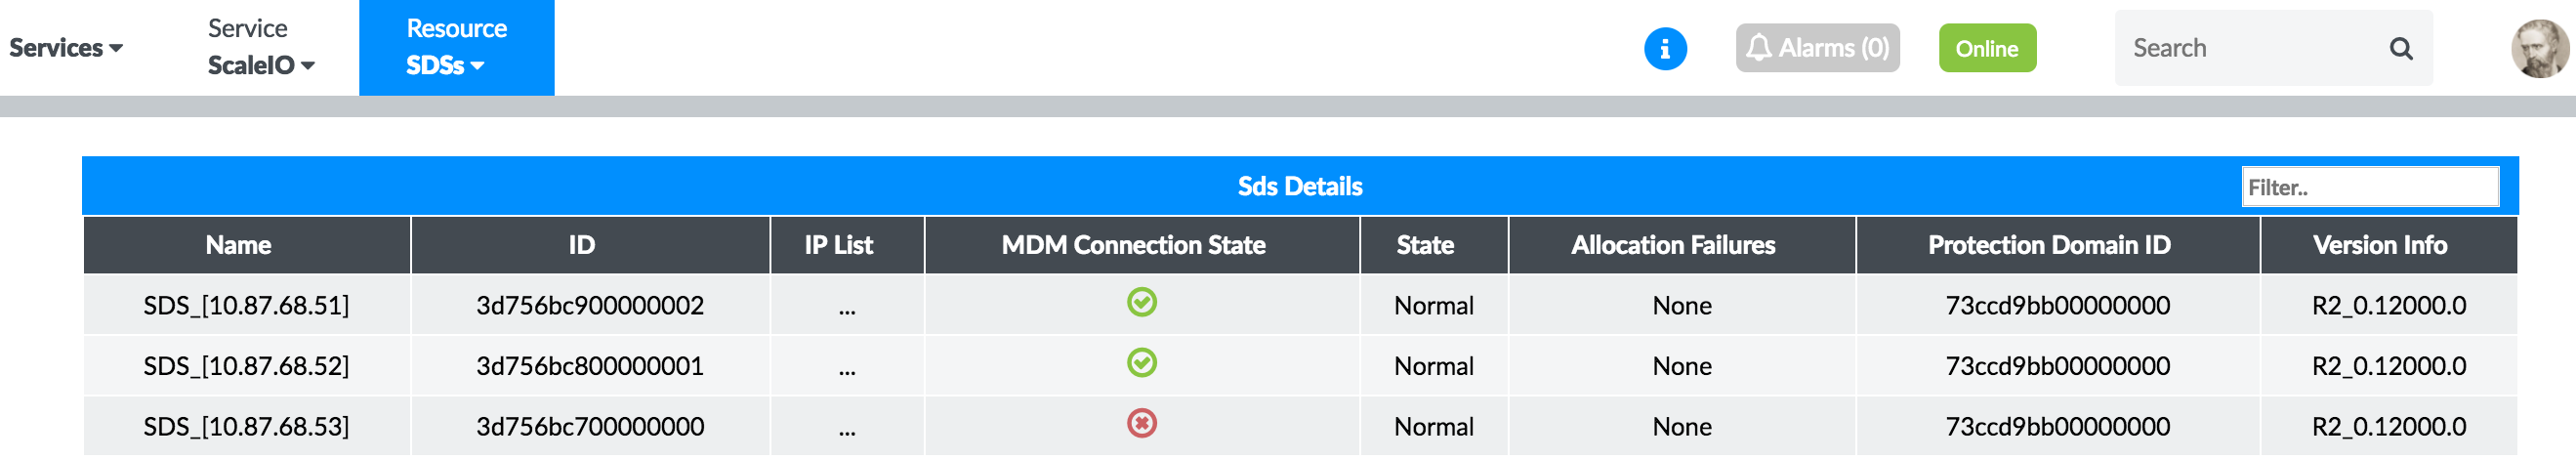
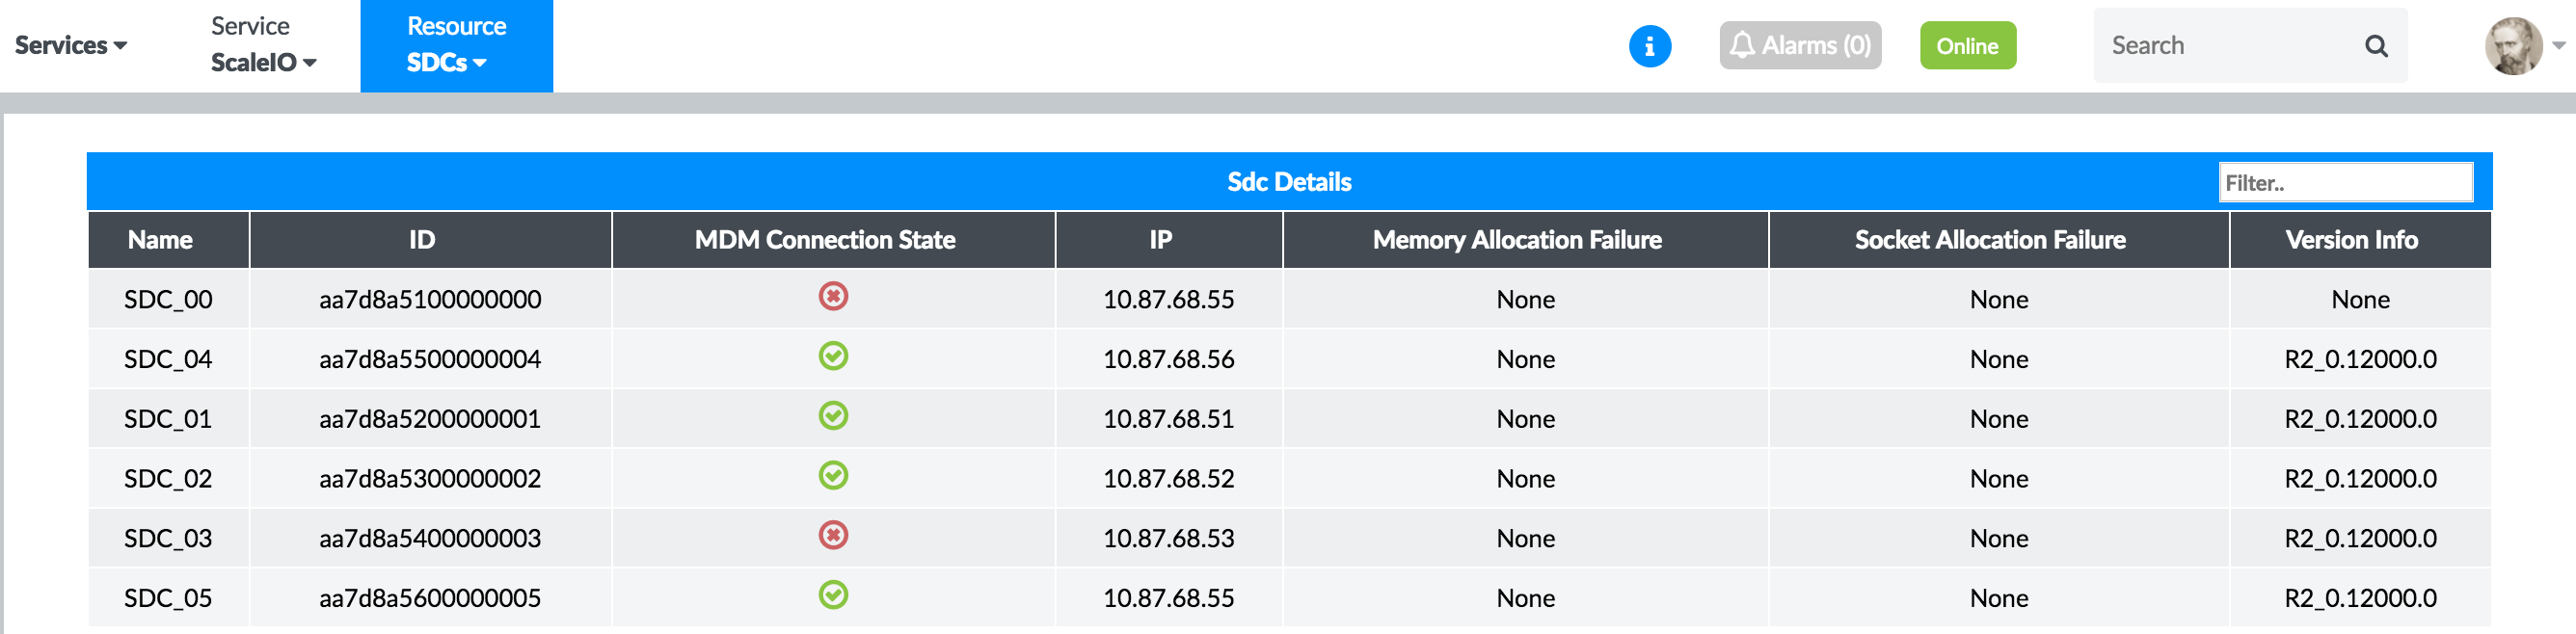
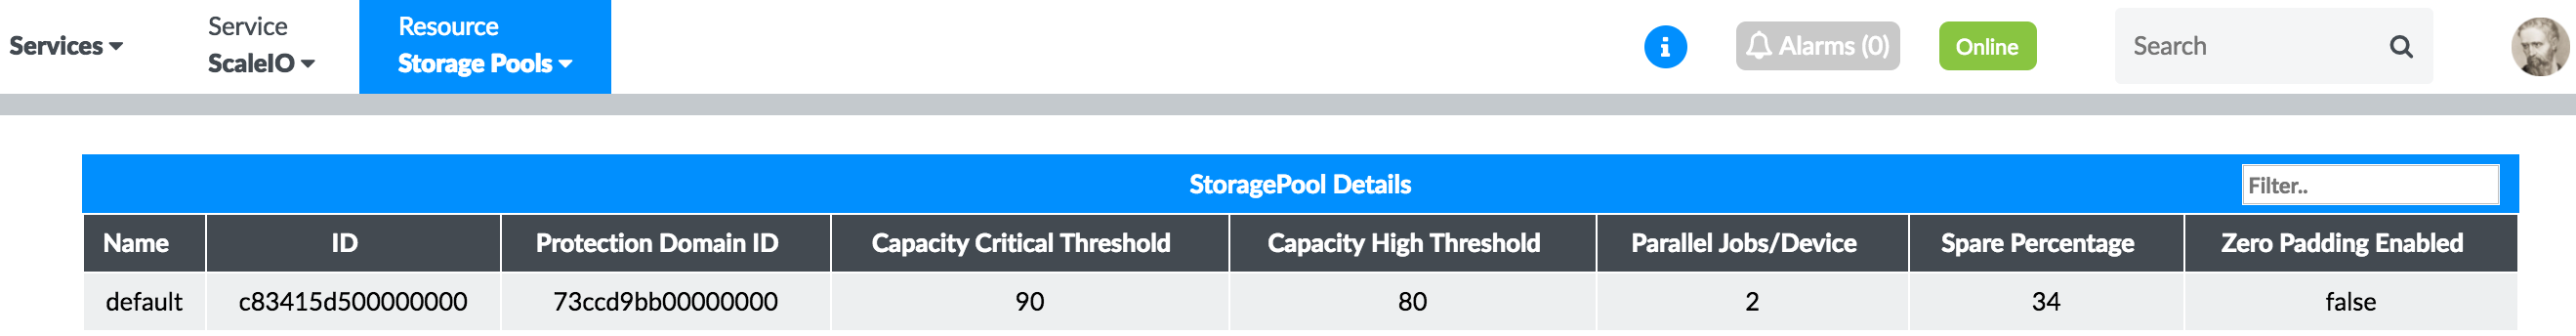
Contrail Insights monitors the real-time status of every element of the ScaleIO cluster. You can select an element from the Resource drop-down list.
SDS
Figure 44 shows the real-time status of SDS elements of the ScaleIO cluster.
SDC
Figure 45 shows the real-time status of SDC elements of the ScaleIO cluster.
Protection Domain
Figure 46 shows the real-time status of the protection domains of the ScaleIO cluster.

Storage Pools
Figure 47 shows the real-time status of the storage pools of the ScaleIO cluster.
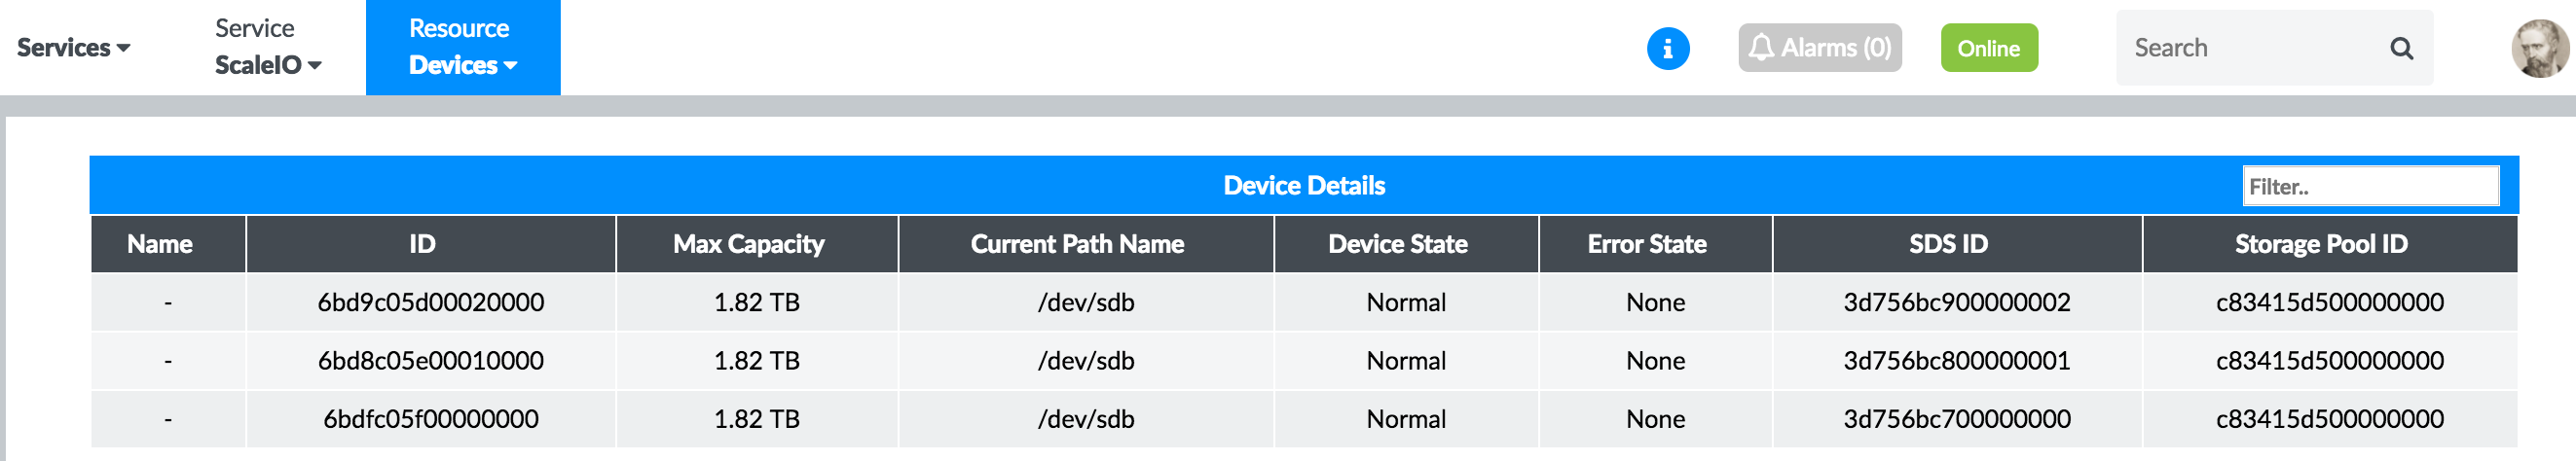
Devices
Figure 48 shows the real-time status of the devices of the ScaleIO cluster.
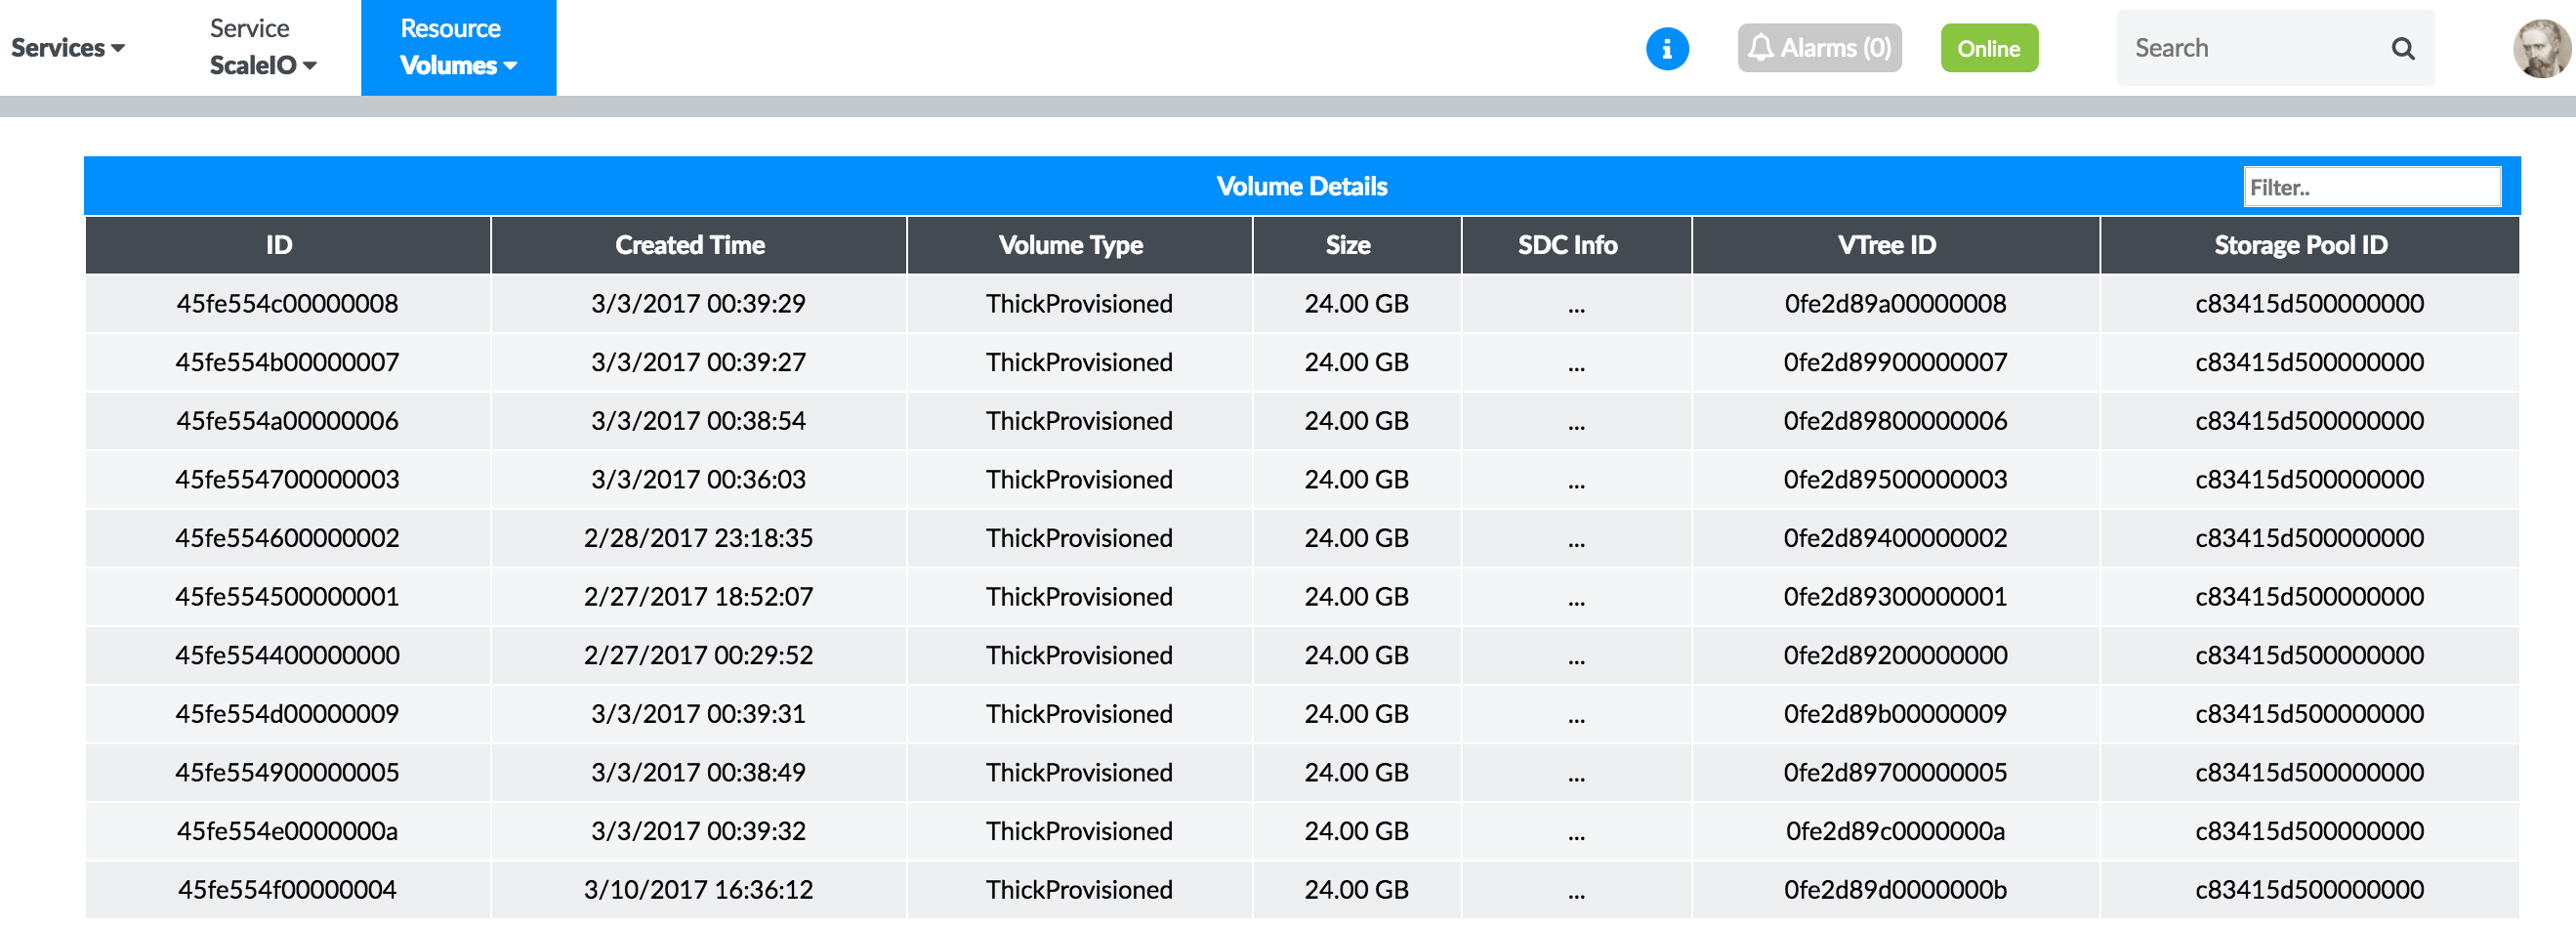
Volumes
Figure 49 shows the real-time status of the volumes of the ScaleIO cluster.
Service Alarms
An alarm can be configured for any of the ScaleIO metrics collected. In the Alarm pane, select the Service Alarms module. Then select scaleio from the Service drop-down list. Additionally, notifications can also be configured for ScaleIO alarms, as shown in Figure 50.

Per-Instance Storage Volume Metrics
When a virtual machine mounts a storage volume, Contrail Insights
Agent monitors the disk latency and throughput to the network attached
storage volume. Instance metrics for storage I/O and latency (such
as disk.* metrics) are available on a per-volume
basis in the charts. An alarm on such a metric will indicate the volume
for which the alarm triggered.
Configuration
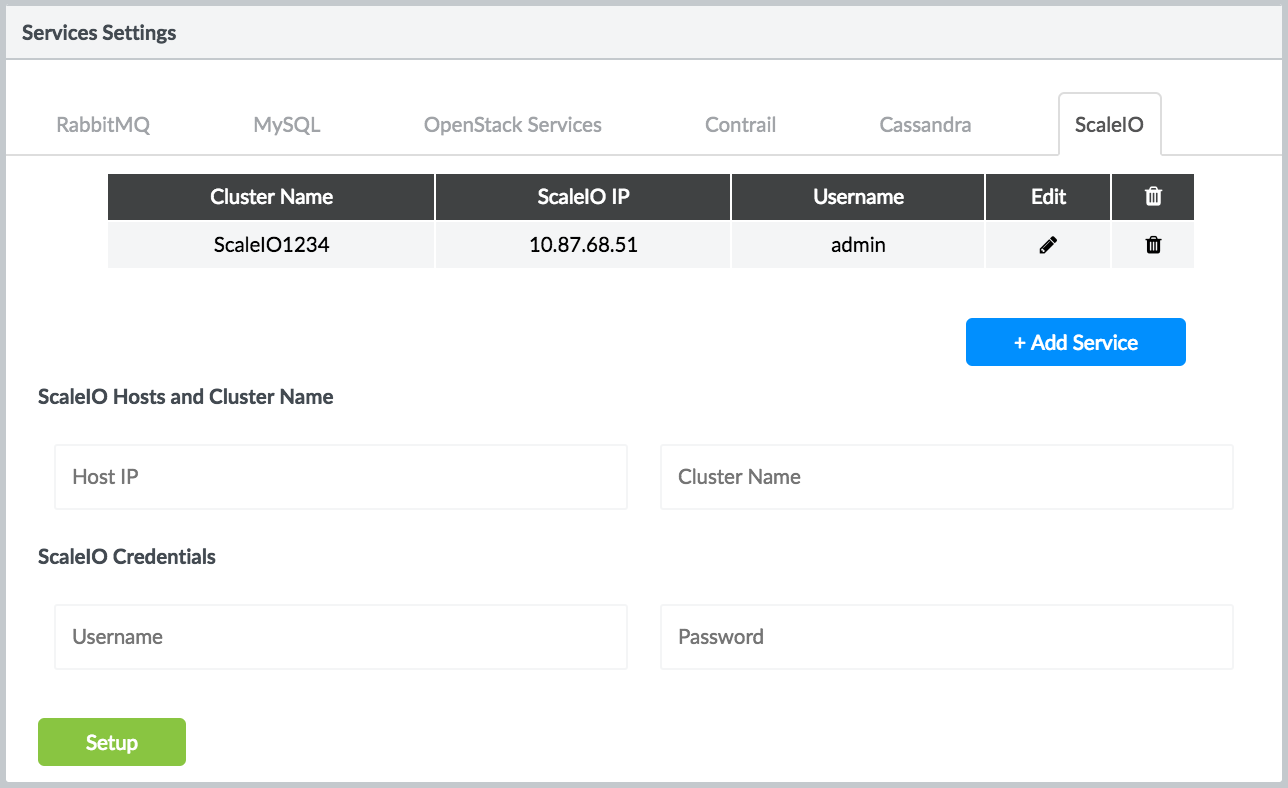
For Contrail Insights to monitor ScaleIO metrics, there must exist a ScaleIO user with admin authorization of the cluster. ScaleIO cluster connection details can be configured in Contrail Insights. From the Settings menu, select Service Settings. Then, select the ScaleIO tab.
Enter the cluster name and host on which ScaleIO runs. Enter the username and password, then click Setup. On success, the button changes to Submitted. Figure 51 shows the ScaleIO services and credentials settings.
Swift Service Monitoring
The OpenStack Object Store project, known as Swift, offers cloud storage software so that you can store and retrieve lots of data with a simple API. It's built for scale and optimized for durability, availability, and concurrency across the entire data set. Swift is ideal for storing unstructured data that can grow without bound.
OpenStack Swift Service Hierarchy
The Object Storage system organizes data in a hierarchy, as follows:
| Account | Represents the top-level of the hierarchy. |
| Container | Defines a namespace for objects. An object with the same name in two different containers represents two different objects. You can create any number of containers within an account. |
| Object | Stores data content, such as documents, images, and so on. You can also store custom metadata with an object. |
Dashboard
Contrail Insights provides an easy way for you to examine the object storage usage of your OpenStack cluster. Contrail Insights automatically discovers all of the Swift Containers in your OpenStack cluster and shows you the details of these discovered Swift Containers. Contrail Insights syncs with OpenStack every minute and updates the Swift Containers information.
Select Dashboard > Services > Swift to view all of the Swift Containers in your OpenStack cluster in the Contrail Insights Dashboard, as shown in Figure 52.
Figure 53 shows an example of a Swift Container displaying in the Contrail Insights Dashboard.

Contrail Insights provides the following information for a Swift Container: Project Name, Container Name, Container Id, Container Size, and Object Count.