Verifying Traffic Collection from the Web UI
Verify that configured Collectors are calling the Central Manager (CM) Web UI and are online and actively collecting traffic. Use the CLI to show interface and packet statistics; see Verifying Configurations and Traffic from the CLI.
Verifying Collector Activity from the Central Manager Web UI
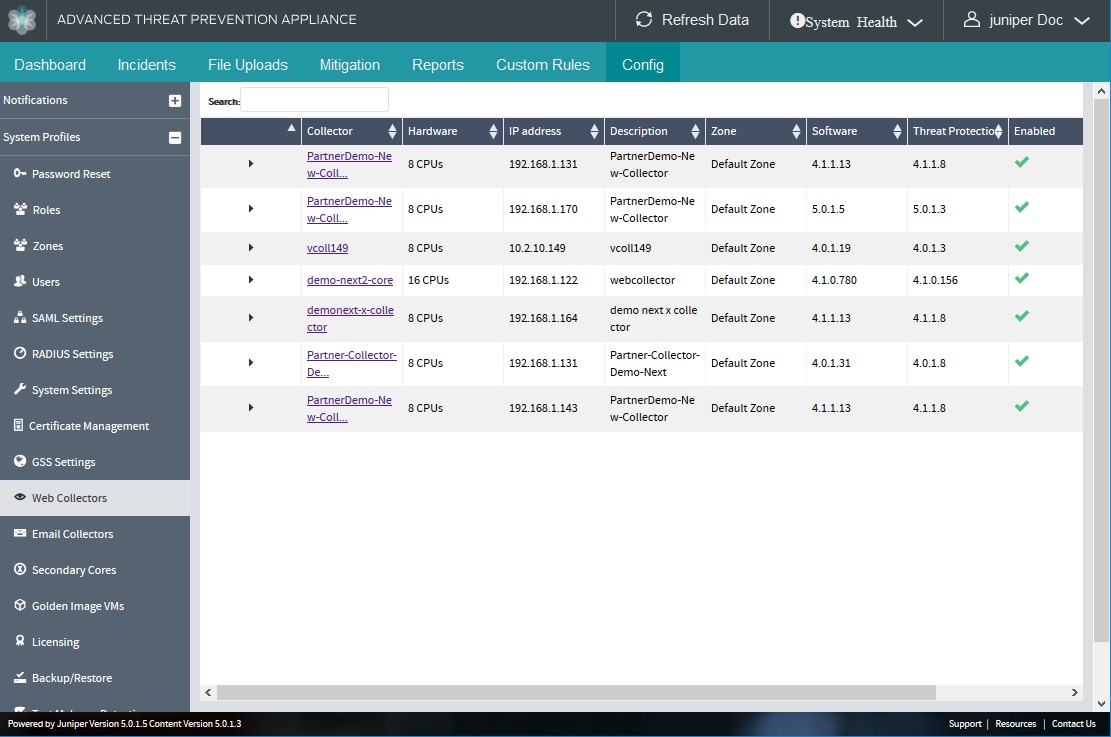
- Select Config>System Settings> Web Collectors or Config>System
Settings> Email Collectors from the Central Manager Web UI to confirm
Collector(s) connectivity.Figure 1: Central Manager Web and Email Traffic Collector(s) Configurations
To verify traffic collection from the CLI, refer to Verifying Configurations and Traffic from the CLI in this guide.
Be sure to refer to the CLI Command Reference for all command details syntax and usage.Be sure to refer to the CLI Command Reference for all command details syntax and usage.
A Web Collector or Secondary Core will be shown as down if it has not reported to the Juniper ATP Appliance Central Manager for longer than 25 minutes (in other words, 5 reporting cycles).
RECOMMENDATION:Juniper recommends you clear the system database after becoming familiar with incidents and kill chain flows. If you are running a trial version, clear the database and remove sample incidents and events before putting the system into full production.
Refer to the Operator’s Guide for information about using the Incidents page and the interactive Dashboard views.