Configuring Distributed Defense
Setting Notifications
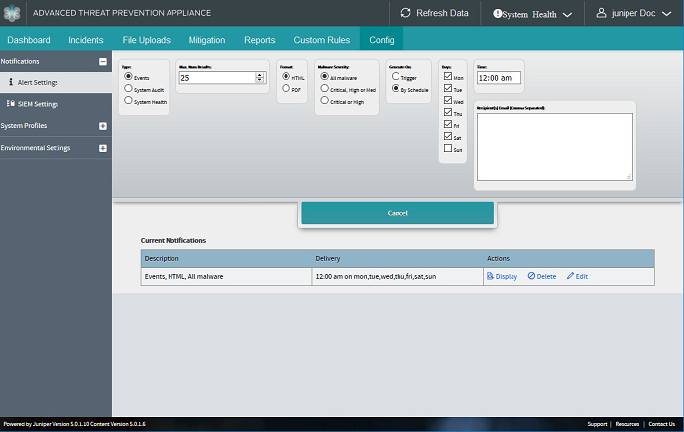
Use the Config > Notifications page to set or edit Alert Settings or SIEM Settings.
Configuring Alert Settings
Configure Alert Settings in order to have Events or System Audit notifications sent to designated e-mail recipients as alerts.
- To create a new alert notification:
- To display, delete or edit an existing alert configuration:
- Alert notification configuration options
- Configuring SIEM Settings
- To create a new SIEM notification:
- Using CEF Alert event_id or incident_id to Display Details in Web UI
- To display, delete or edit an Active SIEM connector configuration:
- Alert notification configuration options
To create a new alert notification:
-
Navigate to the Config > Notifications page and select Alert Settings from the left panel menu.
-
Click Create New Notification to set up a new Events or System Audit or System Health alert.
-
Select from the available options (see descriptions further below) and click Add to complete the configuration and add the new alert configuration to the Current Notifications list.
To display, delete or edit an existing alert configuration:
-
To display, delete or edit an existing alert notification configuration, click Display, Delete or Edit in the Current Notification table for a selected alert.
-
Edit, modify or delete the current settings and fields as desired, then click Save.
-
A sample of an Alert report Display is provided below:
Alert notification configuration options
Descriptions of Events, System Audit and System Health alert settings are provided in the following tables..
|
Type |
Select the type of alert notification to be configured: Event | System Audit | System Health |
|---|---|
|
Max Num Results |
For Event-based alerts, enter the number of rows of results to include in the alert notification [default is 25]. |
|
Format |
Select HTML or PDF as the notification output format. |
|
Malware Severity |
To filter the report notification by malware severity results, choose either: All Malware | Critical, High or Med | Critical or High |
|
Generate On |
Select Trigger or By Schedule to set the method by which an alert is generated. If “By Schedule” is selected, then select a Day, then enter a Time in the format 00:00 am or pm to set the day(s) and time at which the alert is to be generated. |
|
Type |
Note: Selecting the System Health event type will add email alerts for the following four event instances:
on Engine went down |
|---|---|
|
Overall Health Processing Delay |
For System Health alerts, select either overall health metrics alerting or processing-delays-specific alerting. |
|
Format |
Select HTML or PDF as the notification output format. |
|
Generate On |
Select Trigger or By Schedule to set the method by which an alert is generated. If “By Schedule” is selected, then select a Day, then enter a Time in the format 00:00 am or pm to set the day(s) and time at which the alert is to be generated. |
|
Recipient’s Email |
Enter the email address(es) of the alert notification recipient(s). |
|
Type |
Select the type of alert notification to be configured: System Audit |
|---|---|
|
Event Type |
Select the event type(s) to include in the alert notification: Login/Logout | Failed logins | Add/Update Users | Mitigation | Whitelist | | System Settings | Restarts | Remote Support (for ATA analytics) Alerts are resent every two hours if the condition persists. An example of the alert text in generated email alerts: Tue, 05 Aug 2014 21:45:18 -0700 n/a jatp(10.1.1.1) received 0 KB of monitor traffic over last 1 days, 16 hours, 31 Mon, 11 Aug 2014 10:57:26 -0700 n/a Behavior Engine is not running Mon, 11 Aug 2014 10:57:26 -0700 n/a Link eth1 on jatp(10.1.1.1) is down Mon, 11 Aug 2014 10:57:26 -0700 n/a Lost connection to web_collector jatp(10.1.1.1) for 2 days, 5 hours, 11 minutes |
|
Users |
Select All Users or Current User for the notification report. |
|
Date Range |
To filter the report notification by time period, select one: Last Day | Last Week | Last Month | Last Year |
|
Max Num Results |
Enter the number of rows of results to include in the alert notification [default is 25]. |
|
Format |
Select HTML or PDF as the notification output format. |
|
Generate On |
Select Trigger or By Schedule to set the method by which an alert is generated. If “By Schedule” is selected, then select a Day, then enter a Time in the format 00:00 am or pm to set the day(s) and time at which the alert is to be generated. |
|
Recipient’s Email |
Enter the email address(es) of the alert notification recipient(s). |
-
To Test Email Notification Settings, refer to
Configuring SIEM Settings
Configure SIEM Settings in order to have Events or System Audit notifications sent to designated hosts as logs in either CEF, LEEF or Syslog format.
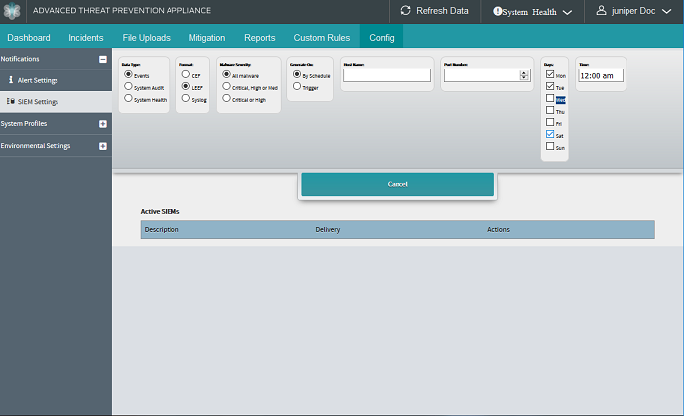
Note that if selecting Syslog as the SIEM setting when configuring System Health alerts, you can choose to include the Hostname or Process name in the Syslog messages that are sent from the Juniper ATP Appliance: Show Hostname and Show Process Name:
To create a new SIEM notification:
-
Navigate to the Config>Notifications page and select SIEM Settings from the left panel menu.
-
Click Add New SIEM Connector to set up a new Events, System Audit or System Health log notification in CEF or Syslog format.
-
Select from the available options (see descriptions further below) and click Add to complete the configuration and add the new SIEM connector configuration to the Active SIEMS list.
Using CEF Alert event_id or incident_id to Display Details in Web UI
Given an incident_id or event_id, you can use the following URLs to display relative details in the Juniper ATP Appliance Web UI.
Replace “JUNIPERATPAPPLIANCE_HOSTNAME_HERE” with your Juniper ATP Appliance host name, and replace “0000000” with the event_id or incident_id.
-
https://JATPAPPLIANCE_HOSTNAME_HERE/admin/index.html?incident_id=0000000
-
https://JATPAPPLIANCE_HOSTNAME_HERE/admin/index.html?event_id=0000000
The system will prompt for login/password if no login session is currently active.
To display, delete or edit an Active SIEM connector configuration:
-
To display a recent report, or delete or edit an existing SIEM configuration, click Display, Delete or Edit, respectively, in the Active SIEM table for a selected configuration row.
-
Edit, modify or delete the current settings and fields as desired, then click Save.
Alert notification configuration options
Alert notifications for SIEM events or system audits are available only if Outgoing Mail Settings are configured from the Config>System Settings menu.
Descriptions of Events alert settings are provided in the following tables.
|
Event Type |
Select the type of SIEM connector notification to be configured: Login/Logout | Failed Logins | Add/Update Users | Mitigation | Whitelist | System Settings | Restarts | Remote Support |
|---|---|
|
Format |
Select CEF, LEEF or Syslog as the notification output format. |
|
Malware Severity |
To filter the log notification by malware severity results, choose either: All Malware | Critical, High or Med | Critical or High |
|
Generate On |
Select Trigger or By Schedule to set the method by which a SIEM Events log is generated. If “By Schedule” is selected, then select a Day, then enter a Time in the format 00:00 am or pm to set the day(s) and time at which the alert is to be generated. |
|
Host Name |
Enter the host name of the CEF, LEEF or Syslog server. |
|
Port Number |
Enter the port number of the CEF, LEEF or Syslog server. |
|
Data Type |
Select the type of SIEM notification to be configured: System Audit |
|---|---|
|
Format |
Select CEF or Syslog as the notification output format. |
|
Event Type |
Select the event type(s) to include in the alert notification: Login/Logout | Failed logins | Add/Update Users | Mitigation | Whitelist | System Settings | Restarts | Remote Support |
|
Format |
Select CEF, LEEF or Syslog as the log output format. |
|
Generate On |
Select Trigger or By Schedule to set the method by which a SIEM System Audit log is generated. If “By Schedule” is selected, then select a Day, then enter a Time in the format 00:00 am or pm to set the day(s) and time at which the alert is to be generated. |
|
Type |
Select the type of SIEM connector log to be configured: System Health |
|---|---|
|
Health |
Select the health report type(s) to include in the SIEM log: Overall Health | Processing Delay |
|
Format |
Select CEF, LEEF or Syslog as the log output format. Note that if selecting Syslog as the SIEM setting when configuring System Health alerts, you can choose to show or hide the Hostname or Process name in the Syslog messages that are sent from the Juniper ATP Appliance: show Hostname and Show Process Name. |
|
Generate On |
Select Trigger or By Schedule to set the method by which a SIEM System Audit log is generated. If “By Schedule” is selected, then select a Day, then enter a Time in the format 00:00 am or pm to set the day(s) and time at which the alert is to be generated. |
Configuring System Profiles
Use the Config>System Profiles page to perform Central Manager Web UI password resets, configure users, modify display settings, and set system functions and variables.
- Resetting the Central Manager Password
- Recovering the Administrator Password
- Configuring Role Based Access Controls
- Default Roles
- Remote Authentication and Roles
Resetting the Central Manager Password
Use the Password Reset configuration window to reset the administrator password used to access the Juniper ATP Appliance Central Manager Web UI.
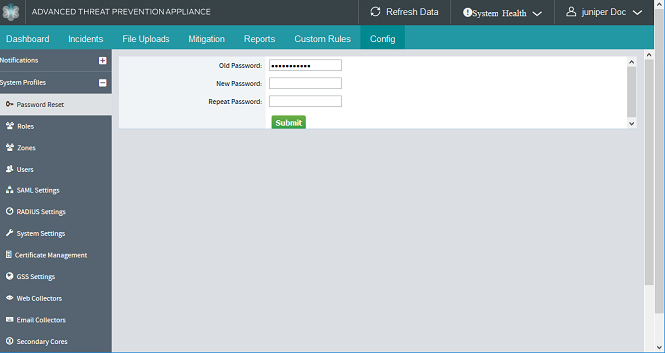
To reset the Central Manager password:
-
Navigate to the Config>System Profiles>Password Reset page.
-
Enter the current password in the Old Password field.
-
Enter a new password in the New Password field, and re-enter that password in the Repeat Password field.
-
Click Submit
Recovering the Administrator Password
To recover the administrator password, you must have physical access to the appliance. The password recovery command cannot be executed remotely. A user named “recovery” can login without a password and enter a limited amount of commands.
To recover the administrator password, do the following:
-
When prompted to login, enter the user name
recoverydirectly on the appliance. -
Enter the
reset-admin-passwordto reset the password.The only other commands available to the recovery user are:
exit,help, andhistory.
Under Reports in the Web UI, in addition to viewing UI users in the audit logs, you can now also see Admin and Recovery-admin CLI users in audit logs.
Configuring Role Based Access Controls
Juniper ATP Appliance provides the option for an enterprise to restrict Juniper ATP Appliance product users to roles and privileges specific to the data they need to perform their jobs. In addition, remote authentication as well as RADIUS / SAML configurations support Juniper ATP Appliance’s role based access control (RBAC) options.
With roles configuration, all new users in a system must be associated with a role, and access to various functions in a Juniper ATP Appliance product are controlled by defined user privileges. Although several default roles are available, more roles can be created as required. Existing users are migrated automatically to the new RBAC system.
Following role configuration, when a user successfully logs in to a Juniper ATP Appliance product, user access to features is controlled according to the mapped privileges assigned to that user (via the role associated with the user during user configuration).
Remote User Authentication (RADIUS / SAML) is also supported for RBAC. Only one type of remote authentication (RADIUS or SAML) is supported at any given time on a Juniper ATP Appliance.
To configure new roles for an established user:
-
Navigate to the Config>System Profiles>Roles page.
Note:Navigate to the Config>System Profiles>Users page to create a new user before defining that user’s access roles.
Figure 4: Roles Page for Configuring User Role-Based Access Controls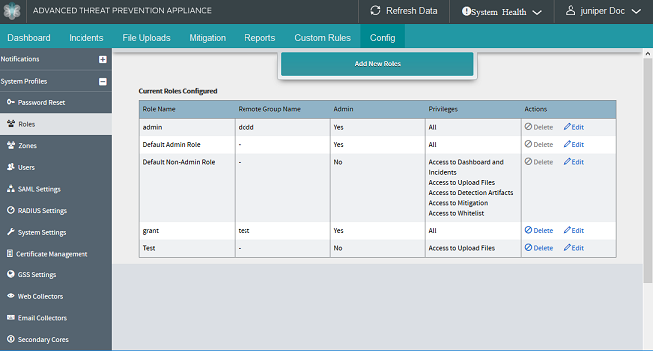
-
Click Add New Roles to define a new role.
-
In the Add New Roles window, enter a “Role” name.
Note:Two default roles are available: Default Admin Role and Default Non-Admin Role
-
Enter a Remote Group Name (optional).
Note:Remote Group Name is specific to the name defined for remote authentication via your SAML or RADIUS configuration.
-
Click “Yes” or “No” to assign Administrator status to the new role.
Note:If Administrator status is “No”, the Privileges options are displayed; an administrator is assigned all privileges by default so this list is not displayed when Administrator status is set to “Yes.”
-
If Administrator status is “No”, click to select the set of Privileges to be assigned to the new role.
-
Click Add to complete the role configuration. The new role is added to the Current Roles Configured table.
Note:Navigate to to add the configured role to a user account.
-
Click the Delete button to remove a role configuration from the Current Roles Configured table.
Note:You cannot delete a role to which users are actively mapped.
-
Click the Edit button to modify the configuration.
Default Roles
The following default roles are available for local and remotely authenticated Juniper ATP Appliance users:
|
Default Non-Admin Role |
Access to all Features and Functionality |
|
Default Non-Admin Role |
Access to Dashboard and Incidents Access to Upload Files Access to Mitigation |
Remote Authentication and Roles
Juniper ATP Appliance’s Remote Authentication features support role-based access controls (RBAC).
-
To enable SAML configuration for remote authentication, refer to . The Remote Group Name must be mapped to a valid Role you’ve configured for the Juniper ATP Appliance system.
-
To configure RADIUS for remote authentication and RBAC, refer to .
Note:Only one type of remote authentication (SAML or RADIUS) can be used at a time on a Juniper ATP Appliance. Remember also that rhe Remote Group Name must be mapped to valid roles you’ve configured for the Juniper ATP Appliance. Remote Group Name is specific to the name defined for remote authentication via your SAML or RADIUS configuration.
-
See also Configuring Active Directory.
Configuring MSSP Multi-Tenancy Zones
Use the Zones configuration page to configure multi-tenancy Web Collector Zones for Managed Security Service Provider (MSSP) support.
You can now also add Juniper SRX Series Firewalls to zones. Find those instructions in the ATP Appliance and SRX Series Device Integration Guide. See Add SRX Series Devices to JATP Zones.
This feature configures Zones for Traffic Collector deployments at tenant sites. All tenant collectors are connected to the Juniper ATP Appliance Core cluster hosted at the MSSP multi-tenancy site. All management of incidents is performed by the MSSP; tenants do not have access to the Core cluster.
A configured Zone identifies incidents and events per tenant. The MSSP defines a Zone per tenant and groups all Collectors associated with a tenant to a tenant-specific Zone. Juniper ATP Appliance’s event correlation stages track all events per originating Zone, and correlate events within the same Zone. In this way, the multi-tenant MSSP manages incidents per Zone/Tenant and controls all zoned Juniper ATP Appliance Central Managers per tenant using the Juniper ATP Appliance Manager of Central Managers (MCM).
To configure MSSP tenant-specific Zones:
-
Configure tenants per MSSP and assign Zones.
-
At the Juniper ATP Appliance Central Manager Web UI Config>System Profiles>Zones page, name and describe the MSSP Zones.
-
At the Juniper ATP Appliance Central Manager Web UI Config>System Profiles>Web Collectors page, assign Collectors to a defined Zone.
-
View Zone data from the Juniper ATP Appliance Central Manager Web UI Incidents page.
-
View Juniper ATP Appliance Web UI Operations Dashboard and Research Dashboard displays of Zone data and analytics.
-
Generate Reports that include Zone analytics from the Juniper ATP Appliance Web UI Reports tab.
To configure a Zone for an established MSSP tenant:
-
Click Zones under the Config>System Profiles menu to open the Zones configuration page.
Figure 5: Zones Configuration Page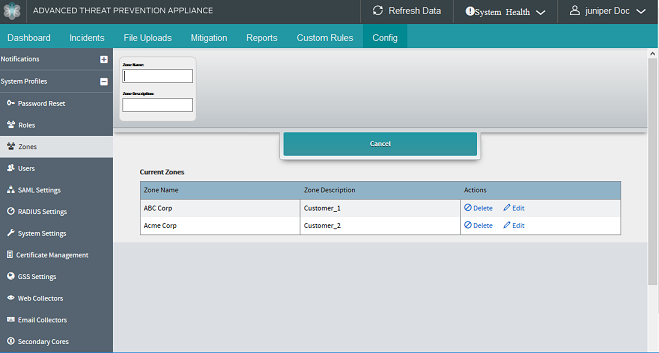
-
Enter a Zone Name and Description, then click Add.
-
Click the Edit button to modify the configuration.
-
Navigate to the Juniper ATP Appliance Central Manager Web UI Config>System Profiles>Web Collectors page to assign Collectors to a defined Zone.
Note:To delete a Zone, click the Delete option in the Current Zones table row for the Zone to be deleted.
- Configuring User Accounts
- Adding a New User Configuration
- Updating a User Account and Setting an API Authorization Key
- Configuring SAML Settings
- Login to the Juniper ATP Appliance using SAML Authentication
- Setting SAML for PingFederate Servers
Configuring User Accounts
To create user accounts for Juniper ATP Appliance access, open the Config>Users page. The role assigned to each account determines whether the user can administer the appliance or simply perform debugging tasks.
You must be logged in with the admin role to view and access the Juniper ATP Appliance settings.
The following default roles are defined:
-
Default Administrator—Allows full access to all monitoring and administrative functions. The predefined Admin account has this role.
-
Debugging—Allows access only to debugging functions. Users with the Debugging role cannot view or access the CLI or the Config options. A user with the Debugging role is included in the system, but is disabled by default.
-
Default Non-Administrator—Allows a set of selectable privileges defined by the Config>System Profiles>Roles settings page for user access to all or some of the following:
-
Access to Juniper ATP Appliance’s Web UI Dashboard and Incidents
-
Access to malware analysis File Uploads
-
Access to Mitigation options
-
Use the Juniper ATP Appliance Users configuration window to add, identify, edit, re-configure and/or view settings and status for Juniper ATP Appliance and software administrators and users.
Click on a User Name in the Juniper ATP Appliance Users table to view, edit or delete existing user information.
Adding a New User Configuration
To add user accounts:
-
Click Users under the Config>System Profiles me nu to open the Users page.
Figure 6: Configuring New User Accounts and Assigning Configured or Default Roles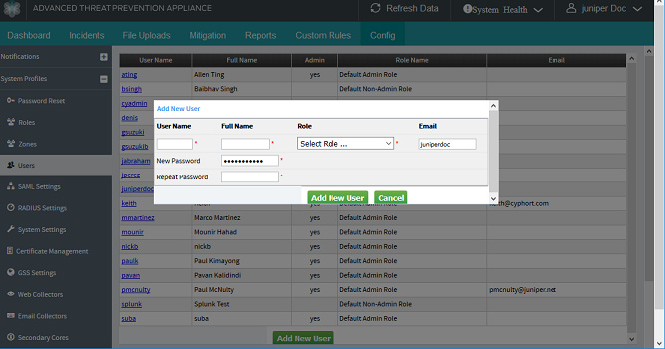
-
Click the Add New User button to configure a new user.
To configure a new Juniper ATP Appliance user, enter settings in the fields [described below] and click Add New User to apply or Cancel to terminate the configuration.
|
User Name |
Brief name of the new user; for example: admin. |
|---|---|
|
Authenticate using [SAML configuration] [RADIUS configuration] |
Check to use SAML or RADIUS authentication for this user, only if such remote authentication is configured and available. When this option is checked, there is no need to enter passwords in this dialog. User authentication will take place via the “Authenticate using <IdP Name>” option on the Login screen. Refer to Configuring SAML Settings or Configuring RADIUS Server Settings for remote authentication configuration information. |
|
Full Name |
A more descriptive name to identify the new user; for example: CentralManagerAdmin_NYC. |
|
Roles |
Select a configured or default Role from the Roles drop down menu. Default roles include either Default Admin or Default Non-Admin. See Default Roles for description of privileges assigned to default roles. Enable Debugging to qualify that role for this user. |
|
New Password |
Enter a Central Manager (CM) Web UI access password for this user. The CM Web UI supports passwords up to 32 characters, and at least 8 characters. Letters (uppercase/lowercase), numbers, and special characters can be used with the exception of doublequotes (”), spaces, or backslash characters (\) in passwords. |
|
Repeat Password |
Repeat entry of the new password for this user |
Click the Delete button to remove a user configuration.
Updating a User Account and Setting an API Authorization Key
User accounts are modified by clicking on an existing account on the Config>System Profiles>Users page list. Each username in the Users pager table is a link to that user account’s details. When you click on a username link, the Update User window displays.
On the Update Users page, you can edit a user’s name, password and role, and also create or re-create an API Key (API Authorization Key) for that user.
Generate a new API key to provide authorized programmatic access to the Juniper ATP Appliance REST API. The configured Authorization Key for that user is then applied each time an API request is made by that user.
Note that this API Key setting removes the requirement for API session logins.
To edit user settings and generate an API Key for a given user, use this two-step procedure.
-
On the Config>System Profiles>Users page, click on an existing user account.
-
If using SAML or RADIUS authentication for this user, click to check Authenticate using [SAML ID] [RADIUS], if configured.
When this option is checked, there is no need to define passwords in this dialog. User authentication will take place via the “Authenticate using <IdP Name>” option on the Login screen. Refer to Configuring SAML Settings or Configuring RADIUS Server Settings for information about configuring remote authentication and RBAC.
-
In the Update User window, make any needed modifications to the user role or password, and click to check the “Generate New API Key” option. A new API Key will be displayed the next time you open this Update User window.
[To disable a user’s API Key, click the Disable API Key option.]
-
Click the Update User button.
-
Open the User Update window one more time to view and copy the new API Key.
-
Access the Juniper ATP Appliance API, and as part of each API call, enter the Authorization Key, as shown in the example below.
Example
curl -k -H 'Authorization: bbc940ccdc795813d1c2d21c60d51a4b'
https://localhost/admin/api.php?op=license_details&api_key=bbc940ccdc795813d1c2d21c60d51a4b
Be sure to review the Juniper ATP Appliance HTTP API Guide for more information.
Configuring SAML Settings
Juniper ATP Appliance supports Security Assertion Markup Language (SAML) authentication for web browser single sign-on (SSO) operations in environments where users are allowed to log in with a username and password.
More information about SAML can be found at https://en.wikipedia.org/wiki/SAML_2.0.
As part of SAML authentication, before delivering an identity assertion to a Service Provider (SP), an SSO Identity Provider (IdP) requests information from a user (principal) – such as a user name and password – in order to authenticate that principal, SAML configuration specifies the assertions between the interacting parties: the message that asserts identity is then passed from the IdP to the SP.
In SAML, one identity provider may provide SAML assertions to many service providers. Similarly, one SP may rely on and trust assertions from many independent SSO identity providers (IdPs). LDAP, RADIUS, or Active Directory allow users to log in with a user name and password; they act as typical sources of authentication tokens for an identity provider.
This section describes SAML configuration. To implement, select Authenticate Using MyIdP from the Juniper ATP Appliance Central Manager Web UI Config>System Profiles>Users page for each user. Refer to Adding a New User Configuration for more information.
To configure SAML settings at the Juniper ATP Appliance Central Manager Web UI, enter setting information for the SP and IdP:
Navigate to the Config>System Profiles>SAML Settings page.
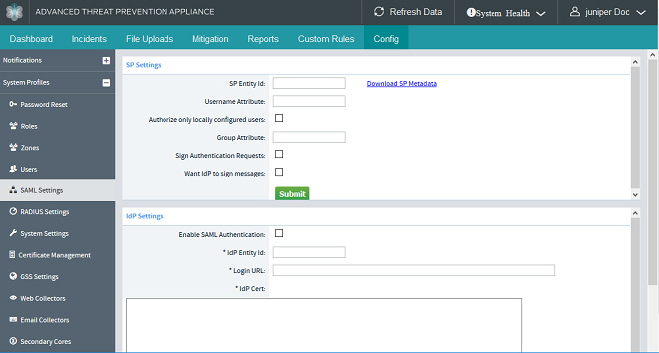
-
For SP settings, enter definitions per field, or click the link to Download SP Metadata.
SP Entity ID
An entity ID is a globally unique name for a SAML entity; the name of the appliance entity id as registered with the IdP. Typically, an SP entity ID is an absolute URL but as a name, not a location (it need not resolve to an actual Web location).
Note:the host part of the URL must be a name rooted in the organization's Primary DNS Domain, and the URL must not contain a port number, a query string, or a fragment identifier.
Example: https://sp_name.JATPappliance.net/sp>
Download Metadata File
Link from which to download the SP’s XML (Juniper ATP Appliance) that will be uploaded to the IdP.
Username Attribute
The attribute in the SAML Assertion that contains the Juniper ATP Appliance username. By default, Juniper ATP Appliance uses the NameID field of the SAML response if this field is left undefined.
Group Attribute
The attribute in the SAML Assertion that contains the group name.
Admin User Group
The group (as specified by the attribute) that receives admin privileges.
Example: jatp_admin
Sign Authentication Requests
Check if you want Juniper ATP Appliance to sign SAML authentication requests.
Want IdP to sign messages
Check if you want the IdP to sign messages.
-
Next, define the IdP settings:
IdP Entity ID
A globally unique name for the IdP (same general naming criteria as SP entity ID)
Example: https://webauthentication.JATP.net/idp
Login URL
The SSO URL (this field is required to allow the SP to initiate SSO).
IdP Cert
The IdP certificate details.
See example in screen shot above.
Note:When SAML-authenticated users log out of the Juniper ATP Appliance using the “log out” link, they are signing out of the Juniper ATP Appliance but not the IdP.
There are three types of Juniper ATP Appliance users and authentication methods:
|
Local Users with local passwords |
Users login with username and password at Juniper ATP Appliance Web UI login screen. User specific data such as report configurations and other settings are stored locally for this user type. |
|
Local Users Authenticated using SAML |
Users are created manually on the Juniper ATP Appliance (Config>System Profiles>Users) but authenticated via SAML. This means the password is not stored on the Juniper ATP Appliance. The SAML assertion controls whether the user is given “admin” privileges; the user privileges can be configured locally or via SAML, with SAML taking higher precedence when both are configured. User specific data such as report configurations and other settings are stored locally for this user type. Such users also can use user-specific features of Juniper ATP Appliance (API Keys, reports, UI customizations). |
|
Non Local Users Authenticated using SAML |
These user accounts only exist on the IdP and not on the Juniper ATP Appliance Consequently, such users do not have access to Juniper ATP Appliance’s user-specific features. No data is stored locally for this user type. Their user role (RBAC) is determined from the information present in the SAML Assertion. |
Login to the Juniper ATP Appliance using SAML Authentication
After the SAML SP and IdP details are configured from the Config>System Profiles>SAML Settings page, users for which SAML authentication is checkmarked (from the Config>System Profiles>Users page) are automatically redirected to the IdP’s login page when they try to access the Juniper ATP Appliance. To perform a local login, ensure the parameter “local_login” is present in the IdP URL; for example: https://10.2.20.100/admin/?local_login
An AuditLog will include username with SAML user-id . In addition, Juniper ATP Appliance logs audit messages when SAML settings are changed by a user.
Setting SAML for PingFederate Servers
Some enterprises configure SML using PingFederate (PF) servers for AD authentication. In addition to Juniper ATP Appliance’s enhanced RBAC for allowing deterministic access to Juniper ATP Appliance devices, administrators can configure precedence-based authorization to control access behavior. A few additional settings, in addition to the SAML configuration provided in the previous section, must be configured for initial deployment.
-
Administrators must add authorization control for non-admin role users in the Juniper ATP Appliance Central manager Config>System Profiles>Users>Add New User window. This control involves using the group name for the SAML assertion (which removes any precedence-specific issues).
When Authorize using is enabled, Juniper ATP Appliance will use the remote group from the Role configured. If the Role is not set for a Radius or SAML response, the authorization will fail.
If Authorize using is disabled (unchecked), the Role selected is applied.
-
Navigate to the Central Manager Config>System Profiles>SAML Settings>SP Settings window to allow authorization only for locally configured users; check “Authorize only locally configured users.”
When “Authorize only locally configured users” is selected, authorization is allowed only if the local user is present.
When “Authorize only locally configured users” is selected and the user is present, the authorization checkbox in the user account window is used for authorizing privileges.
Note:The default value for “Authorize only locally configured users” is unchecked (or disabled) in SP settings. The default value of “Authorize using SAML/Radius” is True (checked).
Options for “Authorize only locally configured users”
-
For Simple Local User (Radius and SAML not configured), “Authorize only locally configured users” is not relevant. Access to the Juniper ATP Appliance device is granted per matching Role Name. If a “remote group” in the Role is configured, it is ignored.
-
For a user that is present in Juniper ATP Appliance configured with Authentication to SAML or Radius ON, the “Authorize only locally configured users” option in SAML SP Settings should be set.
-
For remote authentication and authorization when “Authorize only locally configured users” is unselected, type 3 users are allowed. A temporary user is created based on the successful authentication of the type-3 user if the SAML group assertion matches with the remote group settings in one of the Roles configured.
-
Navigate to the Config>System Profiles>SAML Settings>RADIUS Server Settings window and select “Authorize only locally configured users” for these configured users.
Configuring RADIUS Server Settings
Juniper ATP Appliance Release supports remote authentication to Active Directory (AD) servers using the RADIUS protocol in customer networks. This feature integrates Juniper ATP Appliance products and an Active Directory RADIUS configuration on primary and secondary servers in the customer enterprise. This integration between Juniper ATP Appliance products and the RADIUS feature on existing Active Directory servers in a customer’s network frees enterprises from having to maintain two access databases: one for network access and one for Juniper ATP Appliance access, while helping to simplify network security and usage.
Remote User Authentication via RADIUS or SAML is supported for RBAC. But only one type of remote authentication (RADIUS or SAML) is supported at any given time on a Juniper ATP Appliance. Refer to Configuring Active Directory for information about setting up a new AD domain controller. Note also that Juniper ATP Appliance Email Phishing Correlation requires an Active Directory configuration.
Implementation of RADIUS support requires that the RADIUS server be configured with Active Directory in addition to configuring RADIUS server settings on the Juniper ATP Appliance system. This implementation assumes there is no NAS between the RADIUS client (the Juniper ATP Appliance) and the RADIUS server. Active Directory authentication is achieved using Radius protocol (RFC 2865).
For the RADIUS server configuration:
-
Add the Juniper ATP Appliance IP to the allowed RADIUS client list.
-
Configure the RADIUS secret on the RADIUS server.
-
Configure the Filter-Id or choose a RADIUS attribute in the RADIUS server policy.
-
Enable PAP and MS-CHAP authentication methods on the RADIUS server.
Juniper ATP Appliance’s RADIUS integration is available for Windows Server 2008 and 2012, with support for primary and secondary RADIUS servers using PAP and MS-CHAP authentication methods. A separate link is available for Local login when RADIUS is configured: https://<JATPDeviceIP>/admin/ ?local_login
- About Radius Groups
- Local/Remote User Authentication and RBAC
- Configuring RADIUS Settings on the Juniper ATP Appliance
About Radius Groups
With RADIUS configurations, authentication and authorization are coupled. If the Active Directory username is found and the password is correct, the RADIUS server returns an Access-Accept response, including a list of attribute-value pairs that describe the parameters to be used for the session. Since the Group Name specified by AD is not included as part of the Access-Accept response attributes, Juniper ATP Appliance uses the Filter-Id attribute by default, but the choice of attribute is configurable. This attribute must be configured on the RADIUS server with its string value as Group Name for users configured on the Active Directory. For example, RADIUS could be configured to send the same Filter-Id value string (preferably matching the group name from AD) for multiple users.
Local/Remote User Authentication and RBAC
For local users authenticated through RADIUS, the authenticated user's AD group name will be checked against the user role for applying privileges. Such users can use a set of allowed Juniper ATP Appliance features (as configured on the Juniper ATP Appliance Central Manager Web UI Config>System Profiles>Roles page).
For users not configured on a Juniper ATP Appliance but authenticated through RADIUS, Juniper ATP Appliance accommodates hidden user specifications similar to SAML configurations (Type 3 user). This user will not have access to admin-level features on a Juniper ATP Appliance product. User role is determined decided based on Group Name received via the Filter-Id value.
Each user Role is mapped to a configured Group Name for RBAC, as configured on the RADIUS server (the Group Name is returned as a value of the configured Filter-Id attribute).
For example, if you configure the Filter-Id on the RADIUS server as TestGroup1for a Juniper ATP Appliance Admin Role, and Filter-Id as TestGroup2for a Juniper ATP Appliance Non-Admin Role, then the Remote Group Name for the Admin Role on the Juniper ATP Appliance side is AccessGroup1, and the Group Name for the Non-Admin Role on the Juniper ATP Appliance side is AccessGroup2. Refer also to , and for more information about RBAC.
A sample Windows Server 2012 Network Policy Server integration configuration example is provided below.
Next, configure the Filter-Id and be sure to enable PAP and MS-CHAP authentication methods.
Configure a secondary RADIUS server, as required. A Secondary Server configuration for failover purposes is optional.
Failover to a secondary RADIUS server takes place if there is no response from the primary server, or when a shared secret key does not match the one set on the primary server, or when an invalid RADIUS group attribute is contained in the RADIUS response from the primary RADIUS server.
Configuring RADIUS Settings on the Juniper ATP Appliance
For the Juniper ATP Appliance configuration, set the following:
-
Hostname/IP:port
-
RADIUS secret
-
User group attribute
-
Time-out value
Note:Refer to the Juniper ATP Appliance HTTP API Guide for information about configuring the Juniper ATP Appliance-side RADIUS settings using the “set_radius_config” API.
Use the following procedure to configure RADIUS server settings from the Juniper ATP Appliance Central Manager Web UI.
-
Navigate to the Central Manager Config>System Profiles> RADIUS Settings page:
Figure 7: Juniper ATP Appliance Central Manager RADIUS Server Settings Page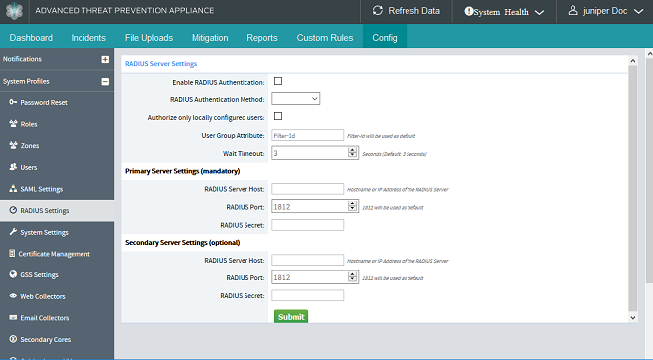
-
To enable RADIUS authentication, click the checkbox Enable RADIUS Authentication. Remove the checkbox to disable a RADIUS configuration.
-
Select the RADIUS Authentication Method configured for the server from the dropdown: PAP or MS-CHAP; the default method is PAP.
-
Enter the User Group Attribute; Filter-Id is the default unless a different attribute was configured on the server side. (See for information about mapping the Filter-Id to the Group Name.)
Note:The User Group Attribute is mapped to the Remote Group Name configured on the Juniper ATP Appliance-side for RBAC using the Juniper ATP Appliance Config>System Profiles>Roles page. The Remote Group Name is case sensitive.
-
Enter the Wait Timeout; the default is 3 seconds. Timeout can be configured for 1-30 seconds.
Note:Three login attempts by AD/RADIUS users are allowed by default; the timeout between attempts is configurable, as indicated in the step above. If the timeout value is configured to a high value of 30 seconds, and if the RADIUS server is not reachable, the user’s browser may display a timeout message while waiting for a response from the Juniper ATP Appliance.
-
Enter the Primary Server Settings:
-
Enter the Hostname or IP Address of the primary RADIUS server in the RADIUS Server Host field.
-
Enter the RADIUS Port; 1812 is the default. This is the UDP port used to send the RADIUS access request.
-
Enter the RADIUS Secret as configured on the server side.
-
-
(Optional) Enter the configured Secondary Server Settings:
-
Enter the Hostname or IP Address of the secondary RADIUS server in the RADIUS Server Host field.
-
Enter the RADIUS Port; 1812 is the default. Again, this is the UDP port used to send the RADIUS access request.
-
Enter the RADIUS Secret as configured on the server side.
-
When RADIUS login is configured, the behavior of local login is unchanged although a separate URL is used to perform the local login:
https://<JATPDeviceIP>/admin/?local_login
-
Configuring System Settings
Use the System Settings configuration window to configure and/or revise settings for Juniper ATP Appliance deployment(s) and software display and email settings.
Navigate to the Config>System Profiles>System Settings page to configure and perform various setup actions [as described below], and then click Submit to save the configuration.
The Config>System Profiles>System Settings page contains settings options for baseline system settings as well as Display Settings, Auto-Mitigation Settings, Outgoing Email Settings and Testing Outgoing Mail Settings -- all on the same configuration page. Scroll the System Settings page to see full option sets.
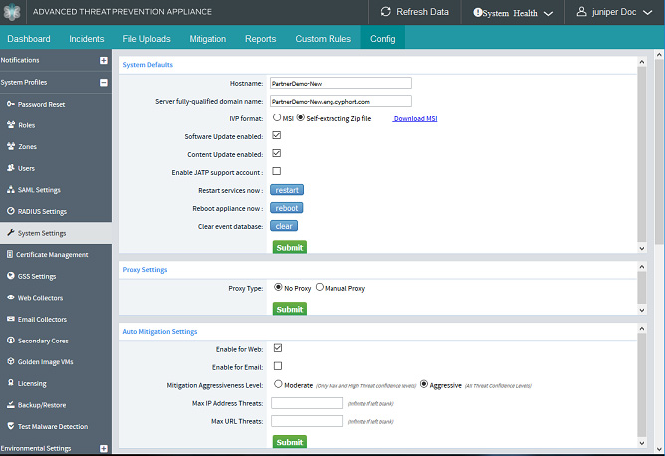
- Configuring System Settings
- Understanding IVP MSI and Self-Extracting ZIP Options
- Self-Extracting Zip File IVP Process
- Configuring Proxy Settings for the Management Network
- Configuring No Proxy Settings for Local Traffic
- Configuring Auto-Mitigation
- Configuring Display Settings
- Configuring Outgoing Mail Settings
- Testing Email Notification Settings
Configuring System Settings
To configure system settings:
-
Navigate to the Config>System Profiles>System Settings page.
-
In the System Settings area at the top of the page, enter the settings in the fields provided (each options is described below), then click Submit to save the configuration settings.
|
Hostname |
Enter a name for the Juniper ATP Appliance or software. |
|---|---|
|
Server Fully Qualified Domain Name |
Enter the fully qualified domain name for the deployed Juniper ATP Appliance. |
|
IVP Format |
Configure the Infection Verification Package (IVP) format for your environment: an MSI installer in .ivp format or a Self Extracting Zip File in .exe format [this is the script customized for the detected malware download (DL) that will test for infection at the enterprise endpoint after the MSI installer is installed at that endpoint. To download the MSI Installer now, click Download MSI. Download MSI downloads the Juniper ATP Appliance-ivpsetup. msi to the endpoint on which you want to run an .ivp file. Executing Juniper ATP Appliance-ivp-setup.msi once on an endpoint will allow the IVP file to run in .ivp format. You can distribute and execute Juniper ATP Appliance-ivpsetup. msi on all systems in your network so that they can natively run the .ivp file. Alternately, you can simply set the format of the IVP to be a self-extracting zip file which all windows machines can run without any modification. Note:
Be sure to review the section below |
|
Software Update Enabled |
Click to enable or disable automatic Juniper ATP Appliance software updates. |
|
Content Update Enabled |
Click to enable or disable automatic security content updates. |
|
Restart Services Now |
Click Restart to restart Juniper ATP Appliance services. |
|
Reboot Appliance Now |
Click Reboot to reboot the Juniper ATP Appliance. |
|
Clear Event Database |
Click Clear to clear the Juniper ATP Appliance or software-only event database. |
Click the Submit button to apply the configuration.
Understanding IVP MSI and Self-Extracting ZIP Options
Juniper ATP Appliance’s Infection Verification Pack (IVP) verifies whether malware that was downloaded to any endpoint in the enterprise has been executed at that given endpoint. For each download that Juniper ATP Appliance detects, an IVP can be created that searches for Indicators of Compromise (IOCs) on the endpoint device. By verifying infection at the endpoints, remediation teams are able to focus their efforts on specific machines identified and verified as compromised machines, saving time and money on desktop mitigation.
Administrators configure IVP settings from the Juniper ATP Appliance Central Manager Web UI Config>System Settings>System Settings page, as described on the previous page in this guide. Setting options include:
-
Self-Extracting Zip File
An IVP Self-Extracting zip file is an executable format that includes two files: the IVP program itself and an input file containing the detected indicators of compromise packaged into a single .exe file.
-
MSI
An IVP MSI is a Windows Installer package file format.
Self-Extracting Zip File IVP Process
When an IVP Self-Extracting Zip .exe file is executed, a command window displays information about whether the malware was installed, and prompts if and where a log file is to be saved locally. Results of the IVP are also sent to the Juniper ATP Appliance Central Manager.
MSI File IVP Process
To use IVP in MSI mode, the administrator must first download and install Juniper ATP Appliance-ivp-setup.msi on the endpoint. The Juniper ATP Appliance-ivp-setup.msi file is downloaded by the administrator from the Juniper ATP Appliance Central Manager using the Download MSI hyperlink next to the IVP format selection buttons in Config>System Setting>System Settings. After installing the Juniper ATP Appliance-ivp-setup.msi, the IVP program is installed under “C:\Program Files\JATP\IVP\JATP-ivp.exe” on the target end system. When IVP mode is set to MSI in the Juniper ATP Appliance Central Manager, a text file with the IOCs are downloaded when an IVP is generated.
The format of the file is *.ivp. When
JATP-ivp-setup.msi is properly
installed, executing the .ivp file launches the juniprtatp-ivp.exe and the
search begins for the IOCs that were detected during malware analysis and
delineated in the downloaded .ivp file now executing on the end system. By
default, a command prompt displays the results, verifying whether or not an
infection has taken place at the endpoint. The user must press any key to exit
the command prompt window. Log files in MSI mode are stored in “C:\Program
Files\JATP\IVP” and the Juniper ATP Appliance Central Manager is notified of the
infection results.
To search for IOCs at the endpoint without requiring any user interaction, be sure to run IVP in MSI mode. Be sure the Juniper ATP Appliance IVP program is installed, download the IVP file, and then execute IVP using the following syntax: “C:\Program Files\JATP\IVP\JATP-ivp.exe -i <ivp-input.ivp>”.
...where <ivp-input.ivp> is the .ivp downloaded from the Juniper ATP Appliance Central Manager. The arguments for IVP are provided below:
C:\temp>JATP-ivp.exe -h
Usage: JATP-ivp.exe [-version] | [[-i <inputfile>] [-o <outputfile>] [-threshold
<float_num>]]
-version prints out the version string
-i <inputfile> default = ivp-input.txt
-o <outputfile> default = ivp-output.txt
-threshold <floatnum> default = 1.0
Configuring Proxy Settings for the Management Network
Many customers still rely on proxies and gateways to provide rudimentary security for their endpoints. In such environments, the CM/Core management network must be able to function and communicate with external services similarly to an unproxied environment. This communication includes uploads and downloads for GSS, as well as software, security content and signature updates, and all other necessary communications. Configure Juniper ATP Appliance Cores deployed in HTTP and/or HTTPS proxy environments to function and communicate with Juniper ATP Appliance GSS and other Internet services.
Use the Proxy Settings area of the System Settings configuration window to define and configure proxy integration and detailed settings for the Juniper ATP Appliance deployment.
This proxy configuration from the Central Manager Web UI is applicable only to Core or All-in-One settings. To configure a proxy for SPAN-traffic monitoring via the Web Collector, you must configure the proxy inside IP address / outside IP address configuration from the Collector CLI in collector mode; for example:
Juniper ATP Appliance Collector (collector)# set proxy inside add <ip address>
Refer to the Juniper ATP Appliance CLI Command Reference for more information.
-
Select a Proxy type: No Proxy or Manual Proxy.
Proxy configuration provides integration with Juniper ATP Appliance’s detection of all links in the kill chain, including exploit, download and infection.
When you select Manual Proxy as your proxy type, the display area fields on the Proxy Settings page will change to accommodate configuration, as shown below:

-
Enter the Proxy FQDN / IP Address in the Proxy FQDN / IP Address field.
Proxy settings for the management network must utilize embedded host name and URL -- the IP address will always reference the proxy server
-
Enter the Proxy Port number in the Proxy Port field.
-
Enter into the No Proxy for field all IP Addresses for which no proxy is required; separate each address with a comma.
-
Check to indicate whether authentication is required for this proxy by clicking Authentication Required checkbox.
-
Enter a Username and Username if authentication is required.
-
Click Submit.
Note:Refer to the Juniper ATP Appliance CLI Command Reference for information about configuring proxies from the Juniper ATP Appliance CLI server mode. See Setting proxy IP addresses.
Configuring No Proxy Settings for Local Traffic
Local servers situated inside the proxy must be added to the No Proxy rules. The No Proxy rules ensure that outgoing connections targeted for specified network addresses included in the No Proxy rules do not go through the proxy.
The configuration will include the proxy settings for the CM/Core appliance or All-in-one appliances only. The proxy settings for the connected Collectors and Secondary Core(s) will be displayed in the Juniper ATP Appliance Central Manager Web UI Config pages for Web Collectors and Secondary Cores.
Administrators should check whether their proxy policy filters out the IP addresses of the Juniper ATP Appliance GSS cloud servers, or whether the IP addresses of the Juniper ATP Appliance GSS servers (which include the update, report, and reputation servers) are part of the category of blocked hostnames under existing proxy policy.
Configuring Auto-Mitigation
Auto-mitigation enables users to configure whether they want Juniper ATP Appliance’s mitigation intelligence pushed automatically to the enterprise’s integrated security infrastructure without user interaction, or manually push a specified mitigation rule to integrated devices.
When auto-mitigation is enabled, the Juniper ATP Appliance administrator is not required to take any action to mitigate a newly discovered threat.

To configure auto-mitigation:
-
Navigate to the Config>System Profiles> System Settings page in the Central Manager Web UI and scroll down to the Auto Mitigation Settings area as shown above.
-
Click to Enable Auto-Mitigation to enable auto-mitigation blocking to configured security devices. See also Configuring Firewall Auto-Mitigation.
Note:When auto-mitigation is enabled, Juniper ATP Appliance’s Advanced Threat Analytics (ATA) is also enabled and ATA results can be viewed on the Mitigation tab as “Juniper ATP Appliance ATA” (as opposed to Local security content) under the Threat Source column of the Mitigation table (meaning the threat was detected locally rather than through the Juniper ATP Appliance GSS).
When not enabled, automatic blocking is disabled and mitigating rule is not sent to integrated firewalls without the Juniper ATP Appliance administrator manually pushing the threat from the Mitigation tab.
-
Select a Mitigation Aggressiveness Level: Moderate or Aggressive.
Aggressive means all threats reported in the Mitigation tab are automatically pushed. Moderate means only Max and High severity threats listed in the Mitigation tab are automatically pushed.
-
At Max IP Address Threats, enter the maximum number of IP Addresses to send to a firewall. If left unspecified, the Juniper ATP Appliance will not limit the number of threats pushed to devices.
This number is threat confidence-based, not risk-based. Confidence state is determined by the rule complex state.
-
At Max IP URL Threats, enter the maximum number of URLs to send to a firewall. If left unspecified, an infinite number is allowed.
-
View threats and auto-blocking results from the Mitigation tab.
Configuring Display Settings
Use the Display Settings area of the System Settings configuration window to configure and/or revise Central Manager Web UI login and display settings.

To configure display settings:
-
Navigate to the Config>System Profiles page, select System Settings from the left panel menu, and scroll down to locate the Display Settings configuration area in the System Settings page.
-
Enter or select optional display settings [options are described below].
-
Click Submit to apply the configuration.
|
Maximum Threats |
Enter the maximum number of threats to display in the Central manager Web UI tables [default is 500]. |
|---|---|
|
Default Display Period |
Select either Last Month | Last 3 Months | Last Year |
|
Session Timeout |
Enter the Web UI session timeout value [default is 15 minutes; minimum Web UI timeout setting is 2 minutes]. |
|
Account Lockout Observation |
If a user fails to log into the Juniper ATP Appliance Web UI with a valid login, the account lockout observation setting default is 10 minutes before a retry is allowed. |
|
Account Lockout Threshold |
The number of times a user can attempt to log into the Juniper ATP Appliance or service [default is 15]. |
|
Account Lockout Duration |
Enter the amount of time an unauthorized user is to be locked out of the Juniper ATP Appliance Web UI. |
Configuring Outgoing Mail Settings
Use the Outgoing Mail Settings configuration window to configure and/or revise outgoing email notification settings for the Juniper ATP Appliance or software deployment.
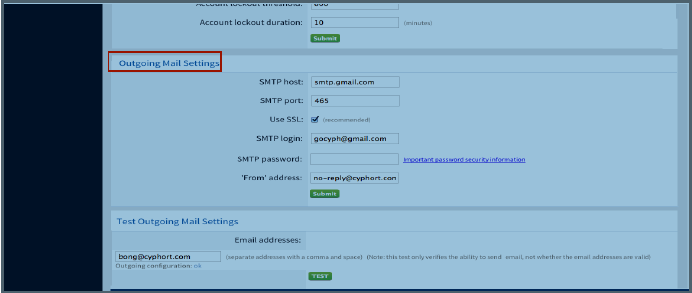
To configure Outgoing Mail Settings:
-
Navigate to the Config>System Profiles page, select System Settings from the left panel menu, and scroll down to locate the Outgoing Mail Settings configuration area on the System Settings page.
-
Enter or select email settings [options are described below].then click Submit to apply the configuration.
Table 11: Outgoing Mail Setting Options SMTP Host
Enter the IP of the enterprise mail host
SMTP Port
Enter the SMTP port number [default is 587].
Use SSL
Enabled by default; uncheck to disable use of SSL.
SMTP Login
Enter an SMTP email login for the appliance or service.
SMTP Password
Enter an SMTP password the login account.
From Address
Enter a ""From"" field email address; the default is mailto:noreply@JATP.net.
Testing Email Notification Settings
At the bottom of the Config>System Profiles>System Settings page, in the Test Outgoing Mail Settings area, you can perform a test of the current outgoing mail configuration.
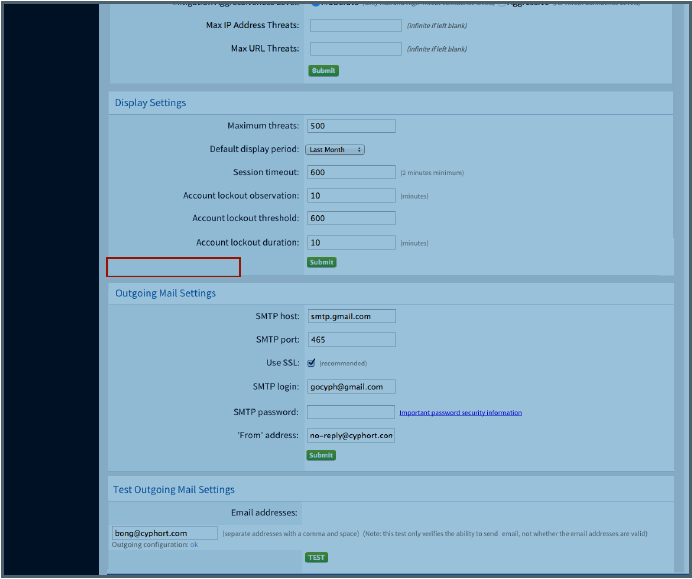
To test outgoing mail settings:
-
Navigate to the Config>System Profiles>System Settings page and scroll down to locate the Test Outgoing Mail Settings area.
-
Enter an email address (or series of email addresses, separated by commas) to which the test email will be sent by the Juniper ATP Appliance .
-
Click the Test button to test your email notification configuration. An email will be sent by the Juniper ATP Appliance to the email address(es) entered, based on the configuration settings.
Note:This test verifies the ability to send email, not whether the email addresses are valid.
Managing Certificates
Use the Config>System Profiles>Certificate Management page to create a self-signed certificate or secure socket layer (SSL) certificate signing request (CSR), or, to import and install a user-provided certificate.
Note that a Common name (fully-qualified domain name (FQDN) of the server is required when creating new certificates.
The Juniper ATP Appliance allows enhances allowlisting functionality by allowing users to allowlist based on a signing certificate. Refer to Configuring Allowlist Rules for more information.
- Creating a Self-Signed Certificate/CSR
- Uploading and Installing a User-Provided Certificate
- Downloading a Certificate or PKCS#12 Bundle
Creating a Self-Signed Certificate/CSR
Users may create certificates using two available options:
-
Create a new self-signed certificate
-
Create a certificate signing request (CRS)
The first option - Create a new private key and self-signed certificate- creates a new private key, and then generates a new self-signed certificate, as is done today whenever the appliance hostname is changed.
The second option - Create a certificate signing request using an existing private key - prompts the user for the certificate details and uses those details with the current private key to generate a CSR, which the user can then download to be signed by a trusted certificate authority (CA).
Alternatively, it is possible to create a certificate signing request using a new private key - this option invalidates any outstanding CSRs because a new private key is created. This allows the user to change the private key if the previous private key was compromised. If the user chooses to proceed, the system then prompts the user for certificate details and uses those details, and the new private key, to generate a CSR, which the user can then download to be signed by a trusted CA.
To create a self-signed certificate:
-
Navigate to the Juniper ATP Appliance Central Manager Web UI Config>System Profiles>Certificate Management page.
Click Create Self Signed Certificate.
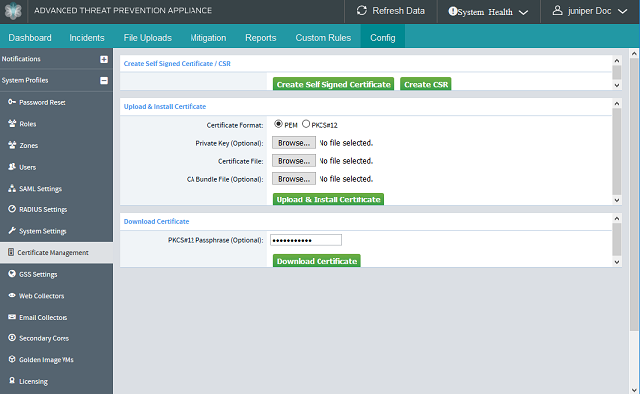
-
In the Create Self Signed Certificate window, enter the details for each field prompt
Note:Some fields are optional but used during certificate signing request creation if provided.
Common Name (Server FQDN)
Fully qualified domain name of the Server.
Organization (Optional)
Organization for which the certificate is to be created.
Organization Unit (Optional)
Organization Unit or department, network, etc.
Email Address (Optional)
Email address of the administrator creating the certificate.
Locality (Optional)
Locality of the enterprise.
State or Province (Optional)
State or province in which the Server using the certificate is located.
Country Code (Optional)
Country in which the Server using the certificate is located.
Key Length
Choose either 2048-bit keys or 4096-bit keys. Typically, 2048 bits are used for extremely valuable keys like root key pairs used by a certifying authority. Note that a longer key length is harder to brute force, but using a longer key length also requires more computational resources on the server and client.
-
After entering the self signed certificate details, click Create and the certificate will be created and applied to the running configuration.
To create a Certificate Signing Request CSR:
-
Navigate to the Juniper ATP Appliance Central Manager Web UI Config>System Profiles>Certificate Management page.
-
Click Create CSR.
-
In the Create CSR window, enter the details for each field prompt:
Note:By clicking the Create New Private Key option will invalidate any previously created CSR.
Common Name (Server FQDN)
Fully qualified domain name of the Server.
Organization (Optional)
Organization for which the certificate is to be created.
Organization Unit (Optional)
Organization Unit or department, network, etc.
Email Address (Optional)
Email address of the administrator creating the certificate.
Locality (Optional)
Locality of the enterprise.
State or Province (Optional)
State or province in which the Server using the certificate is located.
Country Code (Optional)
Country in which the Server using the certificate is located.
Create New Private Key
Click to create a new private key as part of the certificate signing request. Note that by clicking this option, previously created CSRs will be invalidated. Do not select this option if you prefer to use an existing private key.
-
Download the CSR file and send it to the trusted CA. The trusted CA will send the user a certificate file and CA bundle. Navigate to Config> System Profiles > Certificate Management and click Upload and Install Certificate to upload the certificate and CA bundle PEM files.
The appliance validates and installs the certificates provided.
Uploading and Installing a User-Provided Certificate
To install a user-provided certificate from a trusted Certificate Authority (CA), the following is to be provided by the administrator:
-
Private key (optional) - uploaded
-
Client certificate - uploaded
-
CA bundle (optional) - uploaded
This information may be provided in one of two ways:
-
Import the private key, client certificate, and CA bundle as separate PEM files. PEM encoding is a private key format that stores an RSA private key for use with cryptographic systems such as SSL.
-
Import the data as a PKCS#12 bundle with an optional passphrase for decrypting the contents. PKCS#12 is a archive file format for storing multiple cryptography objects as a single file; it is used to bundle a private key with its X.509 certificate or to bundle all members of a chain of trust.
Select the Certificate Format. Let’s start with PEM. Click PEM.
-
Click Choose File to upload a Private Key (this step is optional).
-
Click Choose File to upload a Certificate File.
-
Click Choose File to upload a CA Bundle File (this step is optional).
-
Click Upload and Install Certificate.
Alternatively, you can choose the PKCS#12 format.
The PKCS#12 format allows an admin to create a backup of current certificates, from which a restore backup operation could be performed using the PKCS#12 import. So be careful to only upload the PKCS#12 files created by the Juniper ATP Appliance , not any PKCS#12 file created independently.
-
Click to select PKCS#12 as your preferred Certificate Format.
Enter a PKCS#12 Passphrase (this is an optional step).
Note:The PKCS#12 passphrase should match the passphrase defined when the user created the PKCS#12 file. Otherwise, the file cannot be decrypted.
-
Or click Choose File to upload a PKCS#12 Bundle File.
-
Click Upload and Install Certificate. This action will replace existing SSL certificates.
Downloading a Certificate or PKCS#12 Bundle
Download a PKCS#12 bundle in order to backup a current certificate.
-
Navigate to Config>System Profiles >Certificate Management and scroll down to the Download Certificate area of the page.
-
Enter the certificate PKCS#12 Passphrase (optionally) and click Download Certificate to download and save the PKCS#12 bundle. The download will contain the server's private key. Although the PKCS#12 passphrase is optional when the user downloads the file, it is recommended to set the passphrase so that if the file is lost, the private key is not exposed.
Note:To load certificates from backup, click the Upload & Install Certificate button from the Upload and Install Certificate area of the Config>System Profiles>Certificate Management page. Certificate”, and uploads the PKCS#12 bundle.
Tip:An SSL certificate browser message may display after uploading an SSL certificate and applying an auto refresh of the page. The browser's certificate information states "Connection to the website is not fully secured because it contains unencrypted elements (such has images).....” This is not a Juniper ATP Appliance Web UI issue and the message represents standard cautionary browser behavior.
Configuring GSS Settings
Use the Config>System Profiles>GSS Settings configuration window to configure and/or view Global Security Services settings or to perform a detection data update to GSS for global malware aggregation and reporting.
Be sure to allowlist the Juniper ATP Appliance to avoid being SSL intercepted.
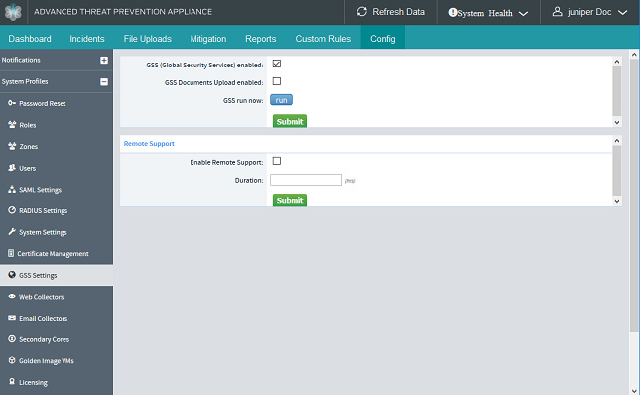
To configure GSS Settings:
-
Navigate to the Config>System Profiles>GSS Settings page.
-
Enter or select GSS settings [options and fields are described below].
-
Click Submit to apply the configuration.
Table 12: GSS Settings Options GSS (Global Security Services) Enabled One-Way Update Option Two-Way Update Option
Click the checkbox to disable [enabled by default].
To enable One-Way GSS communication, ensure that the GSS Enabled checkbox is unchecked. Note that there is an additional license cost to enable one way (from Juniper ATP Appliance GSS to the Core) GSS communication.
To enable Two-Way GSS communication:
-
The Core pulls software and content from GSS and is controlled by Config> System Profile>SystemSettings> Software/Content Update Enabled.
-
The Core also pushes logs, malware, and health data to GSS and is controlled by selecting Config>GSS Settings>GSS enabled.
GSS Documents Upload Enabled
Click the checkbox to enable upload of detection data to the GSS [disabled by default].
Checking this box enables uploads of suspected bad Microsoft Office documents and pdf files to GSS when GSS is enabled.
GSS Run Now
Click the Run button to perform an ad hoc update of detection and detonation data to the GSS.
Enter Duration in hours for the period of time for which remote access to the Juniper ATP Appliance at the customer site is to be enabled, then click Submit to apply.
Note:Maximum duration for enabled Remote Support is 999 hours.
-
A GSS connection is required in order for the Juniper ATP Appliance to run regular licensing checks.
Configuring Web Collectors
Use the Web Collectors configuration window to identify, edit, re-configure and/or view settings and status for connected Juniper ATP Appliance Web Collectors.
Although Web Collectors can be disabled from the Central Manager Web UI, or its settings modified, additional Web Collectors are not “added” via the Central Manager Config>System Profiles>Web Collectors Web UI page. To add a new Web Collector to the distributed defense system, use the instructions in the Juniper ATP Appliance Traffic Collector Quick Start Guide to install the Traffic Collector and then configure it to connect to the Central Manager by setting the CM IP address using Collector CLI commands/ configuration wizard. Be sure to also refer to the Juniper ATP Appliance CLI Command Reference for more information.
You must expand rows in the Web Collectors table by clicking on the row arrow to see detailed information. Additional information in expanded rows includes: Collector Name, IP Address, configured interfaces, the date traffic was last seen from this Collector, and Internal Networks and subnets to which the Collector is associated.
Use the Search field to search for Collector details.
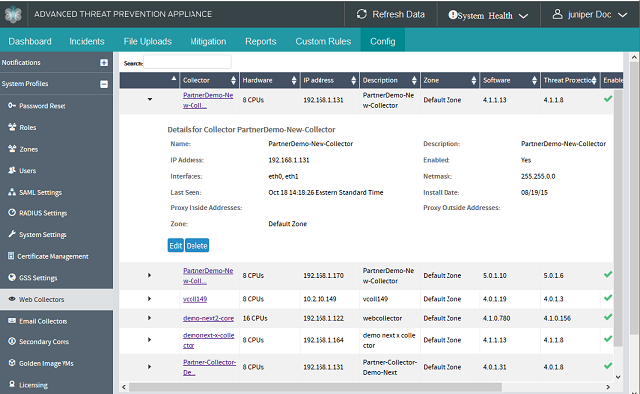
To view, edit disable/enable, or delete Web Collector and Zone configurations:
-
Navigate to the Config>System Profiles>Web Collectors page.
-
Click the arrow icon for the Collector or Zone configuration to be modified in order to expand the row and display Collector details.
Rows must be expanded to edit configuration information.
-
Click the Delete button to remove a Web Collector configuration from the distributed defense system.
-
Click the Edit button to modify the configuration. For example, to modify a Zone configuration, click the Edit button, then modify the Zone setting by selecting another Zone from the Zone dropdown menu, as shown below.
Note:To configure zones per MSSP tenant for selection here, refer to Configuring MSSP Multi-Tenancy Zones.
To configure MSSP tenant-specific Zones:
-
Configure tenants per MSSP and assign Zones.
-
At the Juniper ATP Appliance Central Manager Web UI Config>System Profiles>Zones page, name and describe the MSSP Zones.
-
At the Juniper ATP Appliance Central Manager Web UI Config>System Profiles>Web Collectors page, assign Collectors to a defined Zone.
-
View Zone data from the Juniper ATP Appliance Central Manager Web UI Incidents page.
Note:To view tenant-specific Zone data and correlation analytics, navigate to the Juniper ATP Appliance Web UI Operations Dashboard and Research Dashboard displays. Generate Reports that include Zone analytics from the Juniper ATP Appliance Web UI Reports tab.
-
Modify other settings in the Edit window as well, as needed (descriptions are provided below, then click Save to apply the revised configuration settings.
Note:When deleting a Collector using the Web UI, that same Collector cannot be added back because the configuration is disabled in the Central Manager database.
The editable Web Collector fields are defined as follows:
|
Name |
Juniper ATP Appliance traffic Collector name. |
|---|---|
|
Description |
Description of the configured collector, such as Location; for example: San Francisco building - 2nd floor. |
|
IP Address |
IP Address of the Collector. |
|
Enabled |
Click to checkmark for enabling; remove checkmark to disable the Collector. |
|
Interfaces |
The configured interfaces on the Collector for traffic inspection and management network. |
|
Netmask |
Collector’s IP Address Subnet Netmask. |
|
Last Seen |
Date of last seen activity on the Collector. |
|
Install Date |
Date Collector was installed. |
|
Proxy Inside Addresses |
IP Address of proxy server inside the enterprise network or network segment; configured with the Juniper ATP Appliance CLI collector mode command: JuipnerATPHost (collector)# “set proxy inside add <proxy ip> <proxy_port>” Refer to Span-Traffic Proxy Data Path Support and the Juniper ATP Appliance CLI Command Reference for more information. |
|
Proxy Outside Addresses |
IP Address of proxy server outside the enterprise network or network segment; configured with the Juniper ATP Appliance CLI collector mode command: JATPHost (collector)# set proxy outside add <proxy ip> Refer to Span-Traffic Proxy Data Path Support and the Juniper ATP Appliance CLI Command Reference for more information |
|
Internal Addresses |
IP Address(es) of the internal enterprise subnet(s) to which the Collector is associated. |
|
Zone |
Tenant-specific Zone defined per MSSP. |
Status of Proxy and deployed Collector: online | off line
Note that the Web Collector page displays the status of the Collector and whether it is operational and online. Use this page to check Web Collector status and Proxy status.
Configuring Email Collectors
Use the Config>System Profiles>Email Collectors configuration window to add, edit, re-configure and/or view settings for Email Servers from which Juniper ATP Appliance Email Collectors will collect email traffic.
Phishing Correlation requires an Active Directory configuration; see Configuring Active Directory for more information. Juniper ATP Appliance Email Collector components are part of the Juniper ATP Appliance Core software service; no physical appliance installation or configuration is required.
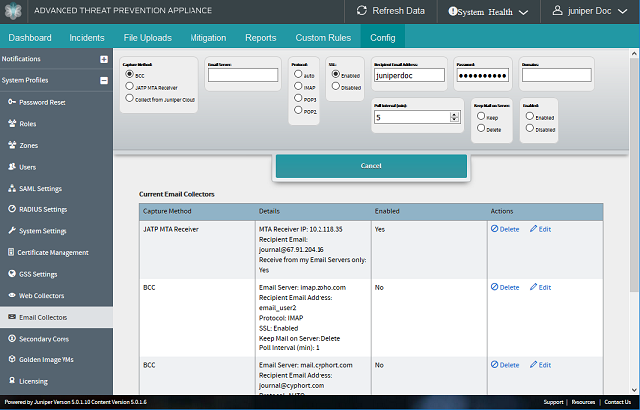
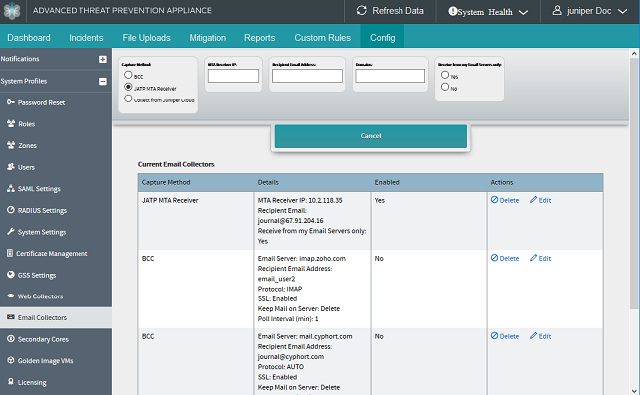
Juniper ATP Appliance-MTA-Cloud Collectors communicate with the Internet directly and appropriate firewall rules should be created.
Adding a New Email Server
To add a new Email Collector Server to the distributed defense system:
-
Navigate to the Config>System Profiles>Email Collectors page.
-
Click the Add New Email Collector button.
Note:Advanced Juniper ATP Appliance-MTA Email Collector features require an enabled Juniper ATP Appliance Advanced license. Refer to Setting the Juniper ATP Appliance License Key for more information.
-
Enter required information and make configuration selections (descriptions are provided below), then click Save to apply new configuration settings.
Table 14: Email Server Settings Capture Method
BCC, Juniper ATP Appliance MTA Receiver or Collect from Juniper ATP Appliance Cloud.
Email Server
Enter the IP Address or hostname of the Email server from which the Juniper ATP Appliance Core Email Collector will receive journaled or BCC email traffic.
Protocol
Select an email protocol:
Auto | IMAP | POP3 | POP2
SSL
Select either Enable or Disable.
MTA Receiver IP
IP address of the Message Transfer Agent (MTA) Receiver Option: “Receive from my Email Servers Only” [Yes | No] If your response is ‘Yes’, provide the email gateways you are using: Gmail | Office365 | Local Email Gateway In each case, enter an additional On-Premise Email Gateway Subnet (Comma Separated); providing the subnet is optional for Gmail or Office 36.’
Note:If you are using both Cloud (i.e Office 365 or Gmail) and on-premise email servers in a hybrid email deployment, then please enter an on-premise email server subnet.
Collector IP
IP address of the Juniper ATP Appliance Collector that is collecting from the Juniper ATP Appliance Cloud. This IP address can be th Core-CM IP address, or a separate standalone MTA Receiver Server IP address.
Recipient Email Address
Enter the Recipient Email Address.
Password
Enter the Email Server mailbox password.
Poll Interval
Enter the polling interval (in minutes); this is the frequency by which the Email Collector polls for email traffic; the default is 5 minutes.
Keep Mail on Server
Select an email retention setting:
Keep | Delete
Enabled
Choose setting to Enable or Disable the Email Server.
Editing or Deleting Email Server Settings
To edit or delete Email Server settings:
-
Navigate to the Config>System Profiles>Email Collectors page.
-
Click the Edit or Delete button in the Current Email Collectors list.
-
To edit, modify settings and configuration selections (descriptions are provided above), then click Save to apply new configuration settings.
Configuring Mac OSX or Windows SecondaryCores
Use the Secondary Core detection engine configuration window to identify, edit, re-configure and/or view settings and status for connected Juniper ATP Appliance Mac OSX or Windows (Core+CM) Secondary Cores.
Although a Secondary Core can be disabled from the Central Manager Web UI, or its settings modified, additional Mac OSX or Windows (Core+CM) Cores are not “added” via the Central Manager Config>System Profiles>Secondary Cores Web UI page.
To cluster or add a new Mac OS X or Windows Secondary Core to the Juniper ATP Appliance distributed defense system, use the instructions in the Juniper ATP Appliance Mac OSX Detection Engine Quick Start Guide or the Juniper ATP Appliance Core/CM Quick Start Guide to install the Mac Mini or Core+CM as a Secondary Core and then configure it to connect to the Central Manager by setting the CM IP address using CLI commands/configuration wizard.
Be sure to also refer to the Juniper ATP Appliance CLI Command Reference for more information.
For information about configuring Secondary Cores for Juniper ATP Appliance vCore installations as Amazon Web Services (AWS) AMIs, refer to the Juniper ATP Appliance Virtual Core for AWS Quick Start Guide.
You must expand rows in the Secondary Cores table by clicking on the row arrow to see detailed information. Additional information in expanded rows includes: Mac OSX or Core+CM (Windows) Core Name, IP Address, configured interfaces, and the date traffic was last seen on this Secondary Core Engine.
Use the Search field to search for Secondary Core details.
|
Name |
Juniper ATP Appliance Secondary Core name |
|---|---|
|
Description |
Description of the configured Secondary Core. |
|
IP Address |
P Address of the Secondary Core. |
|
Enabled |
Click to checkmark for enabling; remove checkmark to disable the Secondary Core. |
|
Interfaces |
The configured interfaces on the Secondary Core. |
|
Netmask |
Secondary Core IP Address Subnet Netmask. |
|
Last Seen |
Date of last seen activity on the Secondary Core. |
|
Install Date |
Date the Secondary Core was installed. |
|
Internal Addresses |
IP Address(es) of the internal enterprise subnet(s) to which the Collector is associated. |
The Clustered Core feature allows multiple Core detection engines to run in tandem to support larger networks. Juniper ATP Appliance supports Windows Core+CM device Secondary Cores (in addition to the Mac-Mini Secondary Cores from previous releases).
The installation procedures for clustering are the same installation procedures set for non-clustered devices.
-
The first install (perhaps an existing device currently deployed) will be automatically registered as the Primary whenever a second install takes place.
-
A second (or additional) Core+CM or Mac-Mini device, when installed, automatically becomes a(nother) Secondary Core.
Note:Do not change any configuration on the existing Primary device already in use. If all devices are new installations, any device can be the Primary device, and any of the additional devices can be the Secondary Cores. Juniper ATP Appliance supports up to 6 clustered Secondary per Primary installation.
After the installation steps are performed (the steps are provided in the Juniper ATP Appliance Core-CM Quick Start Guide), it will take approximately 10 minutes for the Central Manager services to detect the new Secondary Core(s) and instantiate detection engine processes on those Secondary Core(s). The Central Manager Web UI will then display the new Secondary Core(s) in the Config>System Profiles>Secondary Cores table from which additional clustered Secondary Core management options can take place, as described below.
Refer to the Juniper ATP Appliance Core-CM Quick Start Guide for Juniper ATP Appliance Virtual Core for AWS Quick Start Guide for installation information.
- Using the Secondary Core Web UI Config Options
- Status of the deployed Secondary Core: online | off line
Using the Secondary Core Web UI Config Options
To view, edit disable/enable, or delete Secondary Core configurations:
-
Navigate to the Config>System Profiles>SecondaryCores page.
-
Click the arrow icon for the Mac OSX or Windows (Core+CM) Secondary Core to be modified in order to expand the row and display configuration details.
Rows must be expanded to edit configuration information.
-
Click the Delete button to remove a Secondary Core configuration from the distributed defense system.
-
Click the Edit button to modify the configuration.
-
In the edit window, modify the settings (descriptions are provided below, then click Save to apply the revised configuration settings.
The editable Secondary Core fields are defined as follows:
|
Name |
Juniper ATP Appliance Mac OSX oe Core+CM (Windows) Secondary Core Engine name. |
|---|---|
|
Description |
Description of the configured Secondary Core Engine |
|
IP Address & Net Mask |
IP Address of the internal enterprise subnets to which the Secondary Core is associated.Click to checkmark for enabling; remove checkmark to disable the Secondary Core. |
|
Enabled |
Click to checkmark for enabling; remove checkmark to disable the Secondary Core. |
Status of the deployed Secondary Core: online | off line
Note that the Secondary Core page displays the status of the Collector and whether it is operational and online. Use this page to check Mac OS X or Core+CM (Windows) Secondary Core status.
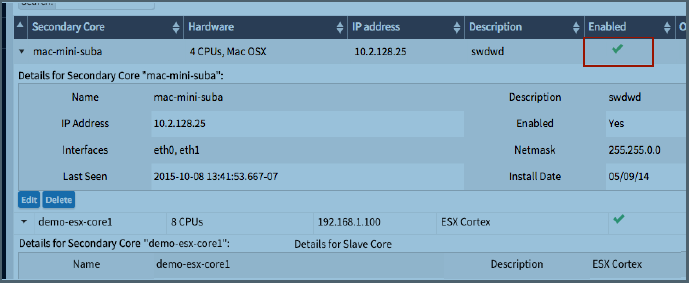
Configuring Golden Image VMs
Configure a custom VM “Golden Image” to refine threat relevance that is explicitly tuned to your enterprise OS environment. This feature, available from the Central Manager Config>System Profiles>Golden Image VMs page, allows users to define and add their own custom Windows 7 OS images against which malware is analyzed in Juniper ATP Appliance detonation chambers.
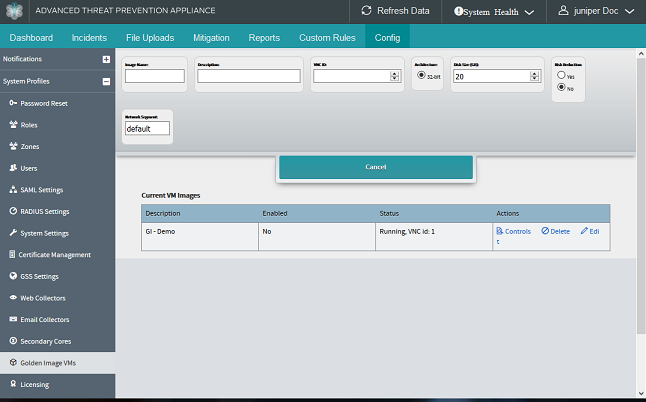
Juniper ATP Appliance uses its own Windows images in detonation chambers by default, but these default OS images do not always match every enterprise OS environment. Support for a custom VM image (Win7 32-bit and 64-bit) provides every customer with the ability to match detonation against their actual deployed enterprise Win 7 OS environment. Juniper ATP Appliance first runs malware against its detection engine OS images during analysis, and then, in sequence, the potential malware is passed to the Custom Golden Image VM for further analysis and detonation.
For Virtual Core, the 64-bit Windows 7 Golden Image is available only when the ESXi server and the guest VM (where the Virtual Core is operating) are configured to enable the virtualized hardware-assisted virtualization (VHV). This allows the guest VM (i.e. the virtual core) to be capable of running KVM, which is required for the 64-bit Golden Image). For more information about configuring the ESXi Server and the Golden Image to enable virtualized HV for the outer guest VM, see Configuring the ESXi Server to Enable Virtualized HV
With regard to Threat Relevance, if Juniper ATP Appliance’s OS images find an object to be malicious, but the custom OS image does not, then relevance is decreased and the risk is reduced for that environment during threat severity calculations.
The customer-defined Golden Image VM can also be used to test confirmed-malicious objects.
CAVEAT Golden Images are limited to .EXE format at this time.
- Golden Image VM Config Process
- Step 1: Mount the Custom OS ISO and Boot the VM
- Step 2: Connect to the VM via VNC & Install Windows OS
- Step 3: Reboot the Golden Image VM
- Step 4: Finalize and Enable the Custom Golden Image VM
- Step 5: Reconnect to VNC to install Adobe Acrobat, if necessary
- Step 6: Installing Preferred AV Software to Golden Image
- Viewing Custom Image Results
- Configuring the ESXi Server to Enable Virtualized HV
Golden Image VM Config Process
To configure, create a Windows 7 custom image and then interact with that “golden image” using VNC during configuration. Once configured, Juniper ATP Appliance automatically instruments and deploys the custom image for malware analysis and detection.
Do not use a cloned Windows 7 image during Golden Image installation; a clone image will not work. Required work flow is to insert the correct ISO, open a VNC connection, then follow the Windows 7 OS Image installation prompts.
The Custom Golden Image VM configuration process steps are as follows:
-
Step 1: Mount the Custom OS ISO location and Boot the VM.
-
Step 2: Connect to the Custom Golden Image VM via VNC and Install Windows OS.
Note:During the Windows 7installation process, Windows performs a required reboot and the VNC connection is dropped. This is expected. Manually restart the VM and reconnect to VNC immediately after losing the VNC during Windows installation.
-
Step 3: Reboot the VM*
-
Step 4: Finalize and Enable the custom Golden Image VM.
-
Step 5: Reconnect to VNC and install Adobe Acrobat, if necessary.
-
Step 6: Install Preferred AV Software to Golden Image
RealVNC cannot connect to the Juniper ATP Appliance Golden Image without first modifying the RealVNC configuration as follows: (1) Navigate to RealVNC “Options”; (2) Disable “Adapt to Network Speed”; (3) Set the Compression Slider to "Best Quality" - "All Available Colors, Minimum Compression".
Step 1: Mount the Custom OS ISO and Boot the VM
-
Navigate to the Config>System Profiles>Golden Image VM page in the Central Manager Web UI.
-
Click the New VM Image button.
-
Enter the settings for the new Windows 7 custom Golden Image VM.
The input fields are described below.
Custom VM Image Configuration Fields
Description
Image Name
Enter the name of the custom VM image you care creating.
Descriptions
Enter a description for the new golden image.
VNC ID
Enter your VNC ID; the ID must be a unique integer.
Architecture
Select 32-bit or 64-bit Disk Size (GB) Enter the size of the disk to
Disk Size (GB)
Enter the size of the disk to be used for the custom image.The default is 20 GB.
Risk Reduction
Select a risk reduction setting: yes or no, where “yes” represents a value of 0.3 and “no” indicates a risk reduction value of 0, respectively. The default is No (0).
Risk Reduction is factored into the threat relevance metric. If the Golden Image determines that a potential malware object is benign, then the risk reduction is applied as a reduced relevance value
Network Segment
Enter the network segment that is running the OS for which this custom VM Image is being created.
Relevance is not calculated if the analyzed malware does not match the network segment configured here.’
-
After entering the custom Golden Image VM settings, click Add to create the image.
-
When the image is displayed in the Current Golden Images VM table, click the Controls link to prepare to install and mount the new custom image.
-
[Optional: To edit the original settings for this new VM Image, click Edit and re-enter the custom image settings information.]
-
Mounting
When mounting the install media for the OS from a file share:
-
Enter the mount path in the ISO NFS/SMB Mount Path field in the Controls window (be sure you are mounting from an open file share):
SMB Syntax: //<IP Address>/<dir>/<file>
NFS Syntax: i<IP Address>:<dir>/<file>
Note:Be sure your permission settings allow access to the open file share.
-
Click to checkmark Mount CD ISO at Boot
-
Click the Boot VM: boot button.
Step 2: Connect to the VM via VNC & Install Windows OS
-
Using your VNC client, connect to the Golden Image VM and perform a typical installation of your enterprise’s Windows OS to be used by Juniper ATP Appliance for malware analysis.
Note:During the Windows installation process, Windows performs a required reboot and the VNC connection is dropped. This is expected. Manually restart the VM and reconnect to VNC immediately after losing the VNC during Windows installation.
Step 3: Reboot the Golden Image VM
-
Return to the Central Manager Web UI Config>System Profiles>Golden Image VM page, select the Controls link for the relevant VM from the Current VM Images table, and then click on Boot VM: boot button again.
Step 4: Finalize and Enable the Custom Golden Image VM
With this next step, Juniper ATP Appliance adapts the configured custom image to the Juniper ATP Appliance analysis and detection architecture, then automatically adjusts the new OS to established firewall settings and installs required drivers, and so on. As part of this process, Juniper ATP Appliance shuts down the VM, so in order to complete the VM image configuration, you must enable the VM in step 12.
-
From the Controls window, and click Finalize Image: finalize. After you click Finalize, you will be asked to login to the Custom Image VM via VNC and carefully follow the prompts as the Juniper ATP Appliance finalize script runs on the Golden VM Image. The final step of the script will be that the Golden Image VM will be shut down.
-
To complete the configuration of the custom VM image, click Enable Image: enable.
Step 5: Reconnect to VNC to install Adobe Acrobat, if necessary
-
Connect once more to the VNC port and install Adobe Acrobat to the custom OS environment, if necessary.
Note:The PDF Reader and Adobe Acrobat exe must be mountable.
Step 6: Installing Preferred AV Software to Golden Image
This step is optional. Install any preferred AV software by connecting once more to the VNC port for the custom OS Golden Image environment (if not already connected).
In order to ensure that your Golden Image is using the latest AV updates: (1) boot up the Golden Image, (2) VNC to it, and (3) manually trigger the Windows and AV updates. Finalize the Golden Image so that all the changes are saved. This process is essential for installing any software to the Golden Image OS.
IMPORTANT: After installing the AV software, be sure to click the Finalize button in the Controls window one more time to allow the AV software to "allowlist" the Juniper ATP Appliance software. At the end the finalize process, a pop-up query requests that you confirm you do want to allowlist the Juniper ATP Appliance software. Do allow whitelisting of the Juniper ATP Appliance software to prevent it form being blocked.
If a Golden Image is modified or edited, it must be re-enabled and re-finalized.
MOUNTING A DIRECTORY INTO A GOLDEN IMAGE VM
For Samba drive users, mount from within the Golden Image VM by right-clicking on "Computer" Window, and selecting "Map Network Drive" or "Add a Network Location". No 3rd party software needs to be installed in this case. Thereafter, enter the IP address of the Samba server and share name to run the share and download software for installation into the Golden Image.
For NFS drive users, first enable the "Client for NFS" option in order to mount a drive. This feature is only available on the Windows 7 Ultimate Edition and Enterprise Edition.
You cannot mount a CD while the Golden Image VM is running. To mount a CD, do this only when booting the VM.
To connect to a remote Samba server from inside a running VM, you must first allowlist the Samba server's IP address using the CLI command:
set firewall whitelist add <samba_server_ip_address>
Viewing Custom Image Results
A new row in the Incidents tab Summary table displays Custom VM Image results as “Golden Image.”
If three Golden Image VMs have been configured, then three golden image results will show in the Operations Dashboard as well as the Incidents page, as shown below.
Configuring the ESXi Server to Enable Virtualized HV
Configuring an ESXi Server in order to enable Virtualized HV is only suggested for VMWare ESXi version 5.1 and later.
Be sure that the ESXi is on hardware version 9 or above.
To configure an ESXi Server to enable Virtualized HV:
-
SSH to the ESXi host.
-
In /etc/vmware, edit the 'config' file and add the following setting
vhv.enable = "TRUE"
-
Use the vSphere Web Client to configure the guest VM by editing the VM settings via VM settings > Options > CPU/MMU Virtualization.
-
Select the Intel EPT option to complete the configuration.
Setting the Juniper ATP Appliance License Key
Without a valid product license key, the Juniper ATP Appliance system will not work. Likewise, an expired product key, or an expired support or content license, prevents full operations and disables content or software updates.
Use the Config>System Profiles>Licensing configuration window to upload a License key to the Juniper ATP Appliance or software service. To license your system, you will need to upload the license using this configuration window and also use the CLI to get the system UUID.
License Keys are obtained from Juniper Customer Support.
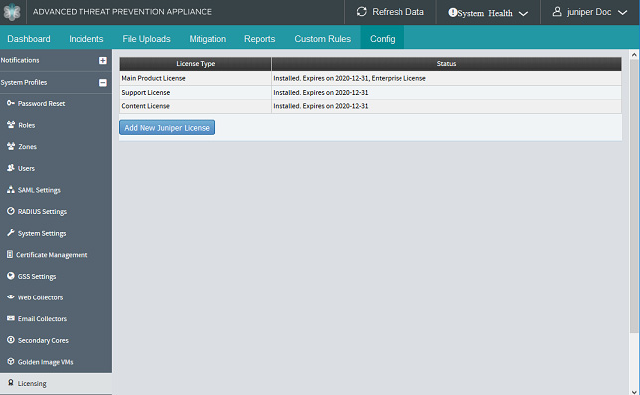
To upload a product license key:
-
Navigate to the Config>System Profiles>Licensing page.
-
Click Add New Juniper ATP Appliance License button to upload a new license key file.
-
Click the Choose File button to select the license key for upload, then click Submit to apply the configuration.
Note:A GSS connection is required in order for Juniper ATP Appliance to run regular licensing checks. Adding a license manually does not enable JATPsupport.
Configuring Backup and Restore Options
Use the Backup/Restore configuration window to perform a backup of the Juniper ATP Appliance configuration, or restore the system configuration settings from a saved configuration file.
Backing up the current configuration
To backup the current system configuration:
-
Navigate to the Config>System Profiles>Backup/Restore page.
-
Click the Backup button to backup the appliance or software service database.
Restoring a saved configuration
To restore a saved configuration file as the current running config:
-
Navigate to the Config>System Profiles>Backup/Restore page.
-
Click the Choose File button to select and upload a previously saved configuration file, then click Restore to apply the configuration settings to the appliance or service.
Note:The backup and restore feature cannot be performed on a CM/Core installation for different major releases. For example, do not restore a previously backup file (generated from a Release 3.2.0 appliance) to a appliance running Release 3.2.0.
Testing Malware Detection Capabilities
Use the Config>System Profiles>Test Malware Detection configuration window to perform a test of the appliance detection and detonation capabilities.
To run the EICAR anti-malware test package:
-
Navigate to the Config>System Profiles>Test Malware Detection page.
-
Click the Download EICAR Test File button to download the signature-based EICAR anti-malware test package.
-
Run the EICAR test to confirm Juniper ATP Appliance Core detection capabilities.
Configuring Environmental Settings
Use the Config>Environmental Settings page to configure integration with existing security infrastructure and other security vendors and services.
The following configurations are supported:
Configuring Email Mitigation Settings
Use the Config>Environmental Settings>Email Mitigation Settings page to configure Gmail or Exchange Server mitigation quarantine options. These settings allow you to quarantine emails that are detected as malicious by using Office 365 APIs or Gmail APIs:
All content on the Juniper ATP Appliance email cloud is encrypted; email quarantine options require encryption of email attachments saved on the disk using a Mitigation Key provided by the user. The Juniper ATP Appliance Central Manager includes a form for user-input of the required mitigation encryption key.
- To configure Gmail Quarantine mitigation settings:
- To configure Exchange Online Quarantine mitigation settings:
To configure Gmail Quarantine mitigation settings:
-
Navigate to Central Manager Web UI Config>Environmental Settings>Email Mitigation Settings page and select the Gmail as the Email Type.
-
Enter the established Quarantine Label name.
-
Enter an Email Address (for testing the configuration).
-
Enter your full Gmail JSON Key.
-
Click Add to complete the configuration.
-
To edit the quarantine settings, click Edit in the Current Email Mitigations Configured table.
-
To delete a quarantine setting, click Delete in the desired row of the Current Email Mitigations Configured table.
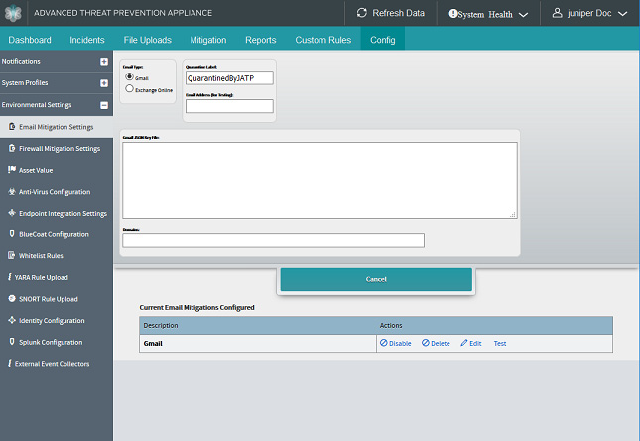
To configure Exchange Online Quarantine mitigation settings:
-
Navigate to Central Manager Web UI Config>Environmental Settings>Email Mitigation Settings page and select Exchange Online as the Email Type.
-
Enter the established Authority Host URL.
-
Enter the Office Resource URI.
-
Enter the Tenant ID.
-
Enter the Client ID.
-
Enter the name of the Quarantine Folder.
-
To Generate New Azure Key Credentials, click the Check box.
-
Enter Key Bits; default is 4096.
-
Enter Certificate Lifetime number of days.
-
Enter Azure Manifest Key Credentials.
-
Click Add to complete the configuration.
-
To edit the quarantine settings, click Edit in the Current Email Mitigations Configured table.
-
To delete a quarantine setting, click Delete in the desired row of the Current Email Mitigations Configured table.
Configuring Firewall Auto-Mitigation
Use the Config>Environmental Settings>Firewall Mitigation Settings page to configure auto-mitigation of Juniper ATP Appliance-detected malware at a Cisco ASA Firewall, Check Point Firewall, Forcepoint SMC, Fortinet Firewall, Palo Alto Network (PAN) Firewall, and/or a Juniper SRX Firewall.
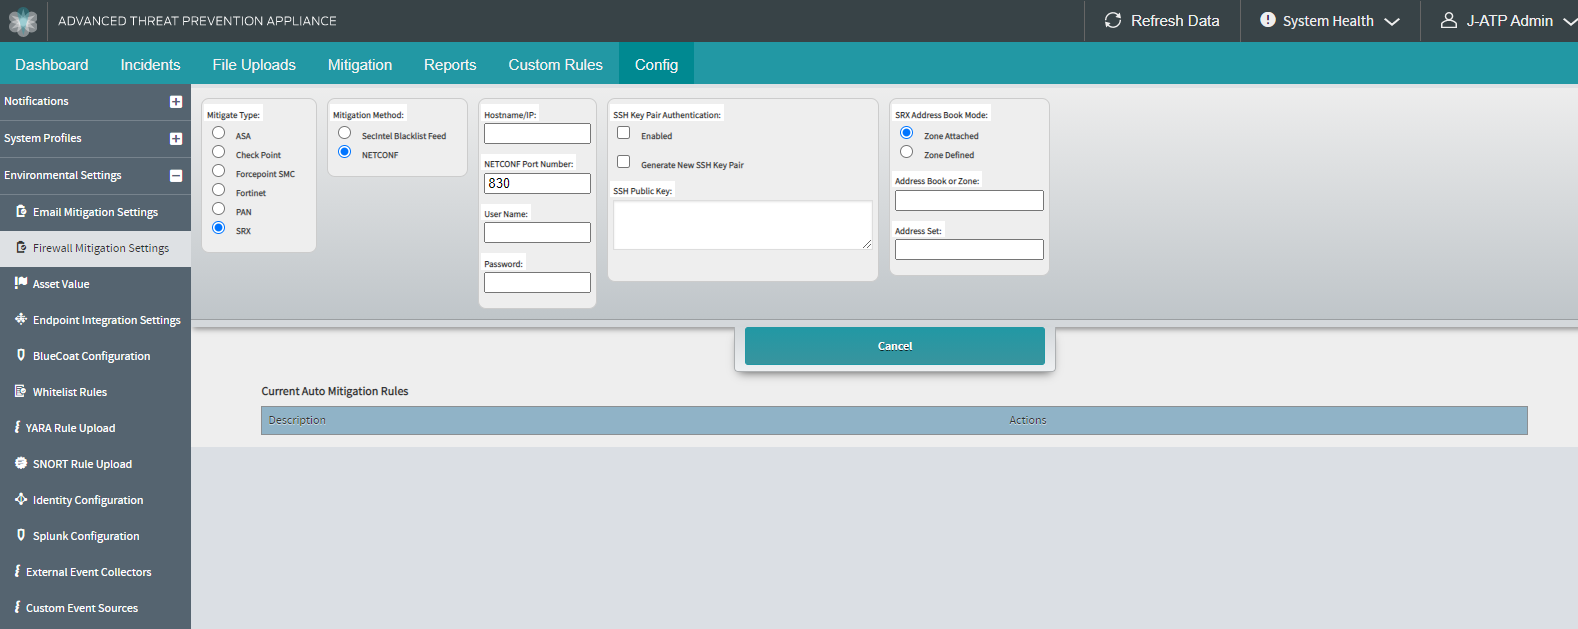
This is the Firewall Auto-Mitigation configuration page. Use the Mitigation tab Firewall blocking options to apply configured Auto-Mitigation Rules.
This section has six distinct configuration options:
-
Configuring a Cisco ASA Firewall - Refer to Configuring a Cisco ASA Firewall
-
Configuring a Check Point Firewall - Refer to Configuring a Check Point Firewall.
-
Configuring Forcepoint SMC- Refer to Configuring Forcepoint SMC.
-
Configuring a centralized PANORAMA PAN Firewall management device - Refer to Configuring a PANORAMA Device for Centralized PAN FW Mitigation Management
-
Configuring a PAN Firewall - Refer to Configuring a PAN Firewall.
-
Configuring an SRX Series Firewall. Refer to Configuring a Juniper SRX Firewall.
The PAN firewall will enforce a firewall policy using the PAN OS Dynamic Address Group (DAG) and associated Tag. The DAG is not tied to a fixed IP Address.
Juniper ATP Appliance does not push rules out to PAN; instead, you add or remove addresses from the PAN DAG. From there, you can also instruct PAN to block addresses in the DAG, or perform other actions. The API that provides access to the DAG is available on PAN OS from which users can configure networks of PAN devices.
The Juniper ATP Appliance/Juniper SRX Firewall integration relies on Junos address sets. The Juniper ATP Appliance platform automatically pushes a malicious IP address to an SRX by adding the malicious IP address to one or more configured Junos address sets on the SRX.
Refer to the respective sections for Cisco ASA, Fortinet and Check Point configuration overviews.
The Juniper ATP Appliance integrates with the Forcepoint SMC (Security Management Center) allowing you to add or remove addresses and URLs to the Forcepoint list for blocking.
- About Auto-Mitigation
- Configuring a PAN Firewall
- Configuring a PAN Firewall Tag
- Configuring a New Auto-Mitigation Rule
- Implementing an Auto-Mitigation Rule
- Verifying Auto-Mitigation Rule Operations
- Configuring a PANORAMA Device for Centralized PAN FW Mitigation Management
- Configuring Centralized Panorama Integration
- Implementing the Auto-Mitigation Rule
- Verifying Auto-Mitigation Rule Operations
- Configuring a Juniper SRX Firewall
- Configuring a Cisco ASA Firewall
- Cisco ASA Firewall Configuration
- Cisco ASA Firewall Configuration Example:
- Juniper ATP Appliance ASA Firewall Configuration
- Configurations at the FortiManager Console
- Configurations at the Juniper ATP Appliance Central Manager
- Configuring a Check Point Firewall
- Configuring and Deploying the Check Point Firewall
- Configuring Juniper ATP Appliance Integration with Check Point
- Configuring Forcepoint SMC
- Configuring a New Mitigation Rule for Forcepoint SMC
About Auto-Mitigation
The Juniper ATP Appliance provides comprehensive automatic mitigation at integrated enterprise blocking devices. In previous releases, mitigation intelligence was manually pushed to integrated partner devices to perform threat blocking (except for those partner devices that polled Juniper ATP Appliance, such as Bluecoat, for example). In this release, users configure whether they want mitigation intelligence pushed automatically to blocking devices without user interaction, or whether they prefer to use the manual push option for each mitigation rule distributed to the blocking infrastructure.
Refer to Configuring Auto-Mitigation for information about setting and enabling auto-mitigation. When enabling Auto-Mitigation, Juniper ATP Appliance ATA is enabled at the same time.
Configuring a PAN Firewall
Configuration of Juniper ATP Appliance-PAN Firewall integration for auto-mitigation is a two-step process:
-
Configure the Dynamic Address Group and Juniper ATP Appliance-Tag using the PAN Firewall Web UI.
-
Complete the configuration at this Config>Environmental Settings>Firewall Mitigation Settings page.
Configuring a PAN Firewall Tag
-
From the PAN OS 6.0 Web UI, navigate to the Objects tab and select the Tags page from the left panel menu. Enter a Juniper ATP Appliance-Tag and click OK; example: JATP-tag
-
From the Objects tab, select Address Group from the left panel menu, then click Add to create a new Dynamic Address Group. In the fields provided, enter criteria shown below and click OK.
-
Name (example: JATP-dag)
-
Description (example: Juniper ATP Appliance Dynamic Address Group)
-
Type (example: Dynamic)
-
Match (example: ‘JATP-tag’)
-
-
Navigate to the Policies tab and select the Security from the left panel menu options, then click Add to add a Security Policy Rule.
-
From the Source sub-tab, under Source Address, add the previously created Dynamic Address Group (checkmark JATP-dag, per our example); click OK, then click Commit in the upper right corner of the window.
Configuring a New Auto-Mitigation Rule
-
Navigate to the Config>Environmental Settings>Firewall Mitigation Settings page.
-
Click Add New Auto-Mitigation Rule.
Note:Definitions for each FW Mitigation Setting field are provided further below.
-
Enter a Hostname/IP, a Host Protocol and a Port Number for the PAN FW device integration.
-
Select PAN from the Mitigation Type category and PAN-OS Firewall from the Device Type options.
-
Enter a Username and Password.
-
Enter the Mitigation URL Category and TAG.
Tip:If a user wants to change the URL and DAG category, the revised rules does not get triggered into automatic rule pushing. To push into a new category, delete the existing configuration and add a new one.
-
Enter the Expire Days and click Add.
Table 17: Auto-Mitigation Settings Defined Mitigate Type
Select PAN-OS to configure an individual PAN FW.
Host IP/URL
IP address or the or FQDN/hostname of the PAN Firewall.
Host Protocol
Select HTTPS or HTTP.
Port Number
Enter the port number of the PAN OS administrative console.
User Name
Enter the admin account username.
Password
The admin account password.
TAG
The Tag that is associated with the configured DAG (“JATP-tag” in our example above).
Mitigation URL Category
Enter URL. This option provides blocking based on URLs to Palo Alto Networks firewalls. URL-based blocking allows more precise blocking control.
Implementing an Auto-Mitigation Rule
Apply the configured Auto-Mitigation Rule from the Juniper ATP Appliance Central Manager Mitigation page.
-
Select a threat row (or multiple rows) in the Mitigation table and click Apply.
-
After clicking Apply, all rules are pushed to the PAN Firewall and will be visible in the PAN Firewall CLI within 10-20 seconds. Multiple rules can be pushed at the same time and all will be reflected in the PAN CLI at the same time.
This is an asynchronous operation so you may continue to push other rules and use other CM Web UI pages as necessary.
Refresh the page after 60 seconds to see a push SUCCESSFUL message for the rows selected.
-
A Remove button is available per row pushed for auto-mitigation in the event you need to remove the automitigation rule.
To enable or disable an auto-mitigation blocking rule:
-
From the Config>Environmental Settings>Firewall Mitigation Settings page.
-
Click Enable or Disable from the Current Auto Mitigation Rules table to enable or (disable) stop forwarding of auto-blocking.

To delete a PAN FW rule(s) and/or configuration:
-
From the Config>Environmental Settings>Firewall Mitigation Settings page.
-
If there are no rules currently being pushed to the Pan FW, click the Delete option.
-
If rules are currently being pushed, then the Delete option is disabled; click Remove all IP Addresses.

In order to delete the PAN FW config, first ‘Remove all IP addresses’ and then select ‘Delete.’
Verifying Auto-Mitigation Rule Operations
-
From the PAN-OS CLI, enter:
show object dynamic-address-group all
Configuring a PANORAMA Device for Centralized PAN FW Mitigation Management
The Juniper ATP Appliance platform monitors and detects malicious IP addresses and the URLs that link to malware. In previous releases, Juniper ATP Appliance’s integration with Palo Alto Networks (PAN) firewalls allowed Juniper ATP Appliance to block malicious URLs and IPs by pushing those IP addresses and URLs to individual PAN FW devices. But some enterprises utilize an array of PAN firewalls deployed in various locations. For this reason, Juniper ATP Appliance offers integration with Palo Alto Network’s Panorama, a network security management device that controls the distributed network of PAN firewalls from a central location. The Juniper ATP Appliance provides the flexibility to either configure integration with individual PAN-OS FWs as usual, or configure integration with a centralized Panorama device as part of Juniper ATP Appliance’s Firewall and Secure Gateway auto mitigation options. See for individual FW integrations.
The Juniper ATP Appliance/Panorama integration pushes IP address(es) to a firewall Address Group, and it pushes URL(s) to a custom URL category for each configured firewall Device Group. Multiple Device Groups can also be configured.
Refer to the Palo Alto Networks Panorama documentation for information about configuring centralized Device Groups, Address Groups and associated policies.
Configuring Centralized Panorama Integration
-
Navigate to the Config>Environmental Settings>Firewall Mitigation Settings page.
-
Click Add New Auto-Mitigation Rule.
Note:Definitions for each FW Mitigation Setting field are provided further below.
-
Select PAN from the Mitigation Type category and Panorama from the Device Type options.
-
Enter a Hostname/IP.
-
Enter a configured Device Group. If there are multiple Device Groups, enter each device group name separated by a space.
-
Enter a Host Protocol and a Port Number for the centralized PANORAMA FW device.
-
Enter a Username and Password.
-
Enter the Mitigation URL Category.
-
Enter an Address Group.
-
Enter the Expire Days and click Add.
Table 18: PANORAMA Auto-Mitigation Settings Defined Mitigate Type
Select Panorama to configure a centralized Panorama management server device.
Host IP/URL
IP address or the or FQDN/hostname of the Panorama device. Device Group Enter the Device Group name(s). Multiple device groups can be
Device Group
Enter the Device Group name(s). Multiple device groups can be specified (separated by a character space). Setup Device Group(s) at the Panorama Console from the Manage Devive Groups page; this is where all firewalls in a Panorama firewall network are grouped.
Host Protocol
Select HTTPS or HTTP.
Port Number
Enter the port number of the PAN OS administrative console.
User Name
Enter the admin account username.
Password
The admin account password.
Mitigation URL Category
Enter the URL. This option provides blocking based on URLs to Palo Alto Networks firewalls. URL-based blocking allows more precise blocking control. Juniper ATP Appliance/Panorama pushes URL(s) to a custom URL category for each configured firewall Device Group. Pushes are via the mitigation secure web gateway from Juniper ATP Appliance to the distributed PAN FWs.
Address Group
The group location to which Juniper ATP Appliance pushes IP addresses for PAN blocking. Enter an existing Address group you’ve created at the Panorama console that is specific to Juniper ATP Appliance. If an Address Group is not specified, PAN will create a new Address Group when the push is executed.
Expire Days
Enter the number of days before the rule expires. Expiry days default to 0, which means the rule will not expire.
Implementing the Auto-Mitigation Rule
Apply the configured Auto-Mitigation Rule from the Juniper ATP Appliance Central Manager Mitigation page.
-
Select a threat row (or multiple rows) in the Mitigation table and click Apply.
Note:The Apply action pushes the Auto-Mitigation Rule to the Panorama device from which policies are executed on distributed PAN-OS firewalls in a given Device Group.
-
After clicking Apply, all rules are pushed to the PAN Firewalls via Panorama and will be visible in the PAN Firewall CLI within 10-20 seconds. Multiple rules can be pushed at the same time and all will be reflected in the PAN CLI at the same time.
This is an asynchronous operation so you may continue to push other rules and use other CM Web UI pages as necessary.
Refresh the page after 60 seconds to see a push SUCCESSFUL message for the rows selected.
-
A Remove button is available per row pushed for auto-mitigation in the event you need to remove the automitigation rule.
To delete a Panorama rule(s) and/or configuration:
-
From the Config>Environmental Settings>Firewall Mitigation Settings page.
-
If there are no rules currently being pushed to the Panorama device, click the Delete option.
-
If rules are currently being pushed, then the Delete option is disabled; click Remove all IP/URL Addresses.

In order to delete the Panorama config, first ‘Remove all IP/URL addresses’ and then select ‘Delete.’
Verifying Auto-Mitigation Rule Operations
-
From the CLI of each individual PAN-OS firewall in the Panorama Device Group, enter the following command to verify operations:
show object dynamic-address-group all
Configuring a Juniper SRX Firewall
- Juniper SRX Firewall Mitigation Overview
- Configuring Security Policy Address Sets at the SRX CLI
- Defining a Zone-Defined SRX Configuration at the Juniper ATP Appliance Web UI
- Configuring SecIntel Blocklist Feed
- Viewing SRX Activity from the Juniper ATP Appliance Mitigation Tab
- Generating an SRX SSH public/private key pair
- Defining a Zone-Attached SRX Configuration at the Juniper ATP Appliance Web UI
Juniper SRX Firewall Mitigation Overview
Juniper ATP Appliance provides mitigation integration with the Juniper SRX Firewall. When the Juniper ATP Appliance platform pushes a malicious IP address to an SRX, that IP address is added to one or more configured Junos address sets on the SRX. This section describes that configuration.
An SRX network administrator configures Junos policies on the SRX that deny access or monitor traffic involving specific address sets; these address sets, either zone-defined or zone-attached, will contain all malicious IP addresses detected by Juniper ATP Appliance.
An SRX administrator configures standard Junos address sets and policies to contain malicious IP addresses reported by Juniper ATP Appliance for mitigation; anything from the mitigated address is to be blocked (moved from trusted to untrusted per policy). The administrator must configure policies that will appropriately handle traffic on the configured mitigation address sets. The next section describes how to configure the Juniper ATP Appliance platform to identify the SRX mitigation address set(s).
JUNOS SRX ADDRESS BOOKS & ADDRESS SETS
In Junos, address sets are nested inside an address book. Detailed descriptions of address sets and books can be found in the Junos documentation. In general, an address book is the set of all possible addresses and host names that might appear within a security zone. An address set is a user-configurable subset of an address book. An address book can contain multiple address sets, and an address set can contain multiple addresses.
An address set can be configured as either Zone-Attached (Global) or Zone-Defined.
-
Zone-Defined address sets (also sometimes referred to as Zone-Specific) are configured on SRX systems running version 11.2 or earlier for a specific zone. A Zone-Defined address set uses 1 default address book per zone; in zone-defined configuration mode, each security zone has a single unnamed address book. Address sets are defined within this zone-specific address book. The SRX uses the name “address book” as the default name for Zone-Defined address sets. A trusted zone is user-configured, and an untrusted zone is typically represented by the internet and unknown servers.
Global or Zone-Attached or Zone-Defined address sets can be configured for SRX systems running version 11.2 or later; in addition to the newer zone-attached configuration mode, Junos versions 11.2 and later also support the legacy zone-defined configuration mode. For Zone-Attached address set configurations, the admin must specify both the address book or zone as well as the address set. The syntax for global zoneattached address sets differs from zone-defined. See TIP examples below.
Tip:When choosing an SRX address book mode as Zone Attached, specify the address book name in the “Address Book or Zone” input field in the CM Web UI, and the Address Set in the “Address Set” input field. The address-set containing a dummy IP address must be created under the address-book at the SRX CLI. For example:
-
Address-book book1 with address-set asset
Address Book or Zone : book1
Address-set : asset
-
Address-book global with address-set asset
Address Book or Zone : global
Address-set : asset
-
If choosing an SRX address book mode as Zone Defined, specify the zone name in the “Address Book or Zone” input field, and the address set in the “Address Set” input field. The address-set containing a dummy IP address must be created under the address-book for that zone at the SRX CLI.
You can create multiple entries (one for each zone) by separating the zones and address-sets with a space. For example: If you want to push several IP addresses to zone “untrust1” with address-set “asset1” and zone “untrust2” with address-set “asset2”, be sure to configure:
Address Book or Zone : untrust1 untrust2
Address-set : aset1 aset2
Configuring Security Policy Address Sets at the SRX CLI
The tasks to be completed at the SRX before configuration of SRX integration from the Juniper ATP Appliance Web UI are listed below:
-
Configure Zone based address book and address set security policies, as needed:
Zone-Defined Example with Syntax descriptions:
set security zones security-zone <JATP-Zone-name> address-book address
Customer_addr 0.0.0.0/32
set security zones security-zone <JATP-Zone-name> address-book address-set
<JATP-addressSet> address Customer_addr
-
Configure Zone attached address book and address set security policies, as needed:
Zone-attached Global Example:
set security address-book global address-set <JATP-addressSet> address
Customer_addr
set security address-book global address Customer_addr 0.0.0.0/32
set security address-book global address-set Customer_addressSet address
Customer_addr
Zone-attached User Defined Example:
set security address-book <JATP-book> address-set <JATP-addressSet> address
Customer_addr
...where <JATP-book> is the address-book (configured in “Address Book or Zone” in the Juniper ATP Appliance Web UI, and <JATP-addressSet> is the address-set configured in the “Address Set” field.
set security address-book <JATP-book> address Customer_addr 0.0.0.0/32
set security address-book <JATP-book> address-set <JATP-aset> address
Customer_addr
Note:Juniper ATP Appliance only pushes malicious IP addresses to the address-sets configured at the SRX CLI. An admin must configure the policies on the SRX to block connections going to the those malicious IP addresses. For example:
set security policies from-zone Internal to-zone Internet policy Customer_deny
match source-address any
set security policies from-zone Internal to-zone Internet policy Customer_deny
match destination-address <JATP-addressSet>
set security policies from-zone Internal to-zone Internet policy Customer_deny
match application junos-http
set security policies from-zone Internal to-zone Internet policy Customer_deny then deny
-
Move to the Juniper ATP Appliance Web UI to configure SRX integration.
-
For instructions on setting a zone-defined address book configuration, see Defining a Zone-Defined SRX Configuration at the Juniper ATP Appliance Web UI in the next section.
-
For instructions on setting a zone-attached address book configuration, see Defining a Zone-Attached SRX Configuration at the Juniper ATP Appliance Web UI.
-
For information about generating an SSH Key Pair, see Generating an SRX SSH public/private key pair.
-
For information about monitoring SRX firewall activity, see Viewing SRX Activity from the Juniper ATP Appliance Mitigation Tab.
-
Defining a Zone-Defined SRX Configuration at the Juniper ATP Appliance Web UI
Configuring Zone-Defined SRX mitigation is a two part process:
-
Use the SRX CLI to specify the security zone and address set(s).
-
Use the Juniper ATP Appliance Web UI to configure SRX mitigation integration.
To configure a Zone-Defined SRX integration:
-
Configure security policies as either zone-defined or global zone-attached by defining address book/address sets at the SRX CLI; for example:
Figure 19: Sample SRX CLI Configuration Example -
Navigate to the Config>Environmental Settings>Firewall Mitigation Settings page in the Juniper ATP Appliance Central Manager Web UI and select SRX.
Figure 20: Juniper ATP Appliance Auto-Mitigation Configuration Page
-
Select NETCONF.
-
Enter the SRX Host name or IP address. at the Host name/IP field.
-
Enter the NETCONF Port Number to allow login to the SRX: 830.
Note:The NETCONF port number is configured on the SRX and the defined port number is entered at the Juniper ATP Appliance Web UI Config NETCONF Port Number field.
-
Enter the username and password for SRX login at the User Name and Password fields.
Note:There are two modes available for logging into the SRX: username and password configuration, or SSH Key and secret passphrase (the SSH secret passphrase is the password defined in the Password field in column 2). To configure an SSH public/private key pair, refer to the section Generating an SRX SSH public/private key pair.
-
Enter the number of days before automatic deletion of mitigated IP addresses [0 days indicate addresses should never be deleted] in the Expire Days field.
After the number of days set for expire, the IP address will be removed automatically from the SRX.
-
Select Zone Defined for address set configuration in the SRX Address Book Mode area. The sample configuration mode shown below is Zone Defined.
-
Define the zone in the Address Book or Zone field (address book is for Zone-Attached sets, and Zone is for Zone-Defines sets); in the example above, the Zones are set as “trusted” and “untrusted” for our Zone- Defined configuration.
-
Define the address set(s) at the Address Set field; in our example, we have defined “asset1” and “asset2” per our SRX policy.
-
Click Save. Or, if you want to generate an SSH Key, follow the steps immediately below.
-
In the Current Auto-Mitigation Rules table, locate the SRX configuration you just saved and click the Test link to verify SRX integration.
-
Click Edit to modify the configuration settings, or Delete to remove the configuration.
-
The following is an example of the information Juniper ATP Appliance pushes to the SRX for Zone-Defined firewall mitigations:
Sample Syntax for a Zone Defined Mitigation named “trust”:
Example : Pushing IP address 10.31.165.131 to SRX
set security zones security-zone trust address-book address JATP-AUTOGENERATED- ADDRESS-10.31.165.131 10.31.165.131/32
set security zones security-zone trust address-book address-set asset1 address JATP-AUTO-GENERATED-ADDRESS-10.31.165.131
Configuring SecIntel Blocklist Feed
Juniper ATP Appliance extends its existing SecIntel feed capabilities to provide both IP addresses and URLs for mitigation using the blocklist feeds. Juniper ATP Appliance currently delivers Command & Control (C&C), GeoIP, and Infected Host feeds to the enrolled SRX devices. When the blocklist mitigation option is enabled, the blocklist feeds are also delivered to the enrolled SRX devices.
The SRX firewall mitigation methods that are currently supported by Juniper ATP Appliance is listed in Table 19.
|
Mitigation Method |
Mitigate IP Addresses |
Mitigate URLs |
|---|---|---|
|
NETCONF |
Yes |
No |
|
SecIntel Blocklist Feed |
Yes |
Yes |
If you are using the SecIntel blocklist mitigation method, then ensure that the SRX devices enforcing this mitigation is enrolled with the Juniper ATP Appliance.
To configure a SecIntel blocklist feed with SRX firewall, you must first remove other SRX configurations using the NETCONF method, else, the configuration returns an error. You can only create a single SRX configuration with SecIntel blocklist feed. Once you have created an SRX configuration with Secintel blocklist feed, you cannot create any other SRX configurations.
For IPv6 addresses, Juniper ATP Appliance checks whether each SRX Series Firewall is capable of supporting IPv6 data in the IP feed, and returns the appropriate feed content. For IPv6 addresses which are blocklisted, the feeds will only be delivered to SRX devices that are capable of receiving IPv6 feed data.
To send IP address and URL lists to SRX firewall, you must create a mitigation rule on ATP Appliance.
-
Navigate to the Config > Environmental Settings > Firewall Mitigation Settings page in the Juniper ATP Appliance Central Manager Web UI.
-
Click Add New Auto Mitigation Rule.
-
Select SRX from the Mitigation Type category.
-
Select SecIntel Blacklist Feed option under Mitigation Method as shown in Figure 21.
Figure 21: SecIntel Blacklist Feed
-
Enter the IP feed name and URL feed name for mitigation. Refer to the guidelines in Table 20.
-
Click Add.
The new auto mitigation rule that you created is displayed under Current Auto Mitigation Rules section. You can edit, delete, disable or test the new mitigation rules.
|
Mitigation Fields for SRX Firewall |
Definition |
|---|---|
|
IP Feed Name |
Enter the feed name for the list of suspicious IP addresses sent from ATP Appliance to SRX firewall. The name must only contain alphanumeric characters, including some special characters such as, commas, dashes and underscores. |
|
URL Feed Name |
Enter the feed name for the list of suspicious URLs sent from ATP Appliance to SRX firewall. The name must only contain alphanumeric characters, including some special characters such as, commas, dashes and underscores. |
Viewing SRX Activity from the Juniper ATP Appliance Mitigation Tab
To monitor SRX mitigation operations at the Juniper ATP Appliance Web UI, navigate to the Mitigation tab to view firewall mitigation activity:
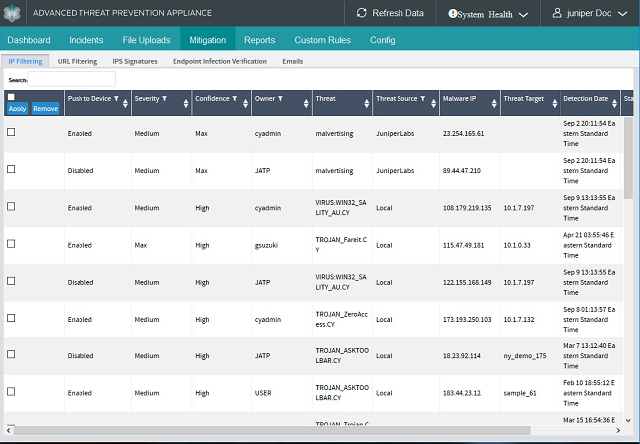
When a policy is in the process of being applied, an administrator may note that the message in the Mitigation page for that operation states “Pending Apply”:
To remove a blocking rule, click Delete in the Config to remove a blocking configuration.
Generating an SRX SSH public/private key pair
-
To generate an SSH public/private key pair, create or edit the SRX configuration.
-
Check Enabled as well as the Generate New SSH Key Pair checkboxes.
-
Click Save.
-
Click Edit in the Current Auto-Mitigation Rules table to open that same SRX configuration; the new SSH public key is displayed in the window:
-
Copy the generated SSH public key and paste at SRX CLI to configure the SRX accordingly; for example:
set system login user admin authentication ssh-rsa
"ssh-rsa AAAAB3NzaC1yc2EAAAADAQABAAABAQC8gjrdWo5dpOHT+PtliV1N6rV4nBTdTE12zQdZSqqbBo
OBWe……”
Note:The SSH secret passphrase used by the Key is the password defined in the Password field in column 2.
Defining a Zone-Attached SRX Configuration at the Juniper ATP Appliance Web UI
Similar to setting Zone-Defined SRX mitigation, Zone-Attached SRX integration is a two part process:
-
Define a custom address book and attach the address book to one or more zones using the SRX CLI.
-
Use the Juniper ATP Appliance Web UI to configure SRX mitigation integration.
To configure a Zone-attached policy from the SRX (to be performed by the SRX administrator):
-
Using the SRX CLI, create an address book "Customer_addressbook" and address-set "Customer_addressSet" with an IP that will not be removed.
-
Attach the address-book to one or more zones.
-
Move to the Juniper ATP Appliance Central Manager Web UI to integrate with the SRX zone-attached address book and address sets.
To configure Zone-Attached SRX integration from the Juniper ATP Appliance Central Manager Web UI:
-
Navigate to the Config>Environmental Settings>Firewall Mitigation Settings page in the Juniper ATP Appliance Central Manager Web UI and select SRX.
Note:In SRX Firewalls running Junos version 11.2 or later, zone attached methods use a "global" address book that is always defined and is always (implicitly) attached to every security zone. If an admin chooses to specify an address set in this global address book, they can just type the word "global" in the address book name field. (this is the default address book’s actual name). The "global" address book is a special address book named "global" and should be referenced as such in the Juniper ATP Appliance Web UI for zoneattached configurations if that book is the one to be used in the configuration. In our example, we use an address book named “trust.”
-
Enter the SRX Host name or IP address. at the Host name/IP field.
-
Enter the NETCONF Port Number to allow login to the SRX: for example, 830.
Note:The NETCONF port number is configured on the SRX and the defined port number is entered at the Juniper ATP Appliance Web UI Config NETCONF Port Number field.
-
Enter the username and password for SRX login at the User Name and Password fields.
Note:There are two modes available for logging into the SRX: username and password configuration, or SSH Key and secret passphrase (the SSH secret passphrase is the password defined in the Password field in column 2). To configure an SSH Key, refer to the section .
-
Enter the number of days before automatic deletion of mitigated IP addresses [0 days indicate addresses should never be deleted] in the Expire Days field.
-
Select Zone Attached for address set mitigation configuration in the SRX Address Book Mode area. The sample configuration mode shown below is Zone Attached.
-
Define the Address Book Name in the Address Book or Zone field (address book is for Zone-Attached sets, and Zone is for Zone-Defined sets); in the example above, the Address Book is set as “trust” for our Zone- Attached configuration example.
-
Define the address set(s) at the Address Set field; in our example, we have defined “asset2” per our SRX policy.
-
Click Save. Or, if you want to generate an SSH Key, follow the steps in the section .
-
In the Current Auto-Mitigation Rules table at the bottom of the Config>Environmental Settings>Firewall Mititgation Settings page, locate the SRX configuration you just saved and click the Test link to verify SRX integration.
-
Click Edit to modify the configuration settings, or Delete to remove the configuration.
-
The following is an example of the information Juniper ATP Appliance pushes to the SRX for Zone-Attached firewall mitigations:
Example :
Pushing IP address 31.170.165.131 to SRX
Sample Syntax for “Global” Address Book and Address Set Zone Attached Mitigation:
set security address-book global address JATP-AUTO-GENERATED-ADDRESS-
10.31.165.131 10.31.165.131/32 set security address-book global address-set asset2 address JATP-AUTO-GENERATED
ADDRESS- 10.31.165.131
Sample Syntax for User Defined Address Book and Address Set Zone Attached Mitigation:
set security address-book book1 address JATP-AUTO-GENERATED-ADDRESS-10.31.165.131
10.31.165.131/32
set security address-book book1 address-set asset2 address JATP-AUTO-GENERATED
ADDRESS- 10.31.165.131
Configuring a Cisco ASA Firewall
With integrated Cisco ASA Firewall support, enterprises with deployed ASA Firewalls are able to push IP addresses from Juniper ATP Appliance products to the Cisco ASA Firewall platform for malware blocking. Juniper ATP Appliance uses a REST interface to communicate with the ASA Firewall.
To perform Cisco ASA Firewall integration, an ASA Administrator must download and enable the REST API Agent from http://www.cisco.com --note that downloading requires a valid Cisco service contract. The “Cisco ASA REST API Quick Start Guide” is available online. Be sure to review the “ASA REST API Compatibility” section of the “Cisco ASA Compatibility” document to determine if the REST API is supported on a particular ASA hardware platform.
Cisco ASA Firewall Configuration
A Cisco ASA administrator must configure a “network object group” on the ASA. Note that multiple network object groups are a “hidden” feature on the ASA Firewall.
Cisco ASA Firewall Configuration Example:
Here is a sample ASA configuration:
(config)# object-group network JATP-BLOCK
(config-network)# network object host 10.1.1.1
(config)# access-list 101 extended deny ip object-group JATP-BLOCK any
This configuration requires a “dummy” IP address to allow for configuration of the network object group. An identical requirement is required for the SRX integration strategy.
Juniper ATP Appliance ASA Firewall Configuration
Navigate to the Config>Environmental Settings>Firewall Mitigation Settings page to configure auto-mitigation of Juniper ATP Appliance-detected malware at a Cisco ASA Firewall.
To configure the ASA Firewall, use the following procedure:
-
Select ASA from the Mitigation Type column.
-
Enter the firewall hostname or IP address in the Hostname/IP field.
-
Enter the firewall Port Number if different than the default 443.
-
Enter the administrator User Name and Password.
-
Enter the Network Object Group as configured on the ASA firewall.
-
Enter the Expiry number of days for the connection; the default is 60 days.
Configurations at the FortiManager Console
Begin by applying this required configuration on FortiManager before configuring the Juniper ATP Appliance device:
Enable rpc_permit read/write:
# config system admin user
(user)# edit admin
(admin)# show
config system admin user
edit "admin"
set profileid "Super_User"
set adom "all_adoms"
set policy-package "all_policy_packages"
config meta-data
edit "Contact Email"
next
edit "Contact Phone"
next
end
set rpc-permit read-write <-------
config dashboard
edit 1
set name "System Information"
config system admin user
edit <user> <-- replace <user> with the account name
set rpc-permit read-write
next
end
At the FortiManager console, create the following:
-
An ADOM (Administrative Domain) that also needs to be enabled. Once an ADOM is created the ADOM name is needed for JSON RPC requests
-
An Address Group must be created with at least one IP address (dummy) even before the Juniper ATP Appliance adds any additional IP addresses.
-
Webfilter Profile (optional) needs to be created, and URL filtering needs to be enabled as shown in the sections immediately below.
Note:An Address Group name (if specified) is used to push blocking information for IP addresses. The Webfilter Profile name (if specified) is used to push blocking information for URLs. While these two parameters are optional, at least one --an Address Group or Webfilter name-- must be specified. An error message is displayed if neither is specified.
-
Create a Policy package (optional). If specified, policies are installed (pushed) to all the FortiGates listed as Installation Targets in the policy package. If the policy package name is not configured on the Juniper ATP Appliance, it will not push or install these policies to FortiGates and such an install would then need to be done manually or via other means (for instance, by running custom scripts according to a schedule).
FortiManager requires that IP addresses be added to a common pool of ‘Addresses’ and these addresses can be added to an address group. When creating an address group at the FortiManager console, be sure you specify at least one IP address in that group. See menu below.
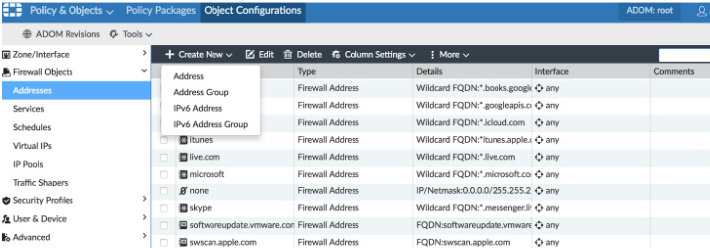
You also need to create a Web/Filter Profile at the FortiManager console, under which its possible to add URLs for blocking.
In the FortiManager webfilter profile, the URL filter must be enabled. All URLs to be blocked will be pushed to this URL filter from the Juniper ATP Appliance.
Also required for Fortinet FW and FortiManager integration is a Policy Package with policies that reference the address group and webfilter name created for integration. Specify the installation targets (fortigate devices) to which this policy package is to be installed.

Configurations at the Juniper ATP Appliance Central Manager
To configure the Fortinet Firewall and management platform, use the following procedure:
-
Select Fortinet from the Mitigation Type column.
-
Enter the firewall hostname or IP address in the Hostname/IP field.
-
Enter the administrator User Name and Password.
-
Enter the Address Group as configured on the Fortinet firewall.
-
Enter the Web/Filter Profile name as configured on the Fortinet firewall.
Note:An Address Group name (if specified) is used to push blocking information for IP addresses. The Webfilter Profile name (if specified) is used to push blocking information for URLs. While these two parameters are optional, at least one --an Address Group or Webfilter name-- must be specified. An error message is displayed if neither is specified.
-
If configuring the FortiManager platform, click FortiManager and additional fields are displayed.
Note:Juniper ATP Appliance Fortinet integration supports FortiManager version 5.4 or later.
-
Enter the Administrative Domain name (ADOM) configured for the FortiManager.
-
Enter the Policy package name, also configured at the FortiManager.
-
Click Add to finalize the configuration.
FortiManager is the manager of FortiGate devices and offers JSON-RPC API based access for configuration. The Juniper ATP Appliance uses these APIs.
Configuring a Check Point Firewall
Configured Check Point Firewall integration allows Juniper ATP Appliance products to communicate and perform threat mitigation in concert with Check Point firewalls. A Juniper ATP Appliance administrator can choose to block a particular threat or remove a previously propagated mitigation via Check Point Firewall integration.
Communication takes place via the SSH interface through which Check Point users may also access the CLI of the Check Point device.
Blocking information is submitted using Check Point APIs. By pushing malicious IP addresses to integrated Check Point appliances, similar to Juniper ATP Appliance’s established PAN and Juniper integration support, an administrator identifies threats at the Firewall or Secure Web Gateway, and submits the selected objects to the configured Check Point Firewall from the Central Manager Web UI.
Check Point Firewall integration requires Check Point GAiA operating system release R76, R77, or later. Check Point IPSO and Secure Platform (SPLAT), which are predecessors of GAiA, are not supported.
Configuring and Deploying the Check Point Firewall
A Juniper ATP Appliance product propagates malicious IP addresses to Check Point appliances using the Check Point Suspicious Activity Monitor (SAM) feature. SAM status and commands are available under the “SmartView Monitor” app in the Check Point “Smart Console” family of Web UI applications.
Deploying Check Point GAiA appliances involves configuration of Security Management Servers and Security Gateways. In standalone configurations, the Security Management Server and the Security Gateway are installed on the same machine. In distributed configurations, a single Security Management Server can manage a number of subordinate Security Gateways.
Juniper ATP Appliance supports both standalone and distributed Check Point deployments. In either case, the Juniper ATP Appliance must be configured with the IP address of the Check Point Security Management Server.
Unlike other integrations, no address group or similar object need be configured. With Check Point, an administrator can choose to drop or reject connections to the mitigated IP, and either close or maintain existing connections. These choices are selected during Juniper ATP Appliance configuration of Check Point integration.
Juniper ATP Appliance firewall blocking corresponds to Check Point CLI SAM commands, as follows:
fw sam -J any <blocked_address>
# Drop and close
fw sam -C -i any <blocked_address>
fw sam -C -j any <blocked_address>
fw sam -s <sam_server> -S <SIC_name> -f
<fw_host> -[ i | j | I |J] any
<blocked_address>
fw_host can be All, localhost, Gateways, or a group or object name
fw sam -s <sam_server> -S <SIC_name> -f
<fw_host> -C -i any <blocked_address>
fw sam -s <sam_server> -S <SIC_name> -f
<fw_host> -C -j any <blocked_address>
The Check Point “FW SAM CLI Reference” guide is available online.
Configuring Juniper ATP Appliance Integration with Check Point
To configure Check Point Firewall integration:
Navigate to the Config>Environmental Settings>Firewall Mitigation Settings page to configure auto-mitigation of Juniper ATP Appliance-detected malware at a Check Point Firewall.
-
Select Check Point from the Mitigation Type column.
-
Enter the firewall hostname or IP address in the Hostname/IP field.
-
Enter the administrator User Name and Password.
Note:Check Point login credentials configured on Juniper ATP Appliance must correspond to a Check Point account with /bin/bash as its shell - this corresponds to “expert” mode in the Check Point CLI. Note that this is not the default shell; the default is clish.
-
Enter the Expiry number of days for the connection; the default is 60 days.
-
Select an Inhibit Mode option:
-
Drop and Close - drop the packet and close the connection when blocking request is received at the firewall
-
Reject and Close - reject the packet and close the connection
-
Drop - drop the packet. With drop (block), the packet is dropped and nothing is sent back to the sending program/system. So an attacker cannot know if they ever reached their destination or a firewall. It looks to the attacker as if the IP address has nothing there at all.
-
Reject - reject the packet. With reject, a TCP RST or ICMP port unreachable for UDP is returned to the sender.
-
-
Enter the Secure Internal Communications SIC Name of the security management server for the Check Point firewall.
-
Select an Enforcement Host option:
-
All - all enforcement hosts and groups or object
-
Gateways - secure gateways as preferred enforcement hosts
-
Group or Object - a configured security policy group or object
-
Objects represent the hosts, gateways, networks, and hosts managed by the Check Point firewall. A Group might show each Network Object group as a branch. The Security Gateways enforce an enterprise’s security policies and act as a security enforcement point.
Configuring Forcepoint SMC
Forcepoint NGFW Security Management Center (SMC) offers centralized management of Forcepoint Next Generation Firewalls across distributed network enterprises. With monitoring, logging, alerts, and reports, Forcepoint SMC provides a complete view of network security events to administrators.
The Juniper ATP Appliance platform monitors and detects malicious IP addresses and the URLs that link to malware. Integration with Forcepoint SMC prevents users behind the Forcepoint firewall from accessing these IPs or URLs.
ATP Appliance was tested and validated with Forcepoint SMC version 6.3.5.
This integration includes configuration tasks on the Forcepoint SMC as follows:
Enable the Forcepoint SMC API to allow other applications to connect using the SMC API.
-
In the Forcepoint SMC, select Home.
-
Navigate to Others > Management Server.
-
Right-click on Management Server and select Properties.
-
Click the SMC API tab and select Enable.
-
Optionally, in the Host Name field, enter the name that the SMC API service uses. If you do not enter a name, API requests are allowed to any host name.
-
Make sure that the listening port is set to the default of 8082 on the Management Server.
-
If the Management Server has several IP addresses and you want to restrict access to one, enter the IP address in the Listen Only on Address field.
-
If you want to use encrypted connections, click Select, then choose the TLS Credentials element. For instructions on creating TLS credentials, refer to the procedure below.
-
Click OK.
Create TLS credentials for SMC API Clients. (Note that you can import the existing private key and certificate if they are available.)
-
In the Management Client, select Configuration.
-
Navigate to Administration > Certificates > TLS Credentials.
-
Right-click TLS Credentials and select New TLS Credentials.
-
Complete the certificate request details:
-
In the Name field, enter the IP address or domain name of SMC.
-
Complete the remaining fields as needed. See the Forcepoint Documentation for details.
-
Click Next.
-
-
Select Self Sign.
-
Click Finish.
The TLS Credentials element is added to Administration > Certificates > TLS Credentials. The State column shows that the certificate has been signed.
Create an API Client element. (External applications use API clients to connect to Forcepoint SMC.) Before you begin, the SMC API must be enabled for the Management Server. Those instructions were provided above.
-
Select Configuration and navigate to Administration.
-
Navigate to Access Rights.
-
Right-click Access Rights and select New > API Client.
-
In the Name field, enter a unique name for the API Client.
-
Use the initial authentication key or click Generate Authentication Key to generate a new one. A random authentication key is automatically generated. (Note that this key appears only once, and you should make a note of it because the ATP Appliance auto-mitigation rule will require you to enter it in a later step. The API Client uses the authentication key to log on to SMC API.)
-
Click the Permissions tab.
-
Select the permissions for actions in the SMC API. See the Forcepoint documentation for details.
-
Click OK.
Configuring a New Mitigation Rule for Forcepoint SMC
To send IP address and URL lists to Forcepoint SMC, you must create a mitigation rule on ATP Appliance.
-
Navigate to the Config > Environmental Settings > Firewall Mitigation Settings page.
-
Click Add New Auto-Mitigation Rule.
-
Select Forcepoint SMC from the Mitigation Type category.
-
Enter a Hostname/IP, a Host Protocol and a Port Number for the device integration. Details provided in table below.
-
Enter the API Key for the Forcepoint SMC.
-
Enter the IP List Name. This IP List name can refer to an existing or new IP List. If the specified IP List does not exist, it will be created when there is a malicious IP address to be sent to the Forcepoint SMC.
-
Enter the URL List Application Name. As with the IP List, this can refer to an existing or new URL List. If the specified URL List does not exist, it will be created when there is a malicious URL to be sent to the Forcepoint SMC.
Note:Forcepoint SMC does not support wildcards in the URL List. Therefore wildcard URL entries cannot be sent to the Forcepoint SMC. If ATP Appliance URL mitigation has URLs with wildcards, then upon applying the rule, the ATP Appliance UI status reads as “Unsupported.”
-
ClickSave.
Figure 26: Firewall Mitigation Settings - Forcepoint SMC Note:
Note:When you add or remove configurations in ATP Appliance, the status (success/fail) of the rule is not immediately reflected in ATP Appliance Mitigation > IP Filtering and ATP Appliance Mitigation > URL Filtering Page. You must click Refresh Data to view the status.
|
Mitigation Fields for Forcepoint SMC |
Definition |
|---|---|
|
Host Name/IP |
Enter the host name or IP address of the Forcepoint SMC. |
|
Port Number |
Enter the port number. It defaults to port 8082 for API calls. |
|
Host Protocol: HTTP or HTTPS |
If HTTPS is selected, you can enable verification of the Forcepoint SMC SSL certificate. This is done by enabling the Verify SSL Certificate option. Additionally, if you have a CA certificate to use for verification of the Forcepoint SMC certificate, it can be pasted into the text box. Otherwise, it will use a set of public CA certificates. |
|
API Key |
Enter the authentication key you created on Forcepoint SMC. |
|
IP List Name |
This is the list of suspicious IP addresses sent from ATP Appliance to Forcepoint SMC. This IP List name can refer to an existing or new IP List. If the specified IP List does not exist, it will be created when there is a malicious IP address to be sent to the Forcepoint SMC. |
|
URL List Application Name |
This is the list of suspicious URLs sent from ATP Appliance to Forcepoint SMC. As with the IP List, this can refer to an existing or new URL List. If the specified URL List does not exist, it will be created when there is a malicious URL to be sent to the Forcepoint SMC. |
Apply the configured mitigation rule from the Juniper ATP Appliance Mitigation page.
-
Select a threat row (or multiple rows) in the Mitigation table and click Apply.
-
After clicking Apply, all rules are pushed to the Forcepoint SMC.
-
After adding or removing rules, Refresh the page to view the status.
-
Once the mitigation rule is configured, it is enabled by default. Using the available buttons, you can Disable and then Enable the rule as needed. A Test button is available for the auto-mitigation rule to test the accuracy of the configuration. A Remove button is also available per row in the event you need to remove the auto-mitigation rule.
Note:Test the Forcepoint SMC configuration using the Test link in the Firewall Mitigation Settings > ForcePoint SMC page. This link tests whether the ForcePoint SMC server is reachable and the API key is working.
If the test fails, try the following:
-
Check that the Forcepoint SMC server is reachable. The default API port for Forcepoint SMC is 8082.
-
Make sure the API key configured in SMC and ATP Appliance are the same.
-
If it is a HTTPS configuration, make sure the TLS credentials are configured in ForcePoint SMC according to the instructions in this section.
-
IP and URL rules can be enabled for auto-mitigation. With auto-mitigation, rules can be pushed automatically to the integrated ForcePoint SMC without user interaction. See Configuring Auto-Mitigation for details.
To view and edit IP address and URL lists pushed from ATP Appliance to Forcepoint SMC, on the Forcepoint SMC, do the following:
-
For the IP List, navigate to Configuration > Network Elements > IP Address List. You should see the named list you created on ATP Appliance.
-
For the URL List, under Other Elements, navigate to Network Applications (by type) > URL List. You should see the named list you created on ATP Appliance.
Configuring Enterprise Network Asset Values
Use the Asset Value configuration window to define network segment risk values. By qualifying the asset values of your own enterprise network segments, you are adding additional focus to the in-context threat metrics assessed by the Juniper ATP Appliance detection system. Asset Value context helps to filter out the overwhelming noise associated with non-context-driven threat reporting.
For example, the security of the finance department or engineering department in your enterprise may represent high risk assets or critical intellectual property, so you may want to enter the IP address of those network segments in the Asset Value configuration window. The Juniper ATP Appliance detection and chain heuristics engines use configured asset values to ascertain threat metrics for detected incidents.
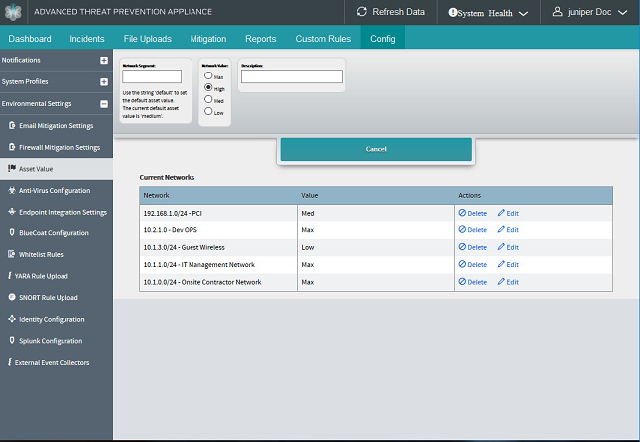
To assign Asset Value to a network segment:
-
Navigate to the Config>Environmental Settings>Asset Value page.
-
Enter the IP Address of the high asset-value network segment in the Network Segment field, or enter “default” to set the default=high risk setting.
-
Enter a network Value: Max | High | Med | Low
-
Enter a description for the Asset; for example: CEO Office.
-
Click Submit.
Configuring Anti-Virus Integration
Use the Config>Environmental Settings>Anti-Virus Configuration page to set anti-virus tool integration per enterprise network segment.
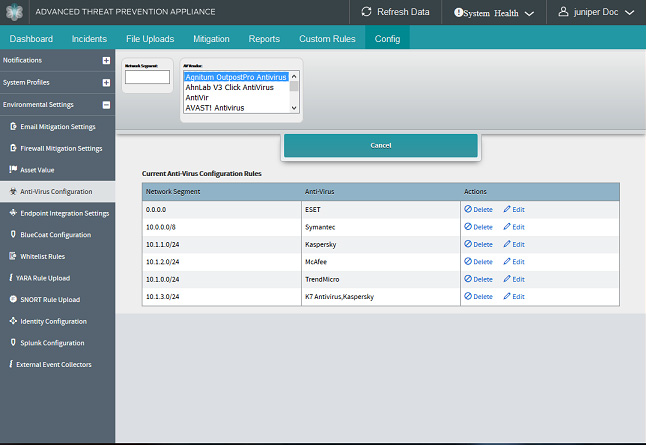
To perform anti-virus configuration:
-
Navigate to the Config>Environmental Settings>Anti-Virus Configuration page.
-
Enter the IP Address of a network segment.
-
Select the configured Anti-Virus package for that segment from the AV Vendor list and click Add.
Add multiple network segments as necessary: for example, you might add one network segment as 10.0.0.0/8 and the other one as 172.16/16 to cover all your segments, as shown in the following figure.

Configuring Endpoint Integration: Crowdstrike and Carbon Black Response
Us the Juniper ATP Appliance Central manager Web UI Config>Environmental Settings>Endpoint Integration Settings configuration page to configure Carbon Black Response and/or Crowdstrike endpoint integration.
- Configuring Carbon Black Response Endpoint Integration
- Obtaining the Carbon Black Response API Key
- Configuring the Carbon Black Response Integration at the Juniper ATP Appliance CM
- Configuring Crowdstrike Endpoint Integration
Configuring Carbon Black Response Endpoint Integration
Carbon Black Response is providing one source of information in calculating the risk score of a malware - Is the malware run on the end-point? The question is asked to a Carbon Black Response server based on three criteria: the malware md5, the end-point IP address, and the malware download timestamp.
Configuration of Carbon Black Response for endpoint monitoring and mitigation is a two-step process:
-
Obtain the Carbon Black Response Account API key from the Carbon Black Response Web UI. See Also: Obtaining the Carbon Black Response API Key.
-
Enter the Key and other device configuration information to the Juniper ATP Appliance Web UI Carbon Black page shown below.
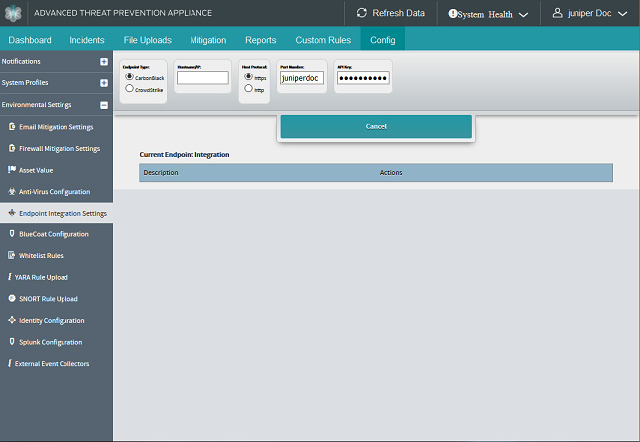
Obtaining the Carbon Black Response API Key
-
From the Carbon Black Response Web UI, click the top right admin user dropdown and select Profile info.
-
From the left panel Profile info menu, select API Token.
-
Copy the API Token from Your API Token box.
-
Obtain the hostname of the Carbon Black Response server (example: https://JATP.cloud.carbonblack.com)
Configuring the Carbon Black Response Integration at the Juniper ATP Appliance CM
-
Navigate to the Config>Environmental Settings>Endpoint Integration Settings page.
-
Select CarbonBlack as the Endpoint Type.
-
Enter the device Hostname or IP address.
-
Enter the Host Protocol: HTTPS or HTTP.
-
Enter the device Port Number.
-
Enter the Carbon Black Response API Key and click Submit.
Configuring Crowdstrike Endpoint Integration
Before configuring CrowdStrike Endpoint Integration, obtain the following data:
-
CrowdStrike Falcon API server hostname
-
CrowdStrike Falcon API user
-
CrowdStrike Falcon API key
AD integration must be enabled as a prerequisite for Crowdstrike Endpoint Integration.
-
Navigate to the Config>Environmental Settings>Endpoint Integration Settings page.
-
Select Crowdstrike as the Endpoint Type.
-
Enter the device Hostname or IP address.
-
Enter the Crowdstrike API User.
-
Enter the Crowdstrike API Key.
-
Click Add.
-
Click Test in the Current Endpoint Integration table row to verify the Crowdstrike integration. This link tests whether the CrowdStrike server is reachable and the API user and key is working.
At the Central Manager Web UI Incidents, if an endpoint has executed malware, an EX flag is displayed.
Configuring BlueCoat ProxySG Integration
Juniper ATP Appliance publishes a “web page” with a list of URLs to which the BlueCoat proxy device is directed for network forensics integration. BlueCoat ProxySG polls the malicious URL list periodically to collect blocking details.
Bluecoat can be configured to apply various rules to the Juniper ATP Appliance list, including blocking, as desired.
Be sure to allowlist the Juniper ATP Appliance to avoid being SSL intercepted. On the BlueCoat sie, this is accomplished by adding a policy rule in the SSL Intercept layer and setting the Juniper ATP Appliance GSS hostname as the destination in the policy rule; set the action to "Disable SSL Interception".
See Also: and for External Event Collection Bluecoat options.
To configure BlueCoat integration from the Juniper ATP Appliance side:
-
Navigate to the Central Manager Web UI Config>Environmental Settings>BlueCoat Configuration page.
-
Check Availability.
-
Enter BlueCoat Exception Page value; the default is content_filter_denied.
Note:If there is a need to change the default to a user-defined value, create the exception first on BlueCoat. Note that the exception format must be followed: it cannot include spaces or an exclamation mark (!).
-
Enter the Cache Age; the default is 10 minutes (0 for no cache).
-
Enter the Allowed IPs (or leave the field empty to allow all IPs).
-
Enter URL, or click Refresh URL or Get PEM File buttons.
-
Click Submit.
To configure BlueCoat integration from the BlueCoat side:
-
Create and import a CA Certificate by navigating to the BlueCoat ProxySG Management Console Configuration>SSL>CA Certificates page.
-
On the Import CA Certificate page, click Apply (at the bottom).
-
From the SSL>CA Certificates page, select CA Certificate Lists from the left panel menu tab.
-
Highlight browser-trusted from the list, then click Edit.
-
In the Edit CA Certificate window, select the Juniper ATP Appliance intended certificate and click Add to move the newly created CA Certificate entry from left to right.=, then click Apply.
-
Set up polling by navigating to the Policy>Policy Files page.
-
Check the box for Automatically Install New Policy When Central File Changes.
-
Click the Install button for the Install Central File from: REMOTE FILE option.
-
In the Install Central File window, paste the URL from Juniper ATP Appliance (Config>Environmental Settings>BlueCoat Configuration>URL) into the Installation URL field and click Install.
-
In the File Installed window, a message displays “The file was successfully downloaded and installed;” click OK.
-
Next, configure how often BlueCoat is going to poll by setting the following from the CLI; refer to the following example:
# ssh admin@10.2.121.10
10.2.121.100 - Blue Coat SGVA Series> enable
Enable Password:
10.2.121.100 - Blue Coat SGVA Series#(config)policy poll-interval 5
This example sets a 5 minute interval between polls.
Configuring Allowlist Rules
An enhanced Allowlist feature now includes the addition of distinct attributes (also referred to as selectors) with which allowlisting can be filtered.
Filtering attributes (selectors) are based on:
-
Threat Source IP
-
Threat Target IP
-
Threat Source Domain
-
Threat Source Host
-
Threat Target Host
-
Source Email Id
-
Destination Email Id
-
Threat Source URI
-
Threat SHA1 Hash
-
Certificate Signer
Supported selectors vary by event type. The support matrix for various event types includes:
|
Exploit |
src_ip, dst_ip, host, domain, uri, sha1sum |
|
Cooking (Analysis) |
src_ip, dst_ip, host, domain, uri, sha1sum |
|
Infection |
src_ip, dst_ip |
|
Analysis via File Submission (File Upload) |
sha1sum |
Adding an unsupported selector to a rule may prevent the event from matching the rule, and may thereby result in it not filtering out.
Allowlisted events are suppressed in the Incidents tables, and alert generation is also suppressed, but this does not affect malware analysis. However, Allowlist selectors can be removed and the corresponding incidents that were suppressed will be regenerated.
Be aware that the different selectors in a allowlist rule are AND’ed. To perform an OR operation, create separate rules using the selectors that need to be ORed.
Configure Allowlist filtering rules from the Configuration tab > Whitelist Rules page; administer allowlists and filtering criteria using the Incidents page Add to Whitelist link.
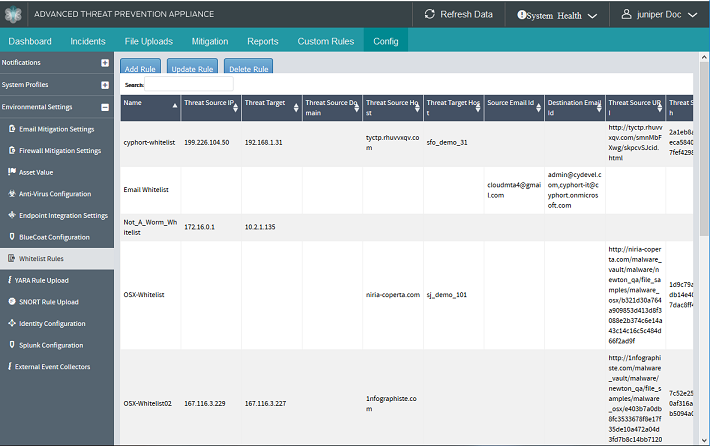
Be sure to allowlist the Juniper ATP Appliance to avoid being SSL intercepted.
To configure allowlist filtering rules:
-
Navigate to the Config>Whitelist Rules page in the Central Manager Web UI.
-
Click Add to configure criteria for a new allowlist rule.
Figure 31: Create New Whitelist Rule Window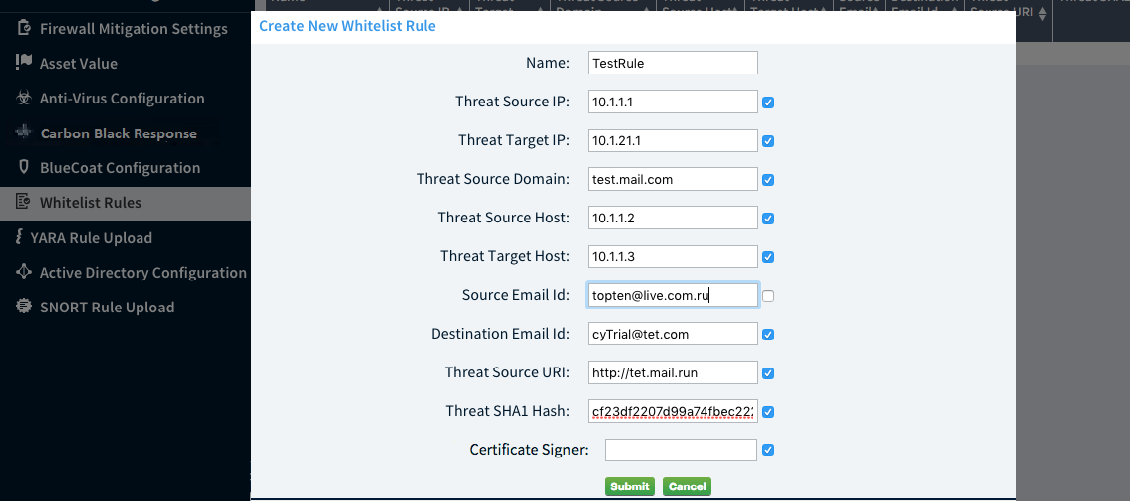
-
In the Create New Whitelist Rule window, enter the criteria for the new rule and checkmark for inclusion at this time (can be disabled and re-enabled later, as needed).
Tip:Use all selectors shown to match a specific event or uncheck some selectors to broaden the scope of allowlisting.
Note:When you select multiple attributes for the allowlist, it is an AND condition.
The fields are defined as follows.
Rule Criteria
Description
Name
Enter a name for the rule.
Threat Source IP
Enter the IP Address of the Threat Source.
Threat Target IP
Enter the IP Address of the targeted endpoint.
Threat Source Domain
Enter the domain name of the Threat Source
Threat Source Host
Enter the HTTP protocol (server) host for the Threat Source.
Threat Target Host
Enter the HTTP protocol (server) host for the Threat Target.
Source Email Id
Enter the Source Email ID.
Destination Email Id
Enter the Destination Email ID.
Threat Source URI
Enter the URI for the Threat Source.
Threat SHA1 Hash
Enter the SHA1 hash.
Certificate Signer
Enter the full name as it appears on the digital certificate. So if the signer is Google, Inc, you cannot enter just Google because the allowlist rule will not match the files signed by Google, Inc.
This is an optional entry; if there is no signer, then leave the Certificate Signer field blank.
-
Click Submit to complete the Allowlist Rule configuration.
Note:The Juniper ATP Appliance Release allows enhances allowlisting functionality by allowing users to allowlist based on a signing certificate.
Updating and Redefining Allowlist Filters from the Incidents Page
On the Incident tab, when an Incident includes the option to Add to Whitelist, as shown below, these same criteria can be again edited and applied as part of the incident allowlisting process.
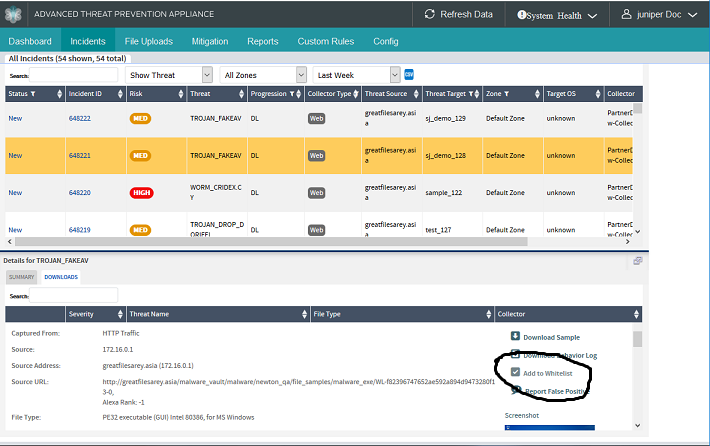
-
To edit Allowlist Filter criteria while adding the incident to the allowlist, click the Add to Whitelist link.
-
In the Update Whitelist Rule window, you may add additional allowlist rule criteria, deselect (uncheck) currently established criteria, or update the rule set as is.
-
Click Submit and the incident is added to the allowlist according to the criteria defined and checked in the Update Whitelist Rule window.
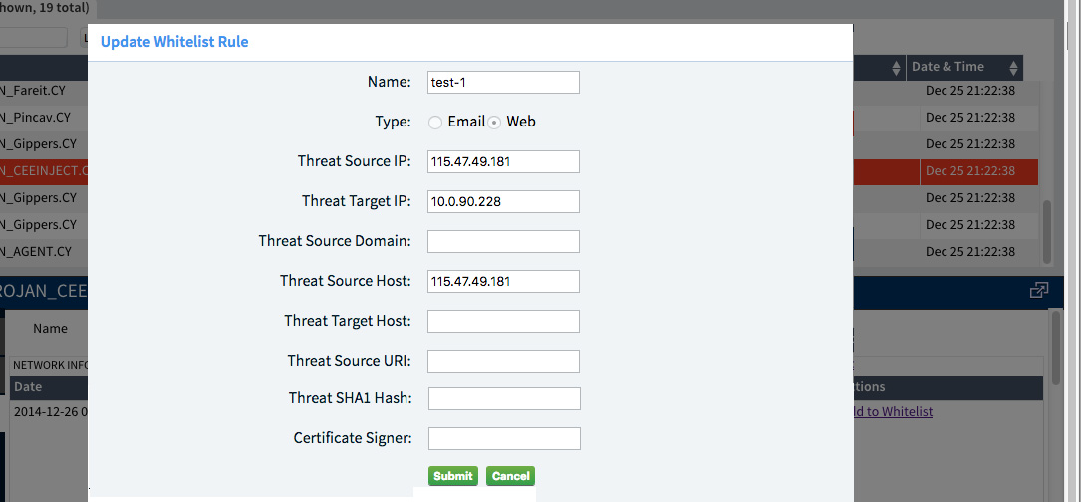
It is important to proceed slowly when adding/removing/updating (making any changes) to an allowlist rule. Wait for few minutes after making any changes so that the allowlisting can take effect. If it seems that the rules are not updating, perform a dummy rule update to rectify the situation, using the following test-run strategy:
-
Navigate to the Config>Whitelist Rules page and click Add Rule.
-
Provide a rule name for the test rule such as DummyRule.
-
Provide the hash value as :abcd
-
click on Submit.
-
Wait a few minutes and then remove this rule.
Note:Allowlist rules rely on normal service shutdown to be backed up. Powering off a VM directly will lose the allowlist state as rules cannot be saved in that case.
Configuring YARA Rules
Configure and enable YARA rules to analyze object and traffic files for relevant malware matches. When a malware byte-pattern match is identified, analysts can specify that byte-pattern as a YARA rule and upload to the Juniper ATP Appliance Central Manager to be used to detect related malicious files during Juniper ATP Appliance malware detonation and analysis cycles.
YARA rules can be defined as malware families based on textual or binary patterns obtained from samples of identified families. Rule descriptions consist of a set of strings and a Boolean expression that establishes the rule’s logic. In addition, YARA integration results are displayed on the Incidents page and indicate whether an object can be classified as malicious. YARA rules are also used to classify malware samples.
To Create a YARA Rule
Write a text file that contains one or more YARA rules that specify a pattern, condition or string to match. A few examples follow:
rule match_test
{
aastrings:
aaaa$a = {6B 41 18 22 32 11 88 7C 16 5F 94}
aaaa$b = {8D 4G B0 2S C1 83 S0 24 99 6A 4T 59 F4 K9}
aaaa$c = "FDHJBVFSGHLKHGFFDDFDSGKJKJFD"
aacondition:
aaaa$a or $b or $c
}
rule excel_test
{
aastrings:
aaaa$excel = “Excel”
aacondition:
aaaa$excel
}Administrators can define YARA rules for a particular file type (for example: ‘pdf’, ‘exe’, ‘docx’) or apply the rule to all file types (for example: ‘common’). Multiple rules can be contained within one YARA Rule file.
To upload and enable a YARA Rule:
Navigate to Config>Environmental Settings>YARA Rule Upload.
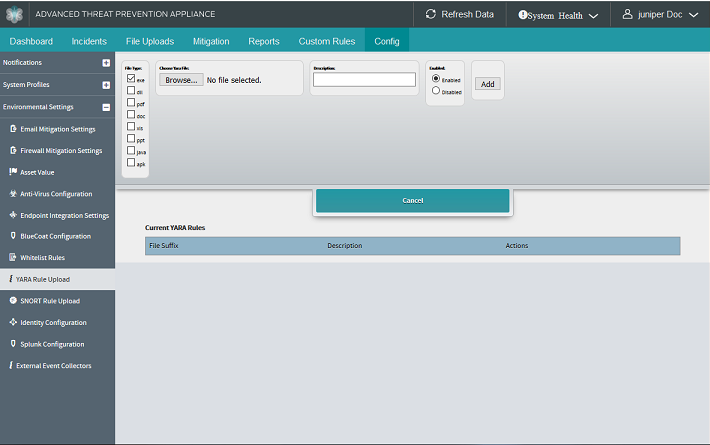
-
Select a File Type: exe | dll | pdf | doc | xls | ppt | java | apk
-
Click Choose File to browse and upload the YARA file.
-
Enter a Description.
-
Click the radio button to Enable or Disable.
-
If enabling, the Add button will display; click Add to initiate the YARA rule compiling and syntax validation. If there are no syntax errors, the YARA rule is added to the detection system.
Upload one rule at a time. However, one rule file may contain multiple rules.
Once a YARA rule is compiled and added to the system, network objects are scanned for any rule matches. Rule matches contribute to threat detection and are recognized as malware on the Web UI Incidents page.
Reviewing YARA Rule Malware Detection
There are several locations on the Incidents page where YARA rule matching is displayed as malware.
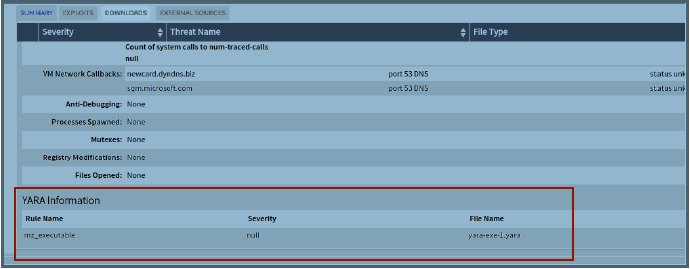
Configuring Identity
Identity configuration options allow for the import of Active Directory identity information sent to Juniper ATP Appliance via Splunk ingestion. This feature supplements Juniper ATP Appliance’s existing support of direct log ingestion to a Juniper ATP Appliance Core, adding the Splunk forwarding options for enterprises that use Splunk deployments for log and event handling.
See Also: .
In previous releases, Identity information was available directly from Active Directory.
You will need to perform several configurations:
-
Configure Splunk from the Juniper ATP Appliance Web UI Juniper ATP Appliance Config>Environmental Settings>Splunk Integration.
-
Configure Carbon Black Response from the Juniper ATP Appliance Config>Environmental Settings>External Event Collectors.
-
Configure Identity for AD and Splunk from the Juniper ATP Appliance Config>Environmental Settings>Identity Configurations page in the next section, below:
- Setting Identity Configuration for Splunk
- Setting Identity Configuration for Active Directory
- Active Directory Log Ingestion
- Splunk Universal Forwarder of Active Directory Logs
- Splunk WMI Forwarding of Active Directory Logs
Setting Identity Configuration for Splunk
To configure ATP Appliance Splunk Ingestion, perform the following steps.
-
Navigate to the Juniper ATP Appliance Central Manager Web UI Config>Environmental Settings>Splunk Configuration page; click Add New Identity Source.
Figure 34: Identity Configuration Page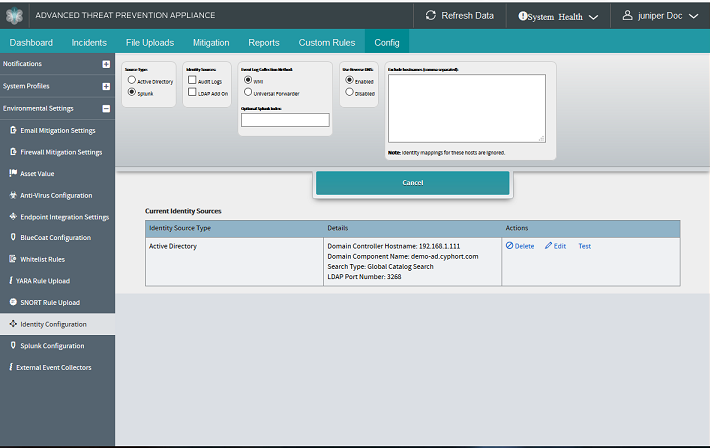
-
Select Splunk as the Source Type.
-
Select an Identity Source: Audit Logs or LDAP Add-on.
-
Select an Event Log Collection Method: WMI or Universal Forwarder.
-
Enter an Optional Splunk Index.
-
Select Enable or Disable for the Use Reverse DNS setting.
-
Enter Exclude Hostnames, separated by commas. Identity mappings for these hosts are ignored and not included in event handling and displays.
-
Click Submit to complete the configuration.
Setting Identity Configuration for Active Directory
-
Navigate to the Juniper ATP Appliance Central Manager Web UI Config>Environmental Settings>Splunk Configuration page; click Add New Identity Source.
-
Select Active Directory as the Source Type.
-
Enter a Hostname/IP Address.
-
Enter a Username and Password.
-
Enter a Search Type: Global Catalog Search or Local Search.
-
Select Enable or Disable for the Use Reverse DNS setting.
-
Enter a Domain Component Name.
-
Select an SSL setting: Enabled or Disabled.
-
Enter an LDAP Port Number.
Note:Typically used port numbers: Global Catalog Search [SSL Enabled - 3289; SSL Disabled - 3268]; Local Search [SSL Enabled - 636; SSL Disabled - 389]
-
Choose to Enable or Disable the Use Reverse DNS setting.
-
Enter Exclude Hostnames, separated by commas. Identity mappings for these hosts are ignored and not included in event handling and displays.
-
Click Submit to complete the configuration.
Active Directory Log Ingestion
The Juniper ATP Appliance supports AD log ingestionas via Splunk using either its Universal Forwarder on DC or the VMI method.
IMPORTANT: A few notices before you begin:
-
Active Directory, Splunk and Juniper ATP Appliance all need to be NTP-synced.
-
AD log ingestion can only be either Direct or via Splunk at a time.
-
In AD logs via Splunk, the “Exclude hostname” configuration in the UI should be set to indeed exclude the hostname.
-
If your enterprise environment has not previously employed AD-Splunk integration, and this is a first-time deployment, Juniper ATP Appliance supports both the WMI method and the Universal Forwarder method, and does not recommend one over the other. However, Splunk documentation recommends the Universal Forwarder for Domain Controllers because there have been performance issues reported for the WMI method.
Splunk Universal Forwarder of Active Directory Logs
To configure Splunk for AD using the Splunk App on DC, use the following procedure:
-
Install an Add-On for receiving security audit logs;
Review this link to determine which infrastructure Add-On to install:
Review this link to learn more about Splunk deployment options:
Deployment Options:
-
Splunk App for Windows Infrastructure (for receiving Security Audit logs) on Search Head
-
Splunk Add On for Active Directory (for ldap search) on Search Head
-
Splunk Add On for Windows on Search Head, Indexer and Universal Forwarder
-
-
Configure Active Directory Add On from the Splunk Web Console, as shown below:
Figure 35: Splunk Add-on Configuration for Receiving & Forwarding AD Security Audit Logs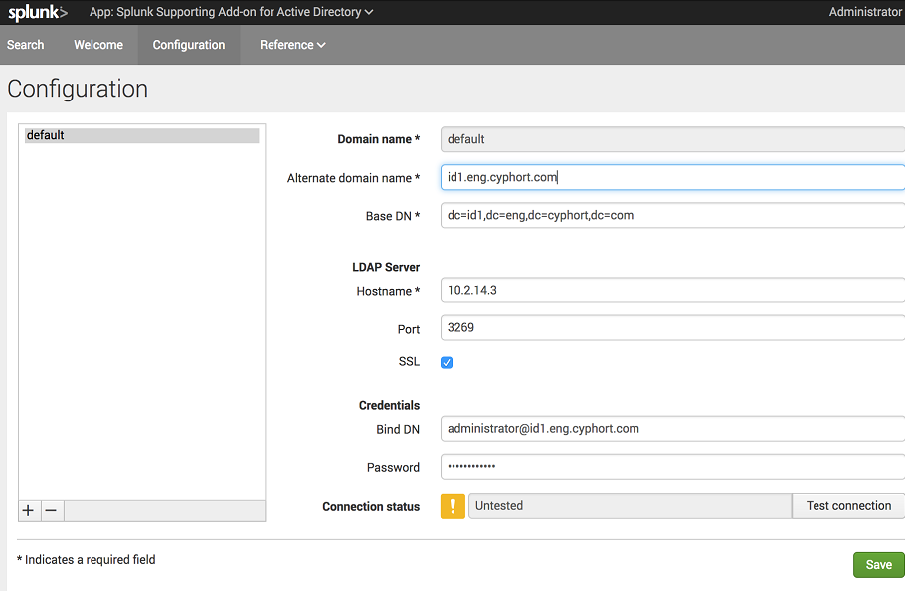
-
Configure the Splunk Indexer to receive Windows Data by navigating to Settings>Forward And Receiving (Data)->Configure Receiving->New
Figure 36: Splunk Add New Forwarding & Receiving Data Configuration Window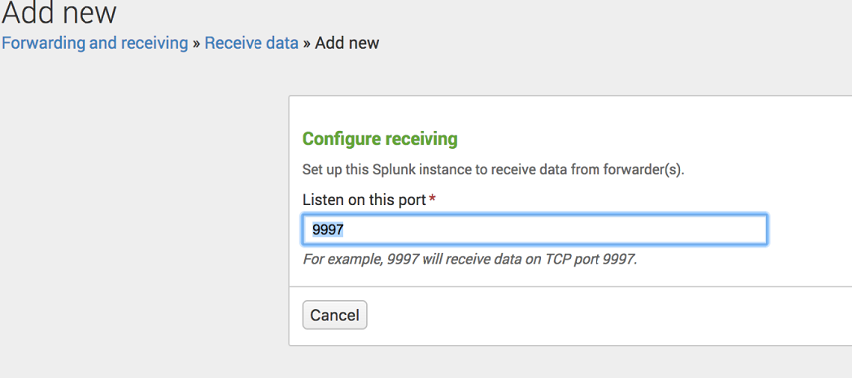
-
Deploy Splunk App for Windows Infrastructure; use the following linked instructions:
http://docs.splunk.com/Documentation/MSApp/1.4.1/MSInfra/InstallaSplunkIndexer
Note:Download and install the Universal Forwarder on the Domain Controller with information from the following links.
The Universal Forwarder is one method for sending event logs to Splunk Indexer; the other method is Agentless forwarding using the WMI method, shown in the next section ).
-
Download the Universal Forwarder: https://www.splunk.com/en_us/download/universal-forwarder.html
-
Download the MSI and start the installation. Configure the Universal Forwarder with instructions from this link:
Click on the Customize option after selecting the appropriate checkboxes as shown in the image below:
Click Next and then choose Local Account unless you want to poll other domain controllers using WMI. Click Next again.
In the next configuration window, shown below, select the Security Log forwarding option. Click Next.
Enter the Deployment Server Hostname and Port (default is 8089), then click Next.
Enter the Receiver Index and Port (default is 9997), as in the example shown below, and then click Next.
-
-
Follow instructions to Get Active Directory Data from this link: http://docs.splunk.com/Documentation/MSApp/1.4.1/MSInfra/DownloadandconfiguretheSplunkAddonsforActiveDirectory
-
Configure GPO’s for AD and Powershell.
-
Download Splunk Add On For Microsoft Active Directory.
-
Download Splunk Add On for Microsoft Powershell.
-
Un-TAR both downloaded TAR files using 7zip or another archive utility.
-
Copy the resulting SA-ModularInput-PowerShell and Splunk_TA_microsoft_ad to the Universal Forwarder installed path:
C:\Program Files\SplunkUniversalForwarder\etc\apps
-
Restart Universal Forwarder components:
-
services.msc
-
Find SplunkForwarder Service and restart it.
-
-
Verify Splunk Search Head is receiving data by performing one of the following procedures:
-
Search the UI at App & Reporting > Data Summary to verify that the Domain Controller Host is configured.
-
Or search using “source="wineventlog:security" AND EventCode=4769 AND Service_Name != krbtgt | table _time Account_Name Client_Address Service_Name | rename _time as Logon_Time Account_Name as UserName Client_Address as IPAddress Service_Name as HostName”
-
-
Configure Splunk App for Windows Infrastructure on the Splunk Web Indexer; note the prerequisites:
Give winfra-admin role to admin user by modifying the roles for admin user as shown below:
Splunk WMI Forwarding of Active Directory Logs
Use the following procedure to setup AD Integration with Splunk using the WMI method.
Setup requirements for the Splunk Server are also available from this link: http://docs.splunk.com/Documentation/Splunk/6.6.0/Data/MonitorWMIdata
-
Both Splunk Enterprise and your Windows network must be correctly configured for WMI data access. Review the following prerequisites before attempting to use Splunk Enterprise to get WMI data.
Before Splunk Enterprise can get WMI-based data:
-
Splunk Enterprise must be installed with a user that has permissions to perform remote network connections. While installing Splunk it would ask for local account or domain account. Choose domain account.
-
The user Splunk Enterprise runs as must be a member of an Active Directory (AD) domain or forest and must have appropriate privileges to query WMI providers.
-
The Splunk user must also be a member of the local Administrators group on the computer that runs Splunk Enterprise.
-
The computer that runs Splunk Enterprise must be able to connect to the remote machine(AD) and must have permissions to get the desired data from the remote machine once it has connected.
-
-
After installing Splunk, logon to Splunk and navigate to Settings -> Data Inputs:
Click on the second option - Remote Event Log Collection, then click on New.
-
Choose a name for the log collection and enter the AD server IP address.
If Splunk can perform a WMI query to the AD server, then the Select Event Logs option is displayed, as shown below; Choose Security and click Next.
-
Enter the host details on the next page. If you want to choose an indexer, choose it or leave the default.
Review configurations and Submit.
-
From the Splunk Server, navigate to C:\Program Files\Splunk\etc\system\local and add the following configuration:
[WinEventLog://Security]
disabled = 0
start_from = oldest
current_only = 0
evt_resolve_ad_obj = 1
checkpointInterval = 5
Restart Splunk and verify that all Active Directory Security Logs are available in Splunk.
Configuring Active Directory
Endpoint Identity integration supports Email and HTTP incident correlations. In turn, Email Correlation is integrated with Juniper ATP Appliance’s east-west enterprise-wide lateral detection framework. The Juniper ATP Appliance supports remote authentication to Active Directory (AD) servers in customer networks. With AD and endpoint identity integration, lateral spread detections display the endpoint hostname as the node name (instead of host IP address) if it’s available.
Active Directory configuration is required for the Identity feature to work.
See Also: Configuring Identity.
See also AD Domain Controller Configuration Requirements and Tips and Troubleshooting Active Directory.
Active Directory configuration is described in the following consecutive sections:
Part 1 - Obtaining a Domain Component Name for a Domain Controller
This Part1 section describes how to obtain the domain component name required to configure AD from an Active Directory Domain Controller. Perform these steps before configuring the AD Domain Controller integration from the Juniper ATP Appliance Central Manager Web UI described in Part 2.
Prerequisites for Active Directory Integration
Adhere to the following requirements before configuring AD integration:
-
A configured user for AD must have Administrator privileges because both Windows Management Instrumentation (WMI) and LDAP searches require Admin credentials. The AD user can be a “read only” Admin user, but does need to have following permissions:
-
The user account must belong to the “Distributed COM Users” Active Directory group.
-
The user account must have permission to access WMI namespaces (CIMV2 namespace) on the Domain Controller machine.
-
The user account must have permission to read the security event log on the domain controller machine.
-
-
Active Directory Domain Controller and the Juniper ATP Appliance Core/CM must be synced to an NTP server, because Juniper ATP Appliance queries the AD based within a specified time period (ranging from the current time to 5 minutes).
-
If the AD Domain Controller is behind a firewall then be sure to open up the firewall to allow the Juniper ATP Appliance Core/CM device to reach the AD.
-
Open the firewall for the port numbers required for LDAP Search and WMI query.
-
LDAP Search default port number
-
For Local Search:Port 389 (non SSL), Port 636 (SSL).
-
For Global Catalog Search:Port 3268 (non SSL), Port 3269 (SSL).
Note:For SSL mode Customer should install Active Directory Certificate Services and install a certificate. Domain Controller Server should be restarted after this as LDAPS doesn't work without restart.
-
-
WMI uses TCP port 135 for initial connection. If the core is behind a firewall then customer needs to open up the firewall for port 135 and must also:
-
Either tie WMI to a fixed port and open up the firewall for the fixed port as well. This fixed port will be used for WMI data exchange.
Note:You can find instructions for tying WMI to a fixed port at this URL: https://msdn.microsoft.com/en-us/library/bb219447(VS.85).aspx
Also check if windows firewall is opened up for fixed port.
-
Or On the firewall, open up the port range 49152 - 65535 because DCOM might use any of the ports within this range.
-
-
-
Ensure that the Audit policy on AD allows successful logons to generate the necessary events, specifically a Kerberos event type with the event code 4769.
-
Be sure to configure the Windows Security Log Property "Overwrite events as needed (oldest event first)" option, for the maximum log file size, because Juniper ATP Appliance scrapes these logs for Identity (security logs must be running logs in order for Juniper ATP Appliance to obtain Identity information).
Also setup a non-Admin user in order to query the Domain Controller Event Log for Windows 2008 and Windows 2012.
The Juniper ATP Appliance Core queries the Domain Controller event log to obtain the host-to-IP mapping. Be sure to configure the Juniper ATP Appliance Core/CM to query the Domain Controller with a user who is part of the Domain Administrator group. This may be restrictive and potentially risky to administrators.
An AD Agent running on the Juniper ATP Appliance Core does not need an Admin user because it uses WMI to query the Active Directory Domain Controllers for the Security Event logs. Juniper ATP Appliance also uses Distributed COM (DCOM) technology to handle its remote calls to the domain controller. For a non-admin user, be sure to set the following permissions in order to allow to querying the DC:
-
DCOM permission (this should belong to the Distributed COM Users AD group).
-
WMI permission to access WMI namespaces (CIMV2 namespace) on the domain controller device.
-
Permission to read the security event log on the domain controller device.
Creating a Domain User or Group
To create a Domain User or Group, add the new user/group to a domain Builtin Group: “Distributed COM Users” and “Event Log Readers” using the Active Directory Users and Computers window options, as shown below.
Next, set the User/Group WMI permissions.
-
Run the Windows Management Instrumentation (WMI) console.
-
Select Start, click Run, and then type:
wmimgmt.msc -
Click OK and press Enter.
-
Right-click "WMI Control" and select "Properties".
-
Select the Security tab, and then expand "Root".
-
Select "CIMV2" and then click "Security".
Figure 38: Windows Management Instrumentation (WMI) Console Settings -
Add the domain user that you've created to work with the AD Domain Controller. Set the "Enable Account" and "Remote Enable" permissions to the user.
Figure 39: WMI Console Settings for Security for ROOT\CIMV2 -
Click "Advanced". Select the domain user and check that “Apply to” is set to "this namespace and subnamespaces".
Figure 40: WMI Console Advanced Security Settings for CIMV2 -
Select OK to save changes.
Figure 41: Finalizing the WMI Console Advanced Security Settings
Next, obtain the Domain Component Name for the Domain Controller.
-
Navigate to the AD Server.
-
Run “Administrative Tools.”
-
Run "Active Directory Users and Computers"
-
Click on "Active Directory Users and Computers" and on the right side locate the Name (for example:
pod001.eng.JATP.comis displayed as the Domain Component Name in the sample screenshot below). -
You will use this exact same domain component name from Step 4; take note so that you can add it to the Domain Component field on Juniper ATP Appliance’s Active Directory Configuration Page (described in Part 2 below Part 2 - Configuring an Active Directory Domain Controller from the Web UI).
Next, test the Local WMI services.
-
Click Start, click Run, type
wmimgmt.msc, and then click OK. -
Right-click WMI Control (Local), and then click Properties.
-
If the WMI service is configured correctly, the WMI Control will connect to WMI and display the Properties dialog box. On the General tab, you should see information about the operating system and the version of WMI.
Now, verify WMI permissions:
-
On the AD computer, click Start, click Run, type
wmimgmt.msc, and then click OK. -
Right-click WMI Control, and then click Properties.
-
On the Security tab, expand Root, and then click WMI.
-
Click Security in the results pane to see the permissions. If the user does not have permission, then set permissions.
Next, verify the LDAP SSL connection. After a certificate is installed, follow these steps to verify that LDAP is enabled:
-
Start the Active Directory Administration Tool (Ldp.exe).
Note:The Active Directory Administration Tool program is installed in the Windows 2000 Support Tools area.
-
On the Connection menu, click Connect.
-
Type the name of the domain controller to which you want to connect.
-
Type 636 as the port number.
-
Click OK.
-
Proceed to Part 2 - Configuring an Active Directory Domain Controller from the Web UI.
Part 2 - Configuring an Active Directory Domain Controller from the Web UI
To configure an Active Directory Domain Controller, perform the following steps.
-
Navigate to the Juniper ATP Appliance Central Manager Web UI Config>Environmental Settings>Active Directory Configuration page.
-
Click the Add New AD Domain Controller button. AD Domain Controller Configuration Requirements and Tips.
-
Enter the AD Domain Controller Hostname/IP.
-
Enter the AD Server User’s User Name and Password.
-
Choose a Search Type option: Global Catalog Search or Local Search.
Global search is a search of the entire AD database. Local Search is a search configured to be specific to a certain domain component, such as the finance department, for example,
-
Enter the AD Domain Controller Domain Component Name if the Local Search option is selected. For both Local and Global Search, the AD Domain Controller Domain Component Name is required (not optional).
-
Choose an SSL status: Enabled or Disabled.
-
Enter an LDAP Port Number.
-
Click Submit. The Current AD Domain Controller table lists the new AD Controller.
-
To edit the AD Controller settings, click Edit in the Current AD Domain Controller table. To delete the AD Controller settings, click Delete in the Current AD Domain Controller table.
Note:The typically used AD Domain Controller LDAP Port Numbers for Global Catalog Search are SSL Enabled 3269; SSL Disabled 3268. The typically used AD Domain Controller LDAP Port Numbers for Local Search are SSL Enabled 636; SSL Disabled 389.
To test the connection, click the Test link in the Current AD Domain Controller table:
A system message will display the results of the WMI and LDAP connection to the AD Domain Controller.
- AD Domain Controller Configuration Requirements and Tips
- Configuration Requirements and Tips
- Troubleshooting Active Directory
AD Domain Controller Configuration Requirements and Tips
Juniper ATP Appliance polls the AD Domain Controller every 5 minutes to get the Identity data from AD. Identity data is retrieved from AD’s Security event logs using WMI by querying logs for the event code 4769 and AD Datastore using LDAP search. Identity data includes mapping each authentication event, endpoint host name, endpoint IP address, username used to login into the endpoint and user's email address. Multiple AD domain controllers can be configured and polled in 5 minute intervals.
Configuration Requirements and Tips
Review the following list of AD Domain Controller requirements and suggested configuration settings:
-
A configured AD user must have administrator privileges. The AD account admin must (1) belong to the Distributed COM Users AD group, (2) the account must have permission to access WMI namespaces (CIMV2 namespace) on the domain controller device, (3) the account must have permission to read the security event log on the domain controller device.
-
The Active Directory Domain Controller and the Juniper ATP Appliance Core+CM must both be synced to an NTP server in order to optimize AD polling in 5 minute intervals.
-
If the Active Directory Domain Controller is behind a firewall, then the administrator must open up the firewall to allow the Juniper ATP Appliance Core+CM to reach the AD controller. Open the firewall for port numbers that are required for LDAP searches and WMI queries.
LDAP Search default port numbers:
-
For local search (of a specified domain component), use port numbers 389 for non-SSL and 636 for SSL.
-
For a global search (of a specified domain component), use port numbers 3268 for non-SSL and 3269 for SSL.
Note:For SSL mode, be sure to install “Active Directory Certificate Services” and install a certificate. The AD Domain Controller Server should be restarted after installing the certificate because LDAP will not work without the restart.
-
-
WMI uses TCP port 135 for the initial connection. If the Core+CM is behind a firewall, then the administrator must open up the firewall for port 135 and then also:
-
EITHER, tie the WMI to a fixed port and open up the firewall to the fixed port as well. Port 135 is used for the initial connection handshake. The fixed port is used for WMI data exchange.
-
Instructions to tie WMI to a fixed port are available at: https://msdn.microsoft.com/en-us/library/bb219447(VS.85).aspx
-
Also check to be sure the windows firewall is opened up for the fixed port.
-
-
OR, On the firewall, open up the port range 49152 - 65535 (because DCOM might use any of the port from this range).
-
-
Ensure that the Audit Policy on the AD domain controller allows successful logons, particularly Kerberos event types with the event code 4769.
-
Configure the Windows Security Log Property setting: “Overwrite events as Needed (oldest event first)”; select the maximize file size for full identity polling coverage.
Refer also to Prerequisites for Active Directory Integration for information about setting up a nonadmin user to query the Domain Controller Event Log for Windows 2008 and Windows 2012.
Troubleshooting Active Directory
This section provides information about determining whether the Active Directory Domain Controller integration is working.
-
Run the “setupcheck all” command from the Juniper ATP Appliance CLI or click Test button option in the Current AD Domain Controller window located in the Config>Environmental Settings>Active Directory Configuration page to check if Active Directory integration is working.
-
If the Active Directory Domain Controller integration is not working:
-
The AD Agent will still send a Health Alert every 1 hour.
-
The AD Agent will also send GSS an Alert if the AD is unreachable for some reason.
-
An AD Agent may not be able to get Identity information for the following reasons:
-
Active Directory Domain Controller not reachable (connectivity issue or it’s down)
-
A Query on the Active Domain Controller takes a longer time to finish (the controller may be slow due to memory or CPU issues).
-
Network Latency may be too high.
Configuring Custom SNORT Rules
Juniper ATP Appliance users can upload SNORT Rules from the Central Manager Web UI Config Tab to be matched against network traffic monitored by Juniper ATP Appliance Collectors, with match results displayed in the Central Manager Custom Rules Tab. Juniper ATP Appliance correlates triggered rules with incidents that were active at the time of the trigger and the results are displayed on the Incidents Tab.
Sample Snort Rules
alert tcp !172.16.254.0/24 any -> 172.16.45.100 !80 ( \
msg:"Access Alert - NON Web traffic to Host 45.100 from unauthorized source.
Only mgmt net 172.16.45.0 allowed."; \
flags:S; \
classtype: policy-violation; \
sid:5100001; \
rev:1; \
)
alert tcp !172.16.254.0/24 any -> 172.16.45.100 80 ( \
msg:"Web Alert - NON GET request found Host 45.100 Methods other than GET from
non-mgmt net not allowed."; \
content:!"GET"; \
http_method; \
classtype: web-application-activity; \
sid:5500001; \
rev:1; \
)
alert tcp any any -> 172.16.45.100 80 ( \
msg:"Web Alert - php request on Host 45.100. No php files on server."; \
content:"GET"; \
pcre:"/GET.*\.php/i"; \
classtype: web-application-activity; \
sid:5500002; \
rev:1; \
)
alert tcp 172.16.254.0/24 any -> 172.16.45.100 80 ( \
msg:"Web Alert - MGMT POST to NON form_posting uri. "; \
content:"POST"; \
pcre:!"/POST.*\form_posting/i"; \
classtype: web-application-activity; \
sid:5500003; \
rev:1; \
)
To upload a SNORT Rule file:
-
Navigate to the Juniper ATP Appliance Central Manager Web UI Config>Environmental Settings>Snort Rule Upload page.
Figure 45: Juniper ATP Appliance Central Manager SNORT Rules Upload Page -
Click the Add SNORT Rules button.
-
Click Choose File and browse to select your custom SNORT file for upload to the Juniper ATP Appliance system.
-
Enter a description for the SNORT rule in the Description field, then click Add.
-
To edit or delete a custom SNORT Rule, click the Delete or Edit link in the Current SNORT Rules table Actions column:
Setting ATP Appliance Identity Configurations
Identity configuration options allow for the import of Active Directory identity information sent to Juniper ATP Appliance via Splunk ingestion. This feature supplements Juniper ATP Appliance’s existing support of direct log ingestion to a Juniper ATP Appliance Core, adding the Splunk forwarding options for enterprises that use Splunk deployments for log and event handling.
You will need to perform several configurations:
-
Configure Splunk from the Juniper ATP Appliance Web UI Juniper ATP Appliance Config>Environmental Settings>Splunk Integration.
-
Configure Carbon Black Response from the Juniper ATP Appliance Config>Environmental Settings>External Event Collectors.
-
Configure Identity for AD and Splunk from the Juniper ATP Appliance Config>Environmental Settings>Identity Configurations page in the next section, below:
- Setting Identity Configuration for Splunk
- Setting Identity Configuration for Active Directory
- Active Directory Log Ingestion
- Splunk Universal Forwarder of Active Directory Logs
- Splunk WMI Forwarding of Active Directory Logs
Setting Identity Configuration for Splunk
To configure ATP Appliance Splunk Ingestion, perform the following steps.
-
Navigate to the Juniper ATP Appliance Central Manager Web UI Config>Environmental Settings>Splunk Configuration page; click Add New Identity Source.
-
Select Splunk as the Source Type.
-
Select an Identity Source: Audit Logs or LDAP Add-on.
-
Select an Event Log Collection Method: WMI or Universal Forwarder.
-
Enter an Optional Splunk Index.
-
Select Enable or Disable for the Use Reverse DNS setting.
-
Enter Exclude Hostnames, separated by commas. Identity mappings for these hosts are ignored and not included in event handling and displays.
-
Click Submit to complete the configuration.
Setting Identity Configuration for Active Directory
-
Navigate to the Juniper ATP Appliance Central Manager Web UI Config>Environmental Settings>Splunk Configuration page; click Add New Identity Source.
-
Select Active Directory as the Source Type.
-
Enter a Hostname/IP Address.
-
Enter a Username and Password.
-
Enter a Search Type: Global Catalog Search or Local Search.
-
Select Enable or Disable for the Use Reverse DNS setting.
-
Enter a Domain Component Name.
-
Select an SSL setting: Enabled or Disabled.
-
Enter an LDAP Port Number.
Note:Typically used port numbers: Global Catalog Search [SSL Enabled - 3289; SSL Disabled - 3268]; Local Search [SSL Enabled - 636; SSL Disabled - 389]
-
Choose to Enable or Disable the Use Reverse DNS setting.
-
Enter Exclude Hostnames, separated by commas. Identity mappings for these hosts are ignored and not included in event handling and displays.
-
Click Submit to complete the configuration.
Active Directory Log Ingestion
Juniper ATP Appliance’s support of Direct Ingestion of Active Directory (AD) Logs is not a new feature and has been available for many Juniper ATP Appliance product release versions. The Juniper ATP Appliance also supports AD log ingestionas via Splunk using either its Universal Forwarder on DC or the WMI method.
IMPORTANT: A few notices before you begin:
-
Active Directory, Splunk and Juniper ATP Appliance all need to be NTP-synced.
-
AD log ingestion can only be either Direct or via Splunk at a time.
-
In AD logs via Splunk, the “Exclude hostname” configuration in the UI should be set to exclude the hostname of AD.
-
If your enterprise environment has not previously employed AD-Splunk integration, and this is a first-time deployment, Juniper ATP Appliance supports both the WMI method and the Universal Forwarder method, and does not recommend one over the other. However, Splunk documentation recommends the Universal Forwarder for Domain Controllers because there have been performance issues reported for the WMI method.
Splunk Universal Forwarder of Active Directory Logs
To configure Splunk for AD using the Splunk App on DC, use the following procedure:
-
Install an Add-On for receiving security audit logs;
Review this link to determine which infrastructure Add-On to install:
Review this link to learn more about Splunk deployment options:
Deployment Options:
-
Splunk App for Windows Infrastructure (for receiving Security Audit logs) on Search Head
-
Splunk Add On for Active Directory (for ldap search) on Search Head
-
Splunk Add On for Windows on Search Head, Indexer and Universal Forwarder
-
-
Configure Active Directory Add On from the Splunk Web Console, as shown below:
Figure 46: Splunk Add-on Configuration for Receiving & Forwarding AD Security Audit Logs -
Configure the Splunk Indexer to receive Windows Data by navigating to Settings>Forward And Receiving (Data)->Configure Receiving->New
Figure 47: Splunk Add New Forwarding & Receiving Data Configuration Window -
Deploy Splunk App for Windows Infrastructure; use the following linked instructions:
http://docs.splunk.com/Documentation/MSApp/1.4.1/MSInfra/InstallaSplunkIndexer
Note:Download and install the Universal Forwarder on the Domain Controller with information from the following links.
The Universal Forwarder is one method for sending event logs to Splunk Indexer; the other method is Agentless forwarding using the WMI method, shown in the next section Splunk WMI Forwarding of Active Directory Logs).
-
Download the Universal Forwarder: https://www.splunk.com/en_us/download/universal-forwarder.html
-
Download the MSI and start the installation. Configure the Universal Forwarder with instructions from this link:
Click on the Customize option after selecting the appropriate checkboxes as shown in the image below:
Click Next and then choose Local Account unless you want to poll other domain controllers using WMI. Click Next again.
In the next configuration window, shown below, select the Security Log forwarding option. Click Next.
Enter the Deployment Server Hostname and Port (default is 8089), then click Next.
Enter the Receiver Index and Port (default is 9997), as in the example shown below, and then click Next..
-
-
Follow instructions to Get Active Directory Data from this link:
-
Configure GPO’s for AD and Powershell.
-
Download Splunk Add On For Microsoft Active Directory.
-
Download Splunk Add On for Microsoft Powershell.
-
Un-TAR both downloaded TAR files using 7zip or another archive utility.
-
Copy the resulting SA-ModularInput-PowerShell and Splunk_TA_microsoft_ad to the Universal Forwarder installed path:
C:\Program Files\SplunkUniversalForwarder\etc\apps
-
Restart Universal Forwarder components:
-
services.msc
-
Find SplunkForwarder Service and restart it.
-
-
Verify Splunk Search Head is receiving data by performing one of the following procedures:
-
Search the UI at App & Reporting > Data Summary to verify that the Domain Controller Host is configured.
-
Or search using “source="wineventlog:security" AND EventCode=4769 AND Service_Name != krbtgt | table _time Account_Name Client_Address Service_Name | rename _time as Logon_Time Account_Name as UserName Client_Address as IPAddress Service_Name as HostName”
-
-
-
Configure Splunk App for Windows Infrastructure on the Splunk Web Indexer; note the prerequisites:
-
Give winfra-admin role to admin user by modifying the roles for admin user as shown below:
-
Splunk WMI Forwarding of Active Directory Logs
Use the following procedure to setup AD Integration with Splunk using the WMI method.
Setup requirements for the Splunk Server are also available from this link:
http://docs.splunk.com/Documentation/Splunk/6.6.0/Data/MonitorWMIdata
-
Both Splunk Enterprise and your Windows network must be correctly configured for WMI data access. Review the following prerequisites before attempting to use Splunk Enterprise to get WMI data.
Before Splunk Enterprise can get WMI-based data:
-
Splunk Enterprise must be installed with a user that has permissions to perform remote network connections. While installing Splunk it would ask for local account or domain account. Choose domain account.
-
The user Splunk Enterprise runs as must be a member of an Active Directory (AD) domain or forest and must have appropriate privileges to query WMI providers.
-
The Splunk user must also be a member of the local Administrators group on the computer that runs Splunk Enterprise.
-
The computer that runs Splunk Enterprise must be able to connect to the remote machine(AD) and must have permissions to get the desired data from the remote machine once it has connected.
-
-
After installing Splunk, logon to Splunk and navigate to Settings -> Data Inputs:
-
Click on the second option - Remote Event Log Collection, then click on New.
-
Choose a name for the log collection and enter the AD server IP address.
-
If Splunk can perform a WMI query to the AD server, then the Select Event Logs option is displayed, as shown below; Choose Security and click Next.
-
Enter the host details on the next page. If you want to choose an indexer, choose it or leave the default.
Review configurations and Submit.
-
From the Splunk Server, navigate to C:\Program Files\Splunk\etc\system\local and add the following configuration:
[WinEventLog://Security]
disabled = 0
start_from = oldest
current_only = 0
evt_resolve_ad_obj = 1
checkpointInterval = 5
-
Restart Splunk and verify that all Active Directory Security Logs are available in Splunk.
Carbon Black Response - Splunk Integration
Use the following information to perform Carbon Black Response and Splunk integration using either:
-
Carbon Black Response Direct Log Ingestion: Event Forwarder of JSON Logs
-
Carbon Black Response Ingestion Reporting at Juniper ATP Appliance
IMPORTANT: A few notices about Carbon Black Response and Splunk integration:
-
Juniper ATP Appliance requires Active Directory (AD) data for correlation with Carbon Black logs.
-
AD, Splunk and Juniper ATP Appliance must be NTP-synced.
-
Currently, form Carbon Black, only watchlist alert events are consumed by Juniper ATP Appliance:
-
alert.watchlist.hit.ingress.host
-
alert.watchlist.hit.ingress.binary
-
alert.watchlist.hit.ingress.process
-
alert.watchlist.hit.query.binary
-
alert.watchlist.hit.query.process
-
-
Correlation between Juniper ATP Appliance and Carbon Black Response is within 5 minutes.
-
The endpoint hostname is the only match for correlating Carbon Black Response and Juniper ATP Appliance events.
-
With Carbon Black Response Event Forwarder, there is an option to forward logs in JSON or LEEF format; Juniper ATP Appliance supports JSON format only at this time for both Splunk and Direct Log ingestion.
-
For Direct Log Ingestion, logs can be sent to any random Juniper ATP Appliance port.
-
The difference between Carbon Black Response integration and Carbon Black Direct Log Ingestion:
-
During Carbon Black Response integration, Juniper ATP Appliance queries for only those events detected by Juniper ATP Appliance to obtain confirmation about the endpoint execution.
-
In CB Log Ingestion, all events irrespective of whether Juniper ATP Appliance has seen it or not is pulled.
-
If a CB event is correlated in CB log ingestion, then we don’t mark the EX Progression.
-
- Carbon Black Response Direct Log Ingestion: Event Forwarder of JSON Logs
- Carbon Black Response Integration via Splunk Forwarder
- Carbon Black Response Ingestion Reporting at Juniper ATP Appliance
Carbon Black Response Direct Log Ingestion: Event Forwarder of JSON Logs
-
Install the Carbon Black Response Event Forwarder : https://developer.carbonblack.com/reference/enterprise-response/event-forwarder/
-
To send the Carbon Black Response event logs to any server via TCP or UDP, edit the Event Forwarder CONF file as in the example shown below:
In
/etc/cb/integrations/event-forwarder/cb-event-forwarder.confrabbit_mq_username=cb rabbit_mq_password=<password> cb_server_hostname=127.0.0.1
Take the username & password for the above from /etc/cb/cb.conf, search for RabbitMQUser & RabbitMQPassword and copy the value from the above file.
In
/etc/cb/integrations/event-forwarder/cb-event-forwarder.conf
Search for and enter the values shown below:
output_type=tcp or udp
output_format=json
If the TCP option is selected, configure the tap server and the listening port. Currently, you can select any random port to listen to.
tcpout=10.2.9.35:10516
If udp option is selected above, then configure the tap server & the listening port. Currently you can select any random port to listen to:
udpout=10.2.9.35:10516
Next, run the below command to receive output indicating which server the event forwarder has connected to.
[root@scb ~]# /usr/share/cb/integrations/event-forwarder/cb-event-forwarder -check
2017/05/08 03:42:38 Connected to tcp:10.2.9.35:10516 at 2017-05-08 03:42:38.068386476 -0700 PDT.
2017/05/08 03:42:38 Initialized output: tcp:10.2.9.35:10516
Start the event-forwarder:
[root@cb]# initctl start cb-event-forwarder
Carbon Black Response Integration via Splunk Forwarder
-
From the Carbon Black Response Server, install the Carbon Black Response Event Forwarder:
https://developer.carbonblack.com/reference/enterprise-response/event-forwarder/
-
Download the relevant binaries from this link:
https://www.splunk.com/en_us/download/universal-forwarder.html
-
Install Splunk Add on for Bit9 Carbon Black to your Splunk instance. Set the Splunk Common Information Model.
-
Configure the Carbon Black Response Event Forwarder; this is required to save the Carbon Black Response event logs to a file using the contents to forward data to Splunk.
In
/etc/cb/integrations/event-forwarder/cb-event-forwarder.confrabbit_mq_username=cb rabbit_mq_password=<password> cb_server_hostname=127.0.0.1
Apply the username and password shown above from /etc/cb/cb.conf, search for RabbitMQUser and RabbitMQPassword, and copy the value to the above CONF file.
In
/etc/cb/integrations/event-forwarder/cb-event-forwarder.confSearch & enter the values below:
output_type=file
output_format=json
outfile=/var/cb/data/event-forwarder/data.json
The above outfile can be anything; in this example, the link stores the event logs.
Run the command below to get the output shown below.
[root@cb]# /usr/share/cb/integrations/event-forwarder/cb-event-forwarder -check
2017/04/20 02:42:58 Initialized output: File /var/cb/data/event-forwarder/data.json
Start the event-forwarder:
[root@cb]# initctl start cb-event-forwarder
-
Configure the Splunk Add on for Bit 9 Carbon Black Response.
Set the Splunk Common Information Model as shown below:
Configure the Receiver for your Splunk Instance to set the Splunk Forwarder to forward data; Navigate to Splunk > Settings > Forwarding & Receiving.
Click on Configure Receiving.
Configure a port to listen on. In this example: port 6666.
-
Set up the Splunk Universal Forwarder to forward Carbon Black Response data to Splunk by downloading and installing the Universal Forwarder RPM on the Carbon Black Response server:
https://www.splunk.com/en_us/download/universal-forwarder.html
rpm -ivh splunkforwarder-6.5.3-36937ad027d4.i386.rpm
[root@cb]# cd /opt/splunkforwarder/bin
[root@cb]# ./splunk
Data forwarding configuration management tools.
Commands:
enable local-index [-parameter <value>] ...
disable local-index [-parameter <value>] ...
display local-index
add forward-server server
remove forward-server server
list forward-server
Objects:
forward-server a Splunk forwarder to forward data to be indexed
local-index a local search index on the Splunk server
[root@cb bin]# ./splunk add forward-server 10.2.14.219:6666
In the above command 10.2.14.219 is the splunk server & 6666 is the port we have configured in Step 3 on which Splunk is receiving.
[root@cb local]# pwd
/opt/splunkforwarder/etc/system/local
[root@cb local]# cat inputs.conf
[default]
host = cbtest
[monitor:///var/cb/data/event-forwarder]
sourcetype = bit9:carbonblack:json
[root@cb local]
-
Add an input host file. In this example, cbtest is used, which can be searched for in Splunk.
The monitor is the directory of data.json, which is configured in Step 1.
The sourcetype shows which data needs to be sent, which is from Carbon Black Response.
[root@cb bin]# cd /opt/splunkforwarder/bin
[root@cb bin]# ./splunk start
-
Start Splunk.
-
Check the forward-server.
[root@cb bin]# ./splunk list forward-server
Splunk username: admin
Password:
Active forwards:
10.2.14.219:6666
Configured but inactive forwards:
None
[root@cb bin]#
Carbon Black Response Ingestion Reporting at Juniper ATP Appliance
Carbon Black Response log ingestion can be viewed from the Juniper ATP Appliance Central Manager Web UI Incidents page and Events Timeline Dashboard:
Configuring ATP Appliance Splunk Ingestion
Configure Splunk integration from the Juniper ATP Appliance Web UI as well as from the Splunk UI.
Juniper ATP Appliance Side - Splunk Integration Configuration
To configure ATP Appliance Splunk Ingestion, perform the following steps.
-
Navigate to the Juniper ATP Appliance Central Manager Web UI Config>Environmental Settings>Splunk Configuration page.
Figure 48: Splunk Ingestion Configuration Page -
Enter the Splunk Host IP address and Splunk Management Port number.
Note:Be sure to enter the Splunk port number 8089, not 8080.
-
Enter your Splunk Login and Password.
-
Click Enable to make the configuration active; deselect to disable the configuration.
-
Click Submit to activate an enabled Splunk configuration.
-
Test the Splunk Configuration Ingestion Settings by clicking the Test button.
Note:Splunk environments allow for implementation of multiple ports that are all user-configurable; be sure to configure the Splunk management port on this page if you are having trouble connecting to Splunk. Check your Splunk site for your settings if your admin is not using the defaults.
Splunk Side - Splunk Configuration
At the Splunk console, include the following settings for integration with Juniper ATP Appliance; in this example, the PAN Add-on is configured:


At the Splunk console, be sure PAN-Add-ons and Splunk Common Information Model is configured for Juniper ATP Appliance to talk to Splunk.
Integrating External Event Collectors
To setup ATP Appliance External Event Collectors, perform the following configurations per vendor option:
- ATP Appliance Firewall [PAN: Log Collector | Splunk Ingestion]
- PAN Log Collector Configuration - Juniper ATP Appliance Side
- PAN-Side Direct Ingestion Settings
- Direct Ingestion PAN Event Filtering
- PAN and Splunk Integration Configuration
- Splunk Side Configuration for PAN
- Splunk Integration Event Filtering
- Incident Reporting for PAN Syslog Ingestion
- ATP Appliance Web Gateway [Bluecoat: Log Collector | Splunk Ingestion]
- Configuring a Bluecoat Secure Web Gateway Log Collector
- Configuring Splunk to Bluecoat Integration
- Juniper ATP Appliance Side Configuration
- Bluecoat Side Configuration
- Splunk Side Configuration
- Configuring Bluecoat to Juniper ATP Appliance Integration
- Juniper ATP Appliance Side Setup
- Bluecoat Side Setup
- Configuring Bluecoat Secure Web Gateway Splunk Ingestion
- ATP Appliance Endpoint AV [ESET | McAfee ePO | Symantec: Log Collector | Splunk Ingestion]
- Configuring ESET Endpoint AV Log Collection
- Configuring McAfee ePO Endpoint AV Log Collection
- Configuring Symantec EP Endpoint AV Log Collection
- Configuring McAfee ePO Endpoint AV Splunk Ingestion
- McAfee ePO Splunk integration: Splunk-Side Configuration
- McAfee ePO Direct Log Ingestion: McAfee ePO Side Configuration
- ATP Appliance Endpoint Response [Carbon Black Response: Log Collector | Splunk Ingestion]
- Configuring Carbon Black Response Log Events via Splunk
- Splunk Side Configuration for Carbon Black Response
- Configuring Carbon Black Response via Direct Log Ingestion
- Carbon Black Response - Splunk Integration
- Carbon Black Response Direct Log Ingestion: Event Forwarder of JSON Logs
- Carbon Black Response Integration via Splunk Forwarder
- Carbon Black Response Ingestion Reporting at Juniper ATP Appliance
ATP Appliance Firewall [PAN: Log Collector | Splunk Ingestion]
To configure ATP Appliance External Event Collector settings for PAN Next Gen Firewalls, perform the following configurations for direct Log Collection or Splunk ingestion options:
PAN Log Collector Configuration - Juniper ATP Appliance Side
Use the following procedure to configure direct ingestion of event data from PAN, where Juniper ATP Appliance essentially acts as a syslog server but one that identifies only relevant malware events.
-
Navigate to the Juniper ATP Appliance Central Manager Web UI Config>Environmental Settings>External Event Collectors configuration page.
-
Select Firewall as the Source Type, and PAN Next Gen Firewall as the Vendor Name.
-
For Transport, select the Log Collector option.
-
Enter the Log Source Identifier; for example: PA-200. This is the host name portion of the syslog message that Juniper ATP Appliance uses to identify which vendor is incoming, and how Juniper ATP Appliance will parse its logged events. [On the PAN UI in the following screenshot, notice that the configured Device Name is the same as the Juniper ATP Appliance Log Source Identifier.]
-
Choose SSL Enabled | Disabled.
-
Select a Default Severity setting: Max | High | Med | Low | Benign
-
Configure Create Incident by selecting the Enable or Disable option. All incidents created by Juniper ATP Appliance from PAN direct ingestion will be created according to the severity setting selected in step 6. The Create Incident setting, when enabled, creates incidents for third party events directly and sends email alert notifications, even if there are no correlates with Juniper ATP Appliance-detected events.
-
Click Add to perform the Log Collector configuration.
PAN-Side Direct Ingestion Settings
At the PAN UI, configure your Juniper ATP Appliance Core as a syslog server. If your PAN device is exporting to your own syslog server, just add Juniper ATP Appliance as another syslog server because PAN can export to multiple syslog destinations simultaneously.
-
Navigate to the PAN console Device>Syslog>+Add configuration page:
Figure 51: Firewall [PAN: Direct Ingestion Configuration] -
Select the same syslog server for log forwarding on the Objects>Log Forwarding>+Add page from the syslog dropdown:
Figure 52: Sample Direct Ingestion Configuration from PAN SideDuring forwarding of syslogs from PAN, when events exceed the 1500 supported limit, Juniper ATP Appliance recommends limiting export from PAN to critical events only by adjusting settings on the PAN console Log Forwarding Profile page.
Figure 53: Sample Direct Ingestion Configuration from PAN SideBe sure to navigate to the Syslog Log forwarding Profile, select where to send the logs (either to the Juniper ATP Appliance Core via direct ingestion, or to Splunk, or to both, and then Commit.
Figure 54: Commit the Log Forwarding Profile to Complete PAN-Side Direct Ingestion Configuration
Direct Ingestion PAN Event Filtering
The number generated syslogs/sec during direct ingestion is 1500; the number of syslogs/day (average of 10 hours) is 54 million. For this reason, Juniper ATP Appliance uses event filtering for efficient ingestion, handling and reporting of events and does not store any events that are informational or benign.
PAN events created via direct ingestion for display in the Juniper ATP Appliance Events Timeline Dashboard use the following filters:
-
Ignore informational events
-
Ignore events with the action “wildfire-upload-success”, “wildfire-upload-skip” and “forward” because these logs are not indicative of malware events.
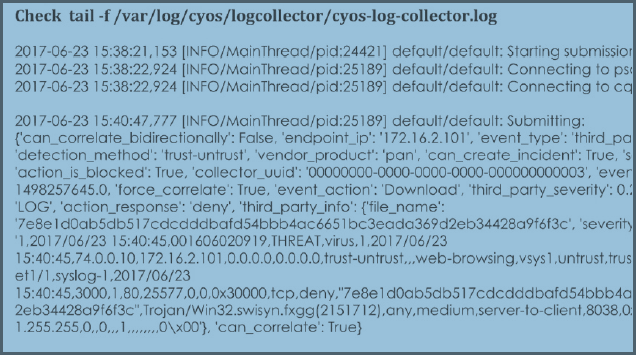
PAN and Splunk Integration Configuration
Use the following procedure to configure Splunk integration for the PAN Next Gen Firewall on the Juniper ATP Appliance side. Refer to for information about configuring integration from the Splunk side.
-
Navigate to the Juniper ATP Appliance Central Manager Web UI Config>Environmental Settings>External Event Collectors configuration page:
Figure 56: Firewall [PAN: Splunk Ingestion Configuration] -
Select Firewall as the Source Type, and PAN Next Gen Firewall as the Vendor Name.
-
For Transport, select the Splunk option.
-
Enter the Optional Splunk Index; enter the index used for PAN logging into Splunk.
For example: pan
-
Select a Default Severity setting: Max | High | Med | Low | Benign
-
Configure Create Incident by selecting the Enable or Disable option. All incidents created by Juniper ATP Appliance from Splunk ingestion will be created according to the severity setting selected in step 5. The Create Incident setting, when enabled, creates incidents for third party events directly and sends email alert notifications, even if there are no correlates with Juniper ATP Appliance-detected events.
-
Click Add to perform the Splunk integration.
For more information about Splunk integration, refer to Configuring ATP Appliance Splunk Ingestion. For guidelines specific to Splunk configurations from the Splunk console, see the next section.
Splunk Side Configuration for PAN
This section does not cover Splunk configuration. However, when configuring Splunk from the Splunk console for integration with Juniper ATP Appliance, there are a few items you’ll need to be sure are set for PAN:
Navigate to Splunk>Apps>Manage Apps, then confirm configuration is established for Palo Alto Add-on for Splunk., and that Status shows as Enabled.
At Splunk>Apps>Manage Apps, check for and confirm setup is complete and Enabled for Common Information Model.
At Settings>Data>Data Inputs>UDP/TCP, click the link to review the Index. You can click this link to check the Index configured for PAN. Be sure to do the same on the Juniper ATP Appliance Configuration page for ATP Appliance Firewall [PAN: Log Collector | Splunk Ingestion] for the Splunk configuration.
From the Splunk>Settings>Data Inputs>Port>PortNumber page, under “More Settings” (check the checkbox to expand), confirm that the Source type is “pan:log,” and check the index that is currently configured so you could use it in the Juniper ATP Appliance Configuration for ATP Appliance Firewall [PAN: Log Collector | Splunk Ingestion] for the Splunk configuration.
Note:The Source type must be configured as “pan:log” and Index as “pan” for integration with Juniper ATP Appliance.
Figure 57: Sample Splunk Configuration from PAN SideBe sure to navigate to the Syslog Log forwarding Profile, select where to send the logs (either to the Juniper ATP Appliance Core via direct ingestion, or to Splunk, or to both and then Commit.
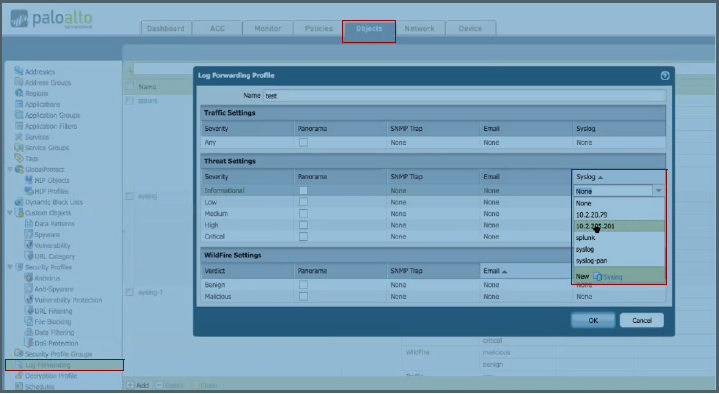
Splunk Integration Event Filtering
PAN events created via Splunk integration classify events according to the following Splunk “Common Information Models” (CIM) via the Splunk PAN Add-on:
-
Web
-
Intrusion Detection
-
Malware Attacks
To display relevant information in the Juniper ATP Appliance Event Timeline Dashboard, Juniper ATP Appliance ignores informational events; benign and allowed events are also ignored by Juniper ATP Appliance.
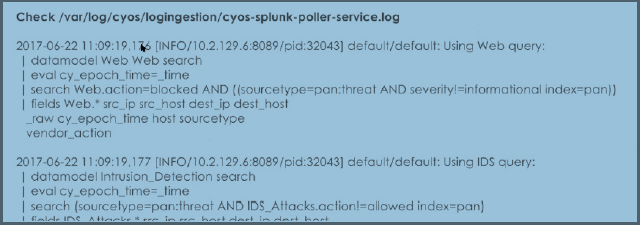
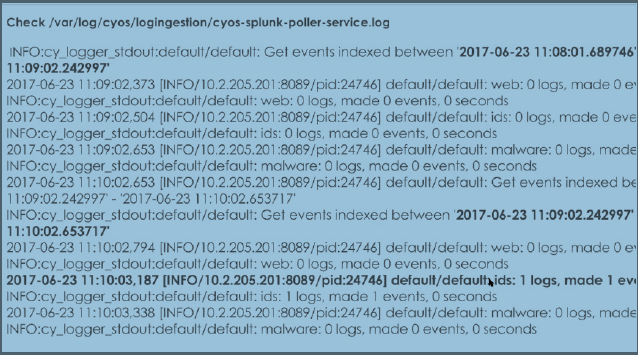
Incident Reporting for PAN Syslog Ingestion
Refer to the following sample Incident display to view Juniper ATP Appliance detection and reporting of PAN syslog ingestion.
In this example, PAN allowed a download to pass through, and Juniper ATP Appliance detected the event.
Note that Juniper ATP Appliance detected the Download and external source log collection also marked it as a malicious event:
This same incident is reported on the Juniper ATP Appliance Events Timeline host view as follows; note that both the PAN Download Event and the Juniper ATP Appliance Malware Detection Event are reported:
In another, different example, we can see in the Events Timeline Dashboard that Juniper ATP Appliance detected a malicious event, and PAN performed a DENY:
Be sure to expand the Timeline view to see how and when the enduser enacted the malicious download:
ATP Appliance Web Gateway [Bluecoat: Log Collector | Splunk Ingestion]
Juniper ATP Appliance integrates with Bluecoat Proxy Secure Gateway to facilitate mitigation. Bluecoat periodically retrieves bad Web URLs from Juniper ATP Appliance and blocks them. (The list of bad URLs are the same as those delineated on the Juniper ATP Appliance’s Mitigation tab > Secure Web Gateways, which lists the URLs to be mitigated. Essentially, Bluecoat has the capability of pulling the malicious URLs list from Juniper ATP Appliance through HTTP/HTTPS. Hence, Juniper ATP Appliance provides the malicious URLs list for Bluecoat to poll.
Juniper ATP Appliance leverages existing third party security devices such as Bluecoat to automatically block malicious Web URLs. This is extremely significant because other vendors do not block malicious Web downloads; they only block infections.
Use the following procedures to configure Bluecoat Secure Web Gateway Log Collector Ingestion or Splunk Ingestion.
Configuring a Bluecoat Secure Web Gateway Log Collector
-
Navigate to the Juniper ATP Appliance Central Manager Web UI Config>Environmental Settings>External Event Collectors configuration page:
Figure 61: Web Gateway [Bluecoat: Log Collector Configuration] -
Select Web Gateway as the Source Type.
-
Select Bluecoat Secure Web Gateway as the Vendor Name.
-
For Transport, select the Log Collector option.
-
Enter the Input Port.
-
Select a Default Severity setting: Max | High | Med | Low | Benign
-
Configure Create Incident by selecting the Enable or Disable option. All incidents created by Juniper ATP Appliance from Splunk ingestion will be created according to the severity setting selected in step 6. The Create Incident setting, when enabled, creates incidents for third party events directly and sends email alert notifications, even if there are no correlates with Juniper ATP Appliance-detected events.
-
Click Add to perform the Bluecoat Secure Web Gateway Log Collector configuration.
Configuring Splunk to Bluecoat Integration
Before cofiguring Splunk for Bluecoat integration with Juniper ATP Appliance, consider the following prerequisites:
-
Have the Splunk enterprsie version installed and running
-
Have the Splunk for Bluecoat app installed and running
-
Have the Splunk Add-on for Blue Coat ProxySG running
-
Have Bluecoat CLI access, with access to Enable Mode and Configure Mode
-
Note that Juniper ATP Appliance only supports the bcreportermain_v1 log type currently, so no other log type will work
-
Be sure to use NTP service on the Splunk server so that Splunk and Bluecoat time are in sync
-
After integration, observe the Splunk logs under “bcoat_logs” and confirm the time matches Splunk’s time. For example, if Splunk is in PST, the data coming from Bluecoat under “bcoat_logs” index should also be set for PST. If there is no time match, integration might not work properly
Juniper ATP Appliance Side Configuration
-
Navigate to Config > Environmental Settings > Splunk Configuration at the Juniper ATP Appliance Central Manager console.
-
Add the Splunk configuration Username, Password and Port, then set as Enabled and click Test Configuration to verify. If the connection is established successfully, a success message is displayed.
-
Add Bluecoat as an External Event Collector; refer to ATP Appliance Web Gateway [Bluecoat: Log Collector | Splunk Ingestion].
Be sure to select transport “log collector / Splunk. Provide a port number if selecting log collector and an optional index if selecting the splunk option, then add the settings.
Bluecoat Side Configuration
-
Login to the Bluecoat CLI and enter Enable mode, then enter Configure mode.
-
Enter access-log settings: enter the command “edit log main.”
-
Select client type as custom client.
-
Select access log enable.
-
Select upload type text.
-
Select custom client primary <Juniper ATP Appliance Core IP or Splunk Server IP> <any port number you want to use for integration > and click Enter.
-
Enable continuous upload and the integration is done on Juniper ATP Appliance side
Splunk Side Configuration
-
At the Splunk console, navigate to Settings -> Data Inputs.
-
In the Local Input menu, click Add New in the TCP Port menu. A new page will open with 4 fields:
-
In the Port field input the port number (the port number configured in the Bluecoat custom client), then click Next. Make sure the type remains as TCP.
-
In the next window, select the source type as “bluecoat:proxysg:access:syslog”.
-
On the same page, select the index type as “bcoat_logs,” and click Review.
-
Review the data and click Next. The bluecoat configuaration is now complete.
Within a few minutes the Bluecoat logs will start appearing on the Splunk side. Be sure to use index=”bcoat_logs” for filtering the logs.
Configuring Bluecoat to Juniper ATP Appliance Integration
In order to allow Bluecoat to connect to Juniper ATP Appliance’s self signed SSL apache server with HTTPS, the PEM file from the Juniper ATP Appliance server must be accessed. Then, you import the PEM file to the Bluecoat SSL certificate list.
The common name (CN) in the PEM has to be matched with the hostname in the URL Bluecoat is using to poll. This is the reason why PEM regeneration is tied to parsing of the common name obtained from the PEM file to add it to the generated URL.
Juniper ATP Appliance Side Setup
-
Navigate to Config > System Settings > System Settings.
-
Change the “Server fully qualified domain name” appropriately. This is going to be the common name in the PEM, and also the host name that Bluecoat is sending the request to. Therefore, you need to make sure Bluecoat can access this host by using the name specified.
-
Click the Submit button. The new PEM file is generated on the server, and the Apache requires a restart to apply the change. Refresh the UI by pressing F5 until you see a new warning “The site’s security certificate is not trusted!” (via Chrome, for example). This warning indicates that the PEM is changed.
-
Navigate to the Bluecoat configuration console.
Bluecoat Side Setup
-
Enter the information required as described below:
Figure 62: Bluecoat Configuration Settings-
Availability: This setting controls whether the Juniper ATP Appliance URL is available to be polled by Bluecoat.
-
Exception Page: This is a string to be included in the URL list, allowing Bluecoat to display a predefined exception page if a malicious URL is requested.
-
Cache Age: This value is used to determine how long the malicious URLs list is cached to avoid a repetitive attack and also to help reduce the Juniper ATP Appliance server load.
-
Allowed IPs: If leaving it blank, Juniper ATP Appliance is not checking who polls the list. Otherwise, only the IPs specified is allowed to poll.
-
-
Get PEM File button. Clicking this button will display the server PEM key content; copy and paste this key into Bluecoat in order to let Bluecoat to accept Juniper ATP Appliance’s self-signed certificate.
Figure 63: PEM Key Content Display -
Refresh URL button: Clicking this button will (re-)generate the polling URL.
-
To import a CA Certificate from the Bluecoat side: navigate to the Configuration tab SSL > CA Certificates section and click the Import button.
-
Enter a unique name, and copy and paste the PEM key from system settings to here.
Figure 64: PEM Copied to Bluecoat -
Click Apply.
-
Under SSL > CA Certificates, switch the tab to CA Certificate Lists.
-
Highlight “browser-trusted” and click Edit.
-
Add the newly created CA Certificate entry from left to right, then click Apply.
Figure 65: Adding the CA Certificate to the Bluecoat Configuration -
To set up the polling, navigate to Policy > Policy Files.
-
Click Install for the “Install Central File from:” section.
-
Paste the URL from the Juniper ATP Appliance server to here:
Figure 66: Adding the Juniper ATP Appliance URL to the Bluecoat Configuration -
You will see the “The file was successfully downloaded and installed” message. Check the box “Automatically install new Policy when central file changes”.
-
The final step is to configure how often Bluecoat should poll:
# ssh admin@10.2.121.10
10.2.121.100 - Blue Coat SGVA Series>enable
Enable Password:
10.2.121.100 - Blue Coat SGVA Series#(config)policy poll-interval 5
ok
This sets a 5 minute interval between polls.
Configuring Bluecoat Secure Web Gateway Splunk Ingestion
-
Navigate to the Juniper ATP Appliance Central Manager Web UI Config>Environmental Settings>External Event Collectors configuration page:
-
Select Web Gateway as the Source Type.
-
Select Bluecoat Secure Web Gateway as the Vendor Name.
-
For Transport, select the Splunk option.
-
Enter the Optional Splunk Index; for example: pan
-
Select a Default Severity setting: Max | High | Med | Low | Benign
-
Configure Create Incident by selecting the Enable or Disable option. All incidents created by Juniper ATP Appliance from Splunk ingestion will be created according to the severity setting selected in step 6. The Create Incident setting, when enabled, creates incidents for third party events directly and sends email alert notifications, even if there are no correlates with Juniper ATP Appliance-detected events.
-
Click Add to perform the Splunk integration
ATP Appliance Endpoint AV [ESET | McAfee ePO | Symantec: Log Collector | Splunk Ingestion]
Use the following procedures to configure Log Collection or Splunk Ingestion for Endpoint AV vendors ESET, McAfee ePO and/or Symantec AV.
Configuring ESET Endpoint AV Log Collection
-
Navigate to the Juniper ATP Appliance Central Manager Web UI Config>Environmental Settings>External Event Collectors configuration page:
-
Select Endpoint AV as the Source Type.
-
Select ESET as the Vendor Name.
-
For Transport, select the Log Collector option.
-
Enter the Log Source Identifier.
-
Choose an SSL setting: Enabled or Disabled; “enabled” is recommended.
-
Select a Default Severity setting: Max | High | Med | Low | Benign
-
Configure Create Incident by selecting the Enable or Disable option. All incidents created by Juniper ATP Appliance from Splunk ingestion will be created according to the severity setting selected in step 5. The Create Incident setting, when enabled, creates incidents for third party events directly and sends email alert notifications, even if there are no correlates with Juniper ATP Appliance-detected events.
Click Add to perform the ESET Log Collector configuration.
Configuring McAfee ePO Endpoint AV Log Collection
-
Navigate to the Juniper ATP Appliance Central Manager Web UI Config>Environmental Settings>External Event Collectors configuration page:
-
Select Endpoint AV as the Source Type.
-
Select McAfee ePO as the Vendor Name.
-
For Transport, select the Log Collector option.
-
Enter the Log Source Identifier; for example: MCAFEE-EPO.
-
Choose an SSL setting: Enabled or Disabled; “enabled” is recommended.
-
Select a Default Severity setting: Max | High | Med | Low | Benign
-
Configure Create Incident by selecting the Enable or Disable option. All incidents created by Juniper ATP Appliance from Splunk ingestion will be created according to the severity setting selected in step 5. The Create Incident setting, when enabled, creates incidents for third party events directly and sends email alert notifications, even if there are no correlates with Juniper ATP Appliance-detected events.
-
Click Add to perform the McAfee ePO Log Collector configuration.
Configuring Symantec EP Endpoint AV Log Collection
-
Navigate to the Juniper ATP Appliance Central Manager Web UI Config>Environmental Settings>External Event Collectors configuration page:
Figure 67: Endpoint AV [ESET:Log Collector Configuration] -
Select Endpoint AV as the Source Type.
-
Select Symantec EP as the Vendor Name.
-
For Transport, select the Log Collector option.
-
Enter the Log Source Identifier.
-
Choose an SSL setting: Enabled or Disabled.
-
Select a Default Severity setting: Max | High | Med | Low | Benign
-
Configure Create Incident by selecting the Enable or Disable option. All incidents created by Juniper ATP Appliance from Splunk ingestion will be created according to the severity setting selected in step 5. The Create Incident setting, when enabled, creates incidents for third party events directly and sends email alert notifications, even if there are no correlates with Juniper ATP Appliance-detected events.
-
Click Add to perform the Symantec EP Log Collector configuration.
Configuring McAfee ePO Endpoint AV Splunk Ingestion
-
Navigate to the Juniper ATP Appliance Central Manager Web UI Config>Environmental Settings>External Event Collectors configuration page:
-
Select Endpoint AV as the Source Type.
-
Select McAfee ePO as the Vendor Name.
-
For Transport, select the Splunk option.
-
Enter the Optional Splunk Index; for example: pan
-
Select a Default Severity setting: Max | High | Med | Low | Benign
-
Configure Create Incident by selecting the Enable or Disable option. All incidents created by Juniper ATP Appliance from Splunk ingestion will be created according to the severity setting selected in step 5. The Create Incident setting, when enabled, creates incidents for third party events directly and sends email alert notifications, even if there are no correlates with Juniper ATP Appliance-detected events.
-
Click Add to perform the Splunk integration.
McAfee ePO Splunk integration: Splunk-Side Configuration
-
Install McAfee ePO version 5.2 with latest patch.
-
Install latest Splunk enterprise version
-
Install Splunk Add-on for McAfee. https://splunkbase.splunk.com/app/1819/
-
Install and configure DB Connect for Splunk:
-
Download and install DB Connect Version2.4.0 Add-on. This is required to connect to the McAfee ePO database to pull ePO events from the McAfeen ePO server database. https://splunkbase.splunk.com/ app/2686/
Note:This app works on JAVA 1.8 version; be sure to update the ubuntu/windows version to run Splunk with JAVA 1.8
Steps:
sudo add-apt-repository ppa:webupd8team/java
sudo apt-get update
sudo apt-get install oracle-java8-installer
sudo apt-get install oracle-java8-set-default
-
Install a JDBC driver for your database. Refer to the section: Microsoft SQL Server. http:// docs.splunk.com/Documentation/DBX/2.4.0/DeployDBX/Installdatabasedrivers
-
After installing DB Connect and restarting Splunk Enterprise, launch DB Connect and complete the initial setup http://docs.splunk.com/Documentation/DBX/2.4.0/DeployDBX/ Singleserverdeployment#Set_up_Splunk_DB_Connect
-
Create a database identity, set up a database connection, and create a new database input for Splunk Add-on for McAfee .
Note: Use the Splunk DB Connect GUI method to create a database connection instead of modifying db_connections.conf file to create a connection. Under the Execution Frequency setting, change from 3600 sec to 1 sec so that it pulls the data from the epo db every second. http://docs.splunk.com/Documentation/AddOns/released/McAfeeEPO/ ConfigureDBConnectv2inputs
-
Generate a threat event on the ePO server and search through that event log to find the endpoint IP address that was attacked, or the malware name; as shown on in the following example:
-
Login to the Juniper ATP Appliance Web UI and navigate to Config>Environmental Settings>External Event Collectors and ADD a new external collector using the Splunk option; refer to the Juniper ATP Appliance-Side Configuring McAfee ePO Endpoint AV Splunk Ingestion for more information.
-
View the McAfee ePO threat events on the Juniper ATP Appliance Events Timeline Dashboard by filtering the timeline by “IP Address” of the endpoint.
McAfee ePO Direct Log Ingestion: McAfee ePO Side Configuration
-
Confirm you have installed McAfee ePO version 5.2 version with the latest patch (hotpatch ePolicy Orchestrator (EPO) 5.3.2 HF1185471).
Login to the ePO 5.2 UI and create a syslog-registered server via tabs Configuration>Registered Servers:
-
Create a new server by entering all required details as shown in the figure above. Enter the Juniper ATP Appliance Core hostname/IP as the Server Name, and enter 10514 for the TCP port number.
-
Click the Test connection button to confirm that the settings are correct and ePO is ready to send syslog events to Juniper ATP Appliance. The message “Syslog connection success” indicates that the ePO is ready to push threat events to the Juniper ATP Appliance Core and the Juniper ATP Appliance Core is ready to accept the events.
-
View the McAfee ePO threat events on the Juniper ATP Appliance Events Timeline Dashboard by filtering the timeline by the IP Address of the endpoint, as show in the screenshot below.
ATP Appliance Endpoint Response [Carbon Black Response: Log Collector | Splunk Ingestion]
To configure Carbon Black Response for endpoint alert event handling via direct log ingestion or Splunk ingestion, use the following procedures.
Configuring Carbon Black Response Log Events via Splunk
-
Navigate to the Juniper ATP Appliance Central Manager Web UI Config>Environmental Settings>External Event Collectors configuration page:
-
Select Carbon Black Response as the Vendor Name.
-
For Transport, select the Splunk option.
-
Enter the Optional Splunk Index; for example: pan
-
Select a Default Severity setting: Max | High | Med | Low | Benign
-
Configure Create Incident by selecting the Enable or Disable option. All incidents created by Juniper ATP Appliance from Splunk ingestion will be created according to the severity setting selected in step 5. The Create Incident setting, when enabled, creates incidents for third party events directly and sends email alert notifications, even if there are no correlates with Juniper ATP Appliance-detected events.
-
Click Add to perform the Splunk integration.
For more information about Splunk integration, refer to Configuring ATP Appliance Splunk Ingestion.
Splunk Side Configuration for Carbon Black Response
This section does not cover Splunk configuration. However, when configuring Splunk from the Splunk console for integration with Juniper ATP Appliance, there are a few items you’ll need to be sure are set for PAN:
Navigate to Splunk.
Configuring Carbon Black Response via Direct Log Ingestion
-
Navigate to the Juniper ATP Appliance Central Manager Web UI Config>Environmental Settings>External Event Collectors configuration page:
Figure 68: Endpoint Response [Carbon Black Response:Log Collector Configuration] -
Select Carbon Black Response as the Vendor Name.
-
For Transport, select the Log Collector option.
-
Enter the Input Port.
-
Select a Default Severity setting: Max | High | Med | Low | Benign
-
Configure Create Incident by selecting the Enable or Disable option. All incidents created by Juniper ATP Appliance from log ingestion will be created according to the severity setting selected in step 5. The Create Incident setting, when enabled, creates incidents for third party events directly and sends email alert notifications, even if there are no correlates with Juniper ATP Appliance-detected events.
-
Click Add to save the Log Collector configuration.
Carbon Black Response - Splunk Integration
Use the following information to perform Carbon Black Response and Splunk integration using either:
-
Carbon Black Response Direct Log Ingestion: Event Forwarder of JSON Logs
-
Carbon Black Response Ingestion Reporting at Juniper ATP Appliance
IMPORTANT: A few notices about Carbon Black Response and Splunk integration:
-
Juniper ATP Appliance requires Active Directory (AD) data for correlation with Carbon Black logs.
-
AD, Splunk and Juniper ATP Appliance must be NTP-synced.
-
Currently, form Carbon Black, only watchlist alert events are consumed by Juniper ATP Appliance:
-
alert.watchlist.hit.ingress.host
-
alert.watchlist.hit.ingress.binary
-
alert.watchlist.hit.ingress.process
-
alert.watchlist.hit.query.binary
-
alert.watchlist.hit.query.process
-
-
Correlation between Juniper ATP Appliance and Carbon Black Response is within 5 minutes.
-
The endpoint hostname is the only match for correlating Carbon Black Response and Juniper ATP Appliance events.
-
With Carbon Black Response Event Forwarder, there is an option to forward logs in JSON or LEEF format; Juniper ATP Appliance supports JSON format only at this time for both Splunk and Direct Log ingestion.
-
For Direct Log Ingestion, logs can be sent to any random Juniper ATP Appliance port.
-
The difference between Carbon Black Response integration and Carbon Black Direct Log Ingestion:
-
During Carbon Black Response integration, Juniper ATP Appliance queries for only those events detected by Juniper ATP Appliance to obtain confirmation about the endpoint execution.
-
In CB Log Ingestion, all events irrespective of whether Juniper ATP Appliance has seen it or not is pulled.
-
If a CB event is correlated in CB log ingestion, then we don’t mark the EX Progression.
-
Carbon Black Response Direct Log Ingestion: Event Forwarder of JSON Logs
-
Install the Carbon Black Response Event Forwarder :
https://developer.carbonblack.com/reference/enterprise-response/event-forwarder/
-
To send the Carbon Black Response event logs to any server via TCP or UDP, edit the Event Forwarder CONF file as in the example shown below:
In
/etc/cb/integrations/event-forwarder/cb-event-forwarder.confrabbit_mq_username=cb rabbit_mq_password=<password> cb_server_hostname=127.0.0.1
Take the username & password for the above from /etc/cb/cb.conf, search for RabbitMQUser & RabbitMQPassword and copy the value from the above file.
In
/etc/cb/integrations/event-forwarder/cb-event-forwarder.confSearch for and enter the values shown below:
output_type=tcp or udp
output_format=json
If the TCP option is selected, configure the tap server and the listening port. Currently, you can select any random port to listen to.
tcpout=10.2.9.35:10516
If udp option is selected above, then configure the tap server & the listening port. Currently you can select any random port to listen to:
udpout=10.2.9.35:10516
Next, run the below command to receive output indicating which server the event forwarder has connected to.
[root@scb ~]# /usr/share/cb/integrations/event-forwarder/cb-event-forwarder -check
2017/05/08 03:42:38 Connected to tcp:10.2.9.35:10516 at 2017-05-08 03:42:38.068386476 -0700 PDT.
2017/05/08 03:42:38 Initialized output: tcp:10.2.9.35:10516
Start the event-forwarder:
[root@cb]# initctl start cb-event-forwarder
Carbon Black Response Integration via Splunk Forwarder
-
From the Carbon Black Response Server, install the Carbon Black Response Event Forwarder:
https://developer.carbonblack.com/reference/enterprise-response/event-forwarder/
-
Download the relevant binaries from this link:
https://www.splunk.com/en_us/download/universal-forwarder.html
-
Install Splunk Add on for Bit9 Carbon Black to your Splunk instance. Set the Splunk Common Information Model.
-
Configure the Carbon Black Response Event Forwarder; this is required to save the Carbon Black Response event logs to a file using the contents to forward data to Splunk.
In
/etc/cb/integrations/event-forwarder/cb-event-forwarder.confrabbit_mq_username=cb rabbit_mq_password=<password> cb_server_hostname=127.0.0.1
Apply the username and password shown above from /etc/cb/cb.conf, search for RabbitMQUser and RabbitMQPassword, and copy the value to the above CONF file.
In
/etc/cb/integrations/event-forwarder/cb-event-forwarder.confSearch & enter the values below:
output_type=file
output_format=json
outfile=/var/cb/data/event-forwarder/data.json
The above outfile can be anything; in this example, the link stores the event logs.
Run the command below to get the output shown below.
[root@cb]# /usr/share/cb/integrations/event-forwarder/cb-event-forwarder -check
2017/04/20 02:42:58 Initialized output: File /var/cb/data/event-forwarder/data.json
Start the event-forwarder:
[root@cb]# initctl start cb-event-forwarder
-
Configure the Splunk Add on for Bit 9 Carbon Black Response.
Set the Splunk Common Information Model as shown below:
Configure the Receiver for your Splunk Instance to set the Splunk Forwarder to forward data; Navigate to Splunk > Settings > Forwarding & Receiving.
Click on Configure Receiving.
Configure a port to listen on. In this example: port 6666.
-
Set up the Splunk Universal Forwarder to forward Carbon Black Response data to Splunk by downloading and installing the Universal Forwarder RPM on the Carbon Black Response server .
https://www.splunk.com/en_us/download/universal-forwarder.html
rpm -ivh splunkforwarder-6.5.3-36937ad027d4.i386.rpm
[root@cb]# cd /opt/splunkforwarder/bin
[root@cb]# ./splunk
Data forwarding configuration management tools.
Commands:
enable local-index [-parameter <value>] ...
disable local-index [-parameter <value>] ...
display local-index
add forward-server server
remove forward-server server
list forward-server
Objects:
forward-server a Splunk forwarder to forward data to be indexed
local-index a local search index on the Splunk server
[root@cb bin]# ./splunk add forward-server 10.2.14.219:6666
In the above command 10.2.14.219 is the splunk server & 6666 is the port we have configured in Step 3 on which Splunk is receiving.
[root@cb local]# pwd
/opt/splunkforwarder/etc/system/local
[root@cb local]# cat inputs.conf
[default]
host = cbtest
[monitor:///var/cb/data/event-forwarder]
sourcetype = bit9:carbonblack:json
[root@cb local]
-
Add an input host file. In this example, cbtest is used, which can be searched for in Splunk.
The monitor is the directory of data.json, which is configured in Step 1.
The sourcetype shows which data needs to be sent, which is from Carbon Black Response.
[root@cb bin]# cd /opt/splunkforwarder/bin
[root@cb bin]# ./splunk start
-
Start Splunk.
-
Check the forward-server.
[root@cb bin]# ./splunk list forward-server
Splunk username: admin
Password:
Active forwards:
10.2.14.219:6666
Configured but inactive forwards:
None
[root@cb bin]#
Carbon Black Response Ingestion Reporting at Juniper ATP Appliance
Carbon Black Response log ingestion can be viewed from the Juniper ATP Appliance Central Manager Web UI Incidents page and Events Timeline Dashboard.

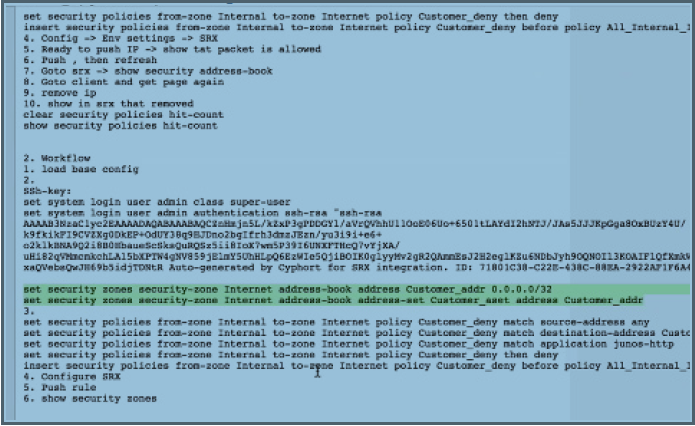
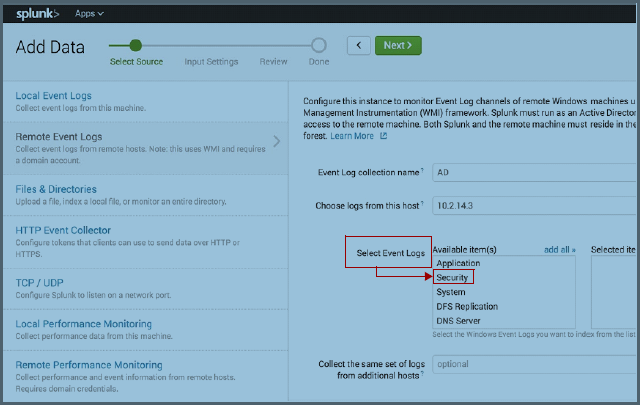
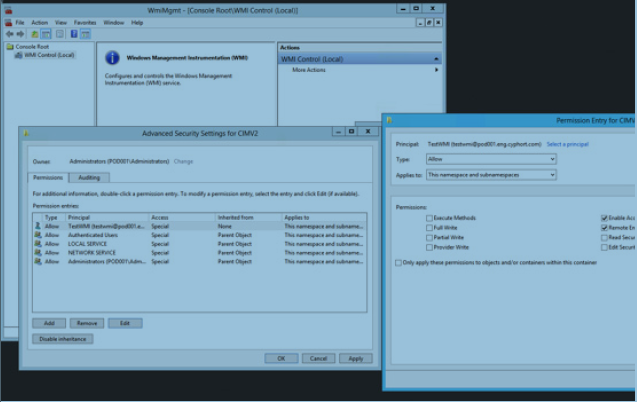
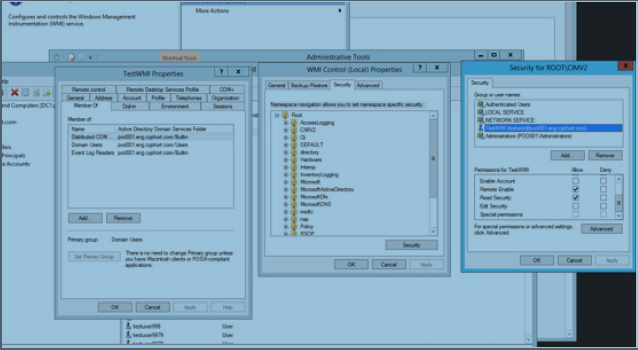
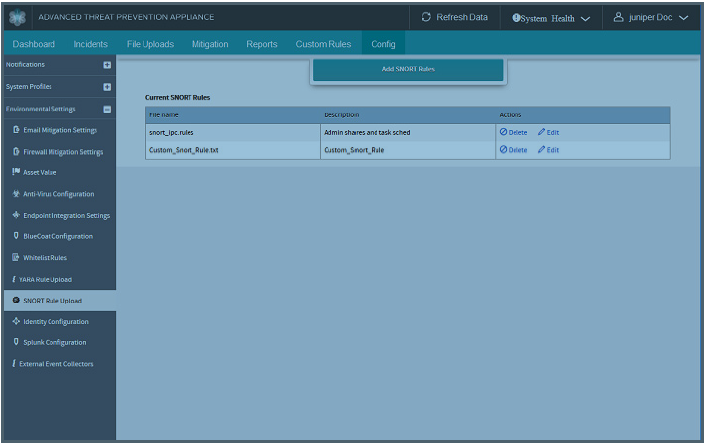
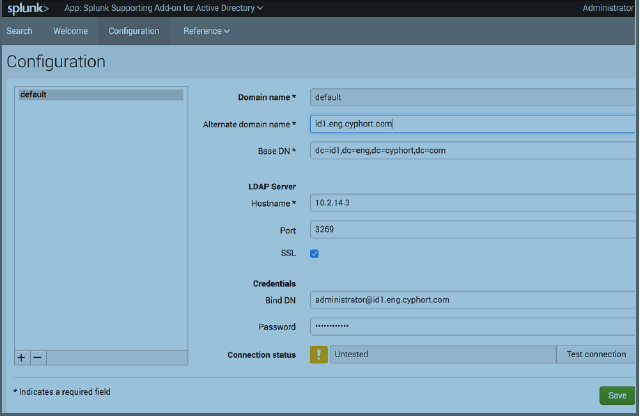

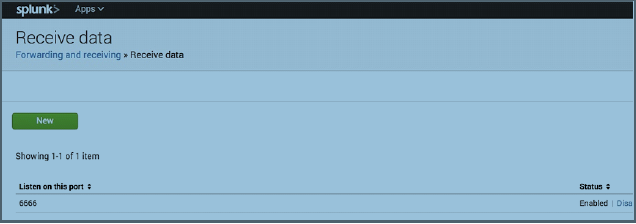
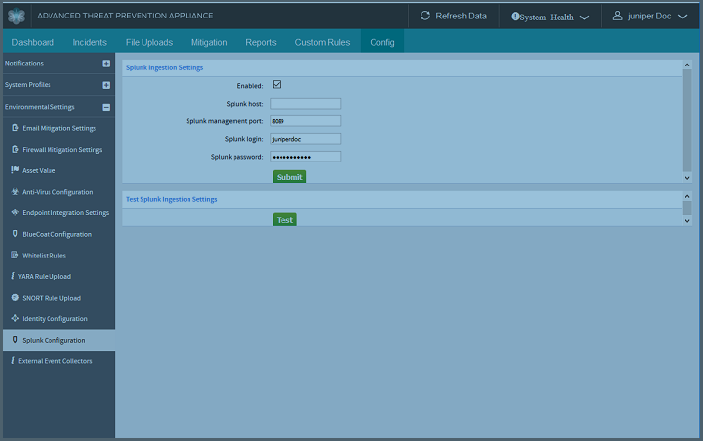
![Firewall [PAN: Direct Ingestion Configuration]](../../images/s006725.PNG)
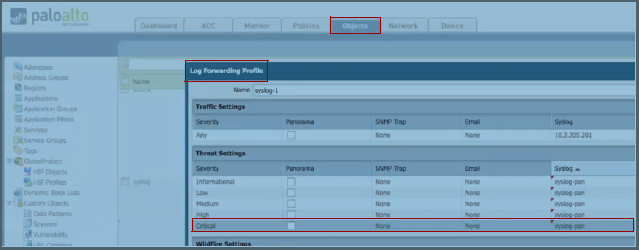
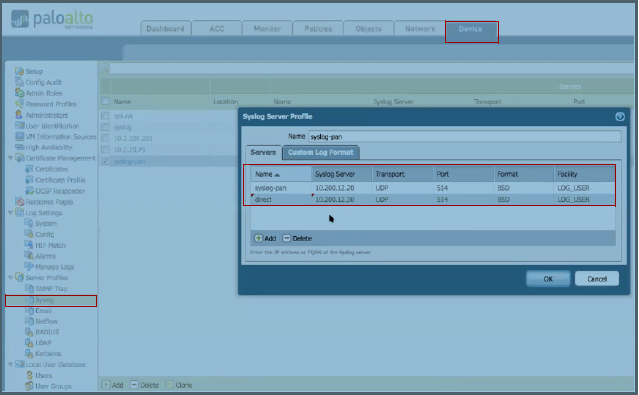
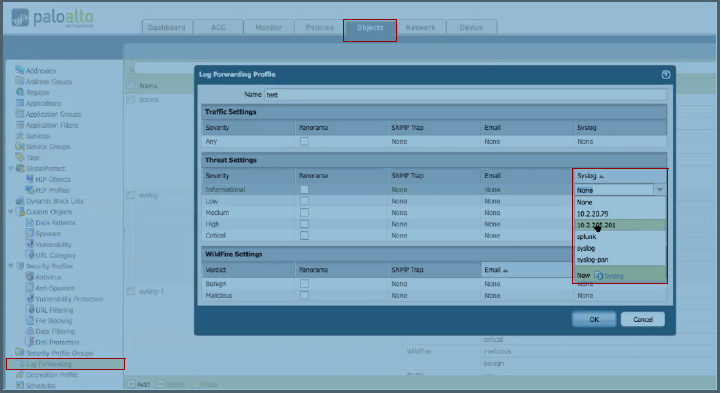
![Firewall [PAN: Splunk Ingestion Configuration]](../../images/s006730.PNG)


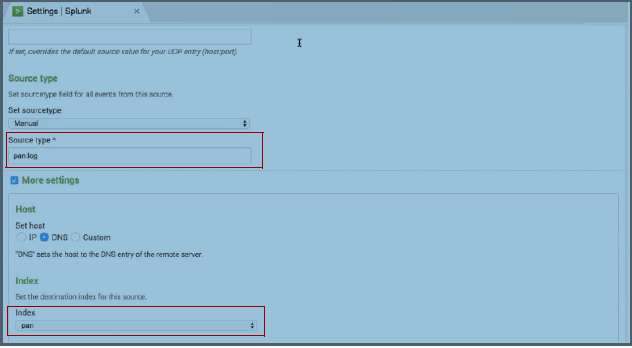
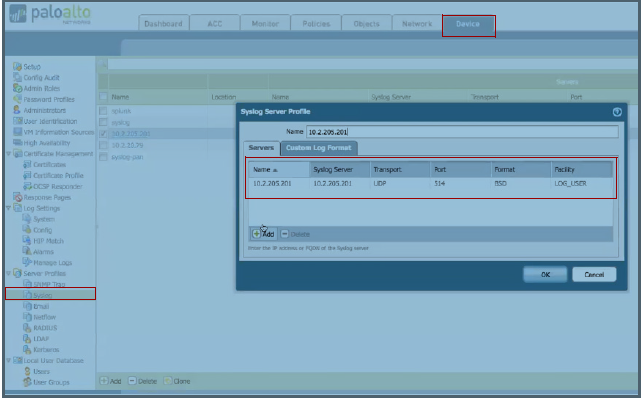
![Web Gateway [Bluecoat: Log Collector Configuration]](../../images/s006739.PNG)
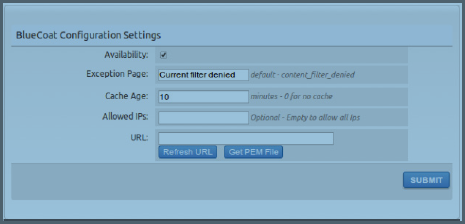
![Endpoint AV [ESET:Log Collector Configuration]](../../images/s006745.PNG)

![Endpoint Response [Carbon Black Response:Log Collector Configuration]](../../images/s006748.PNG)
