Launch the Apstra Flow Dashboard
Congratulations! You successfully installed and configured
Apstra Flow on your network. Now you're ready to launch the Apstra Flow dashboard.
Note:
You can also access the Apstra Flow dashboard directly from your blueprint in the Apstra GUI. See Access the Apstra Flow Dashboard from the Apstra GUI for instructions.
To launch the Apstra Flow dashboard:
-
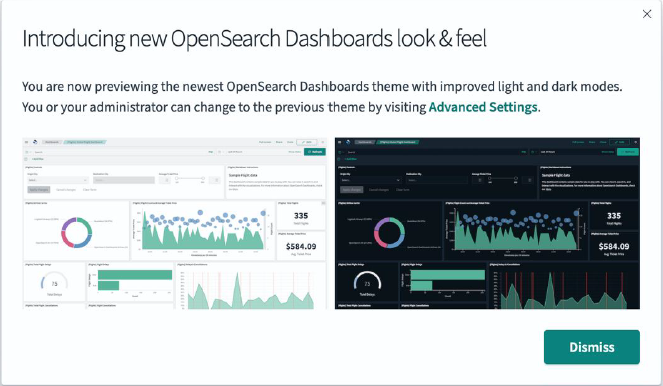
From the OpenSearch Dashboards page, click
Dismiss.
-
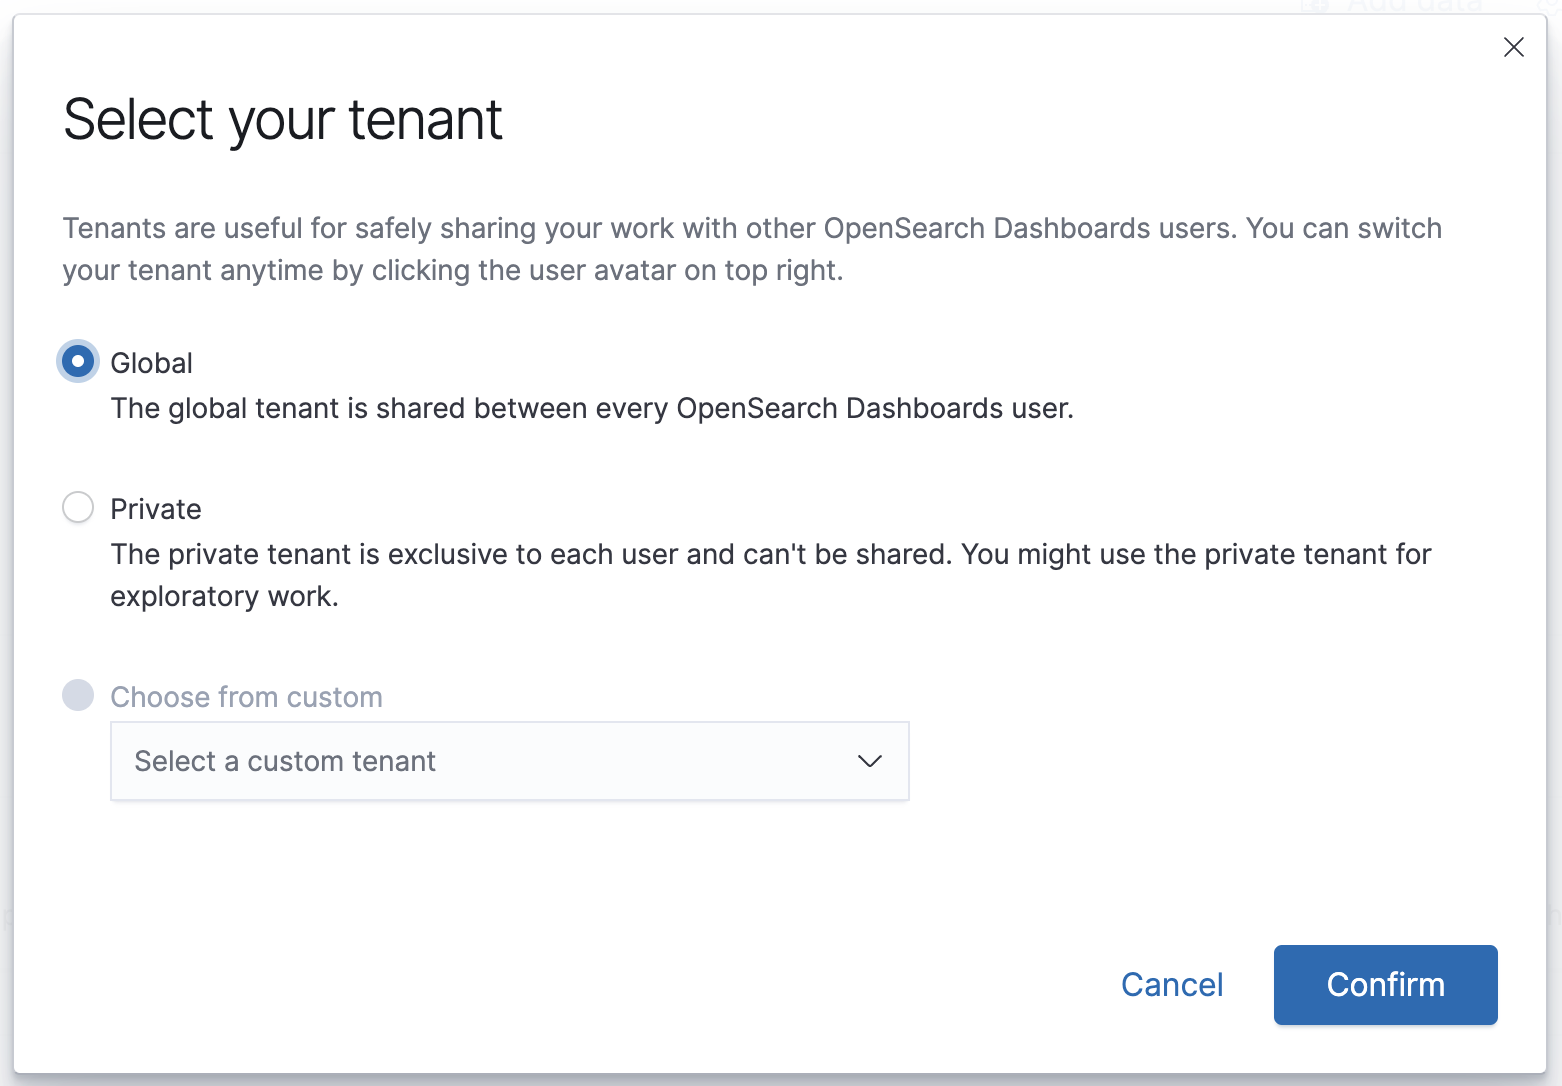
Select Global as your tenant and click
Confirm.
-
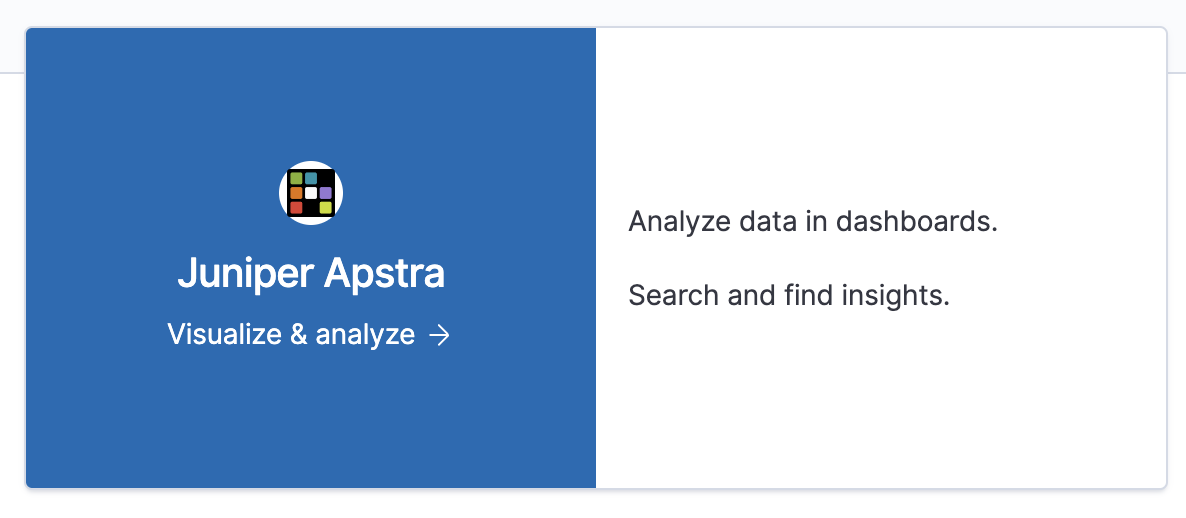
Select Anaylze data in dashboards.
-
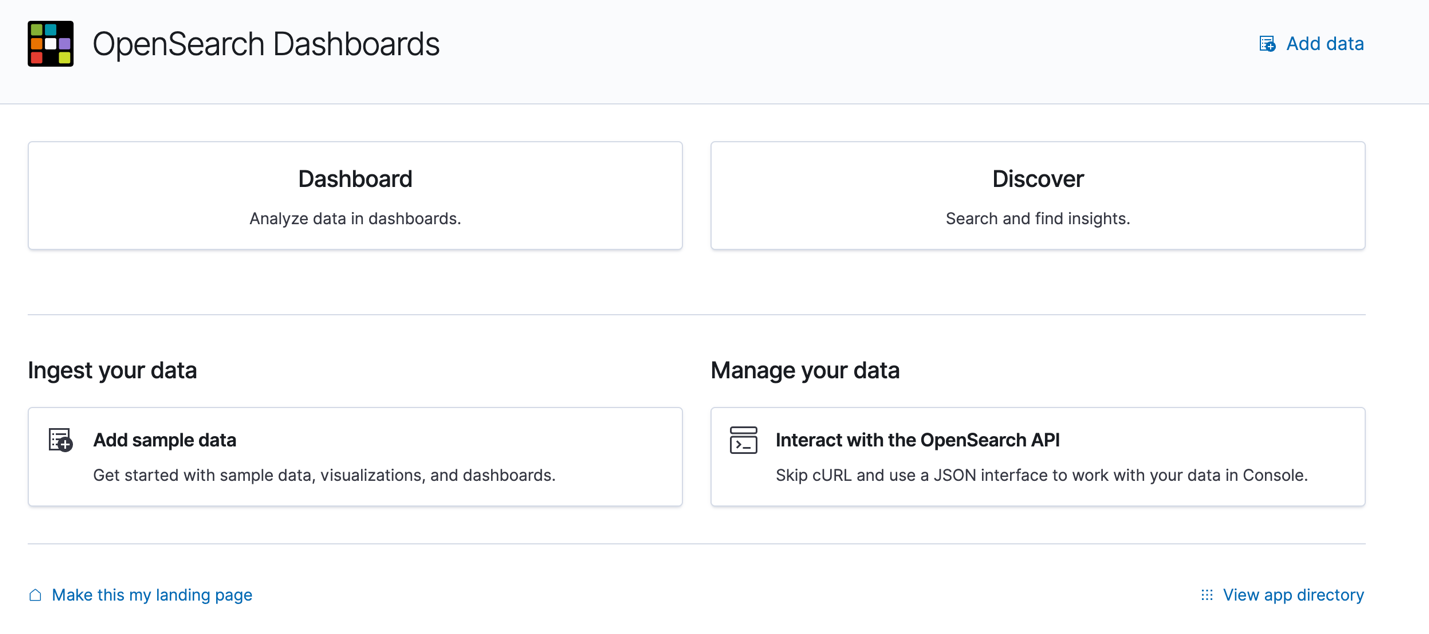
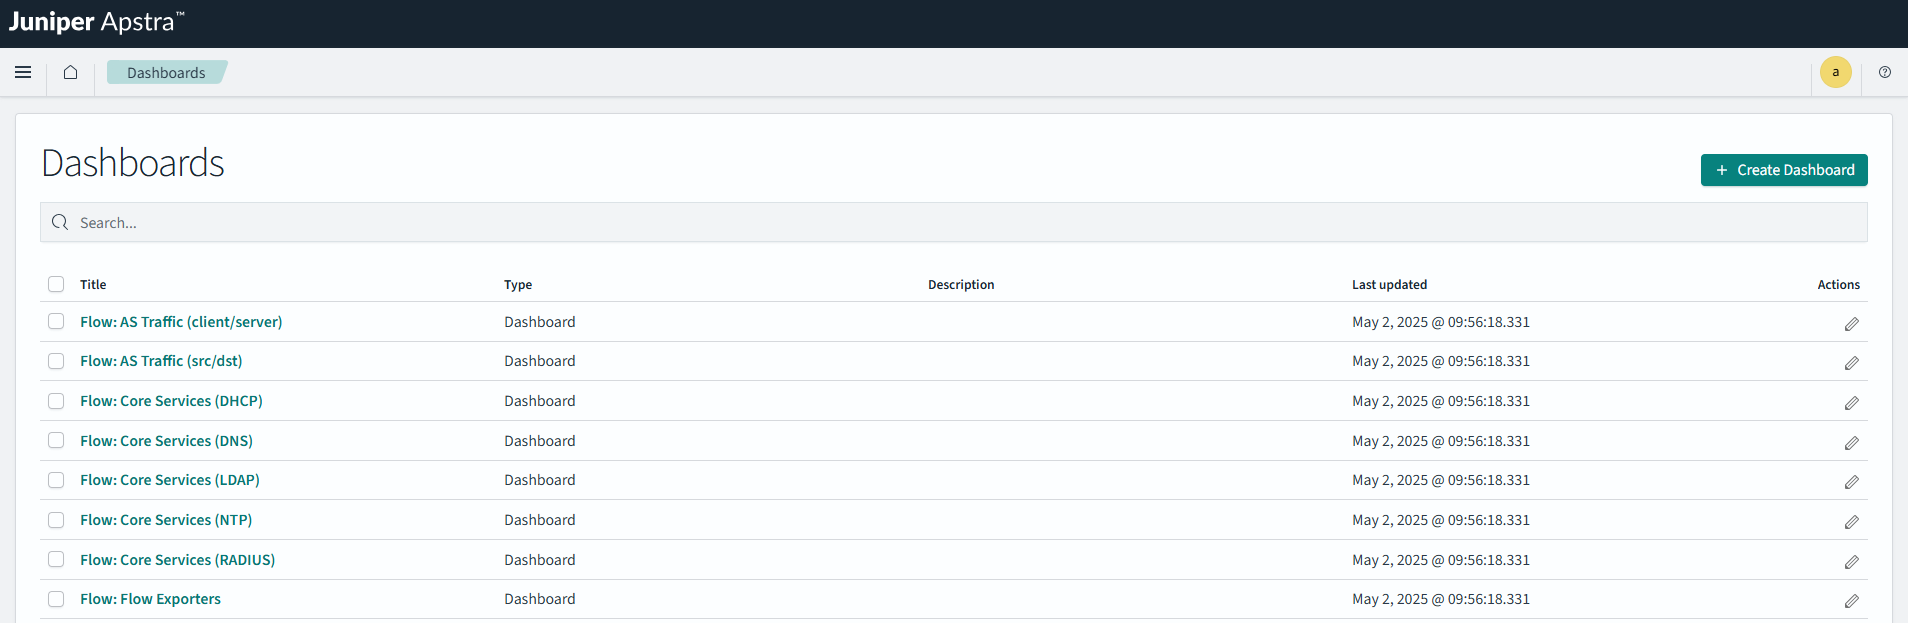
Select Dashboard from the OpenSearch
Dashboards page.
-
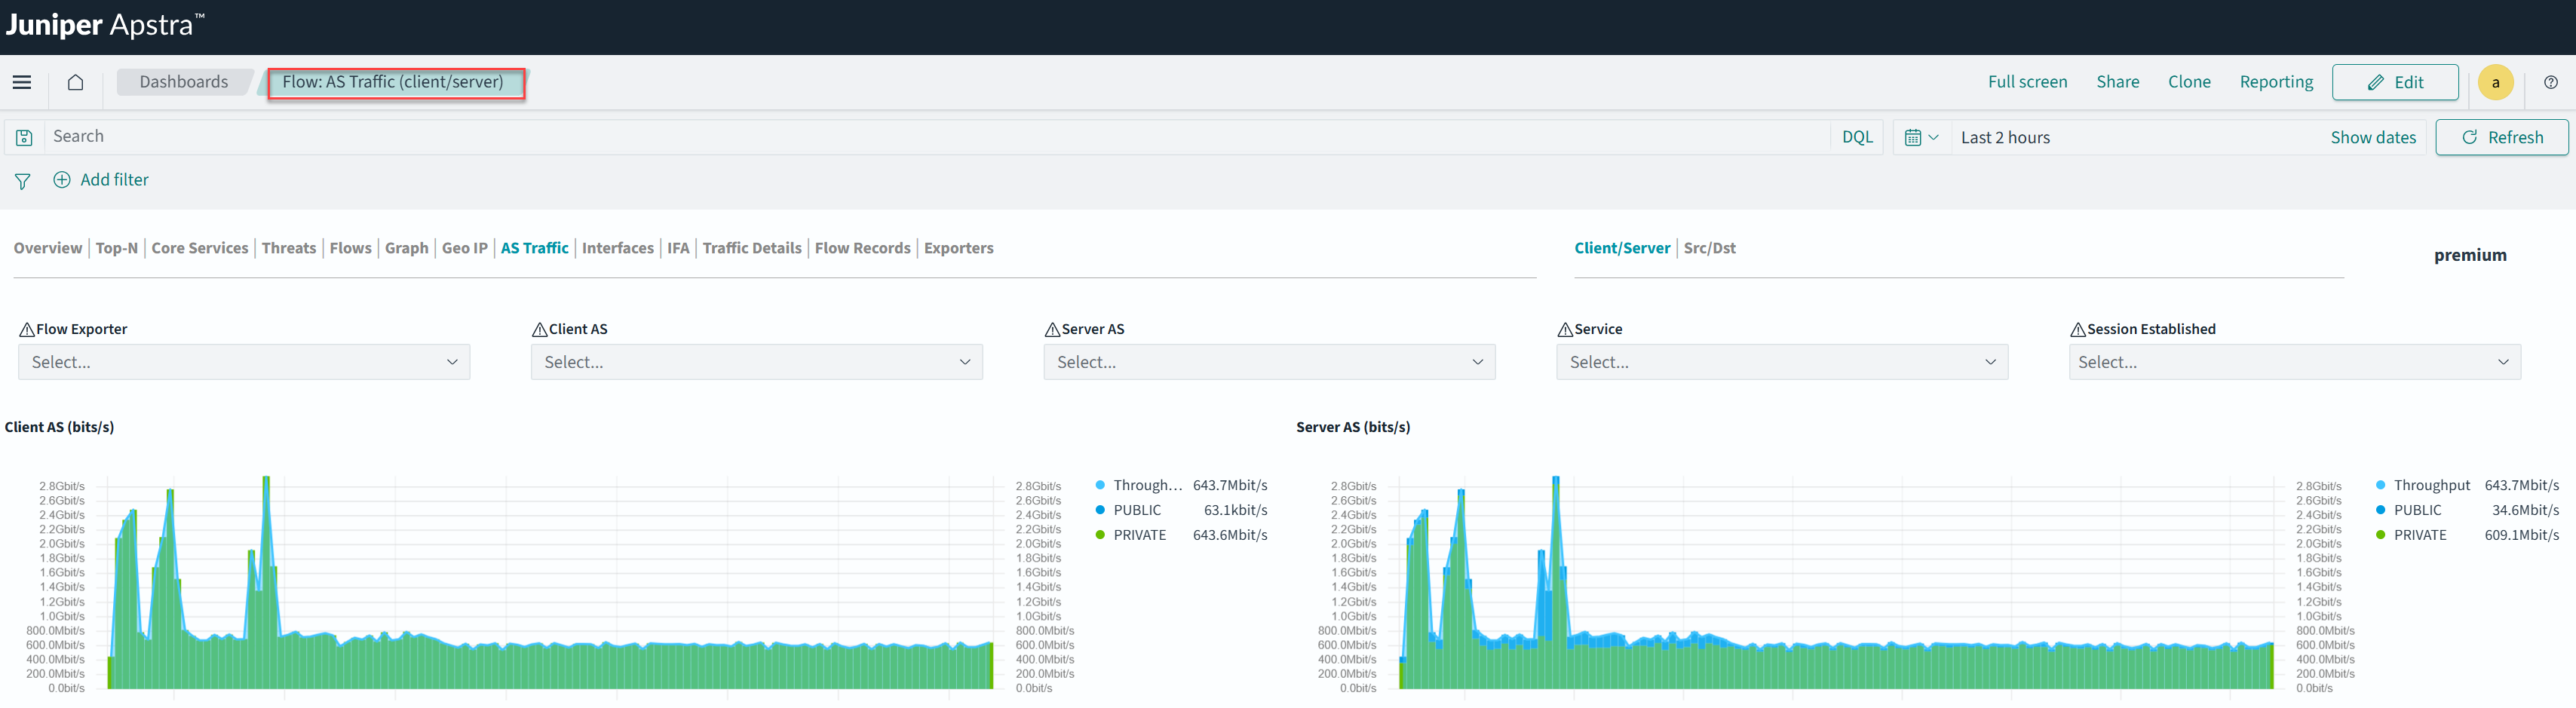
Select a dashboard from the list of predefined dashboards or create a new one. For
example: Flow: AS Traffic (client/server).
-
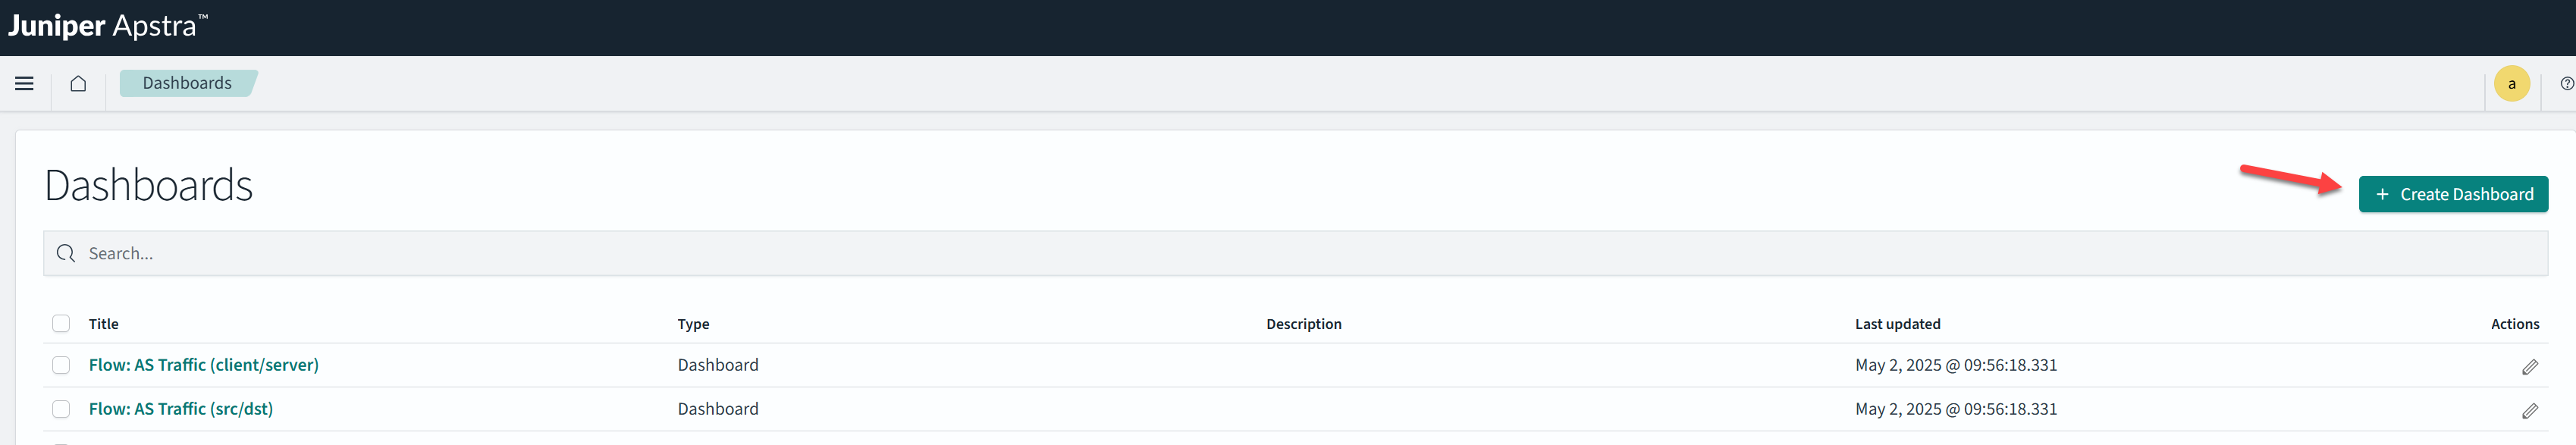
Alternatively, you can add an existing or new object to your dashboard or create a new
one. From the Dashboards page, click Create
Dashboard.
-
Add a new or existing object from the Edit New Dashboard page.
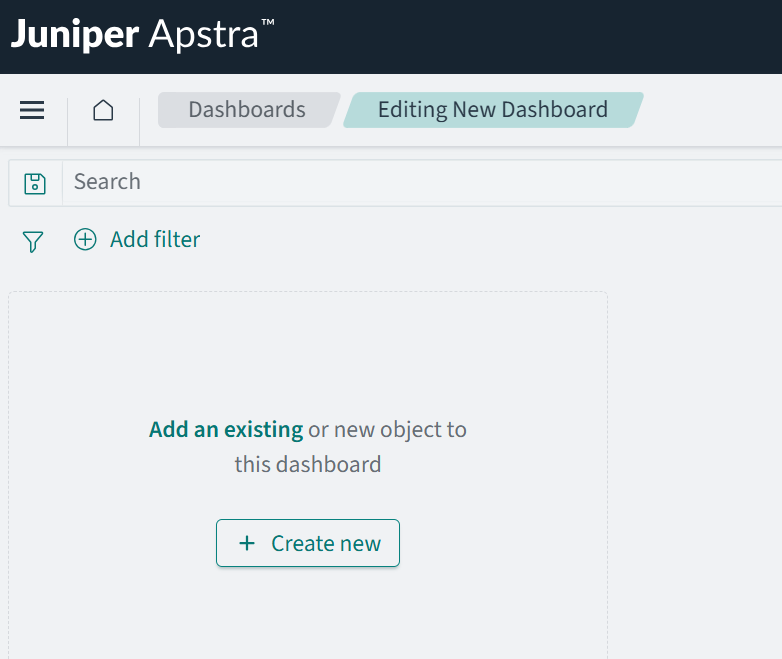
To add an exisiting object, select an object under Add panels.
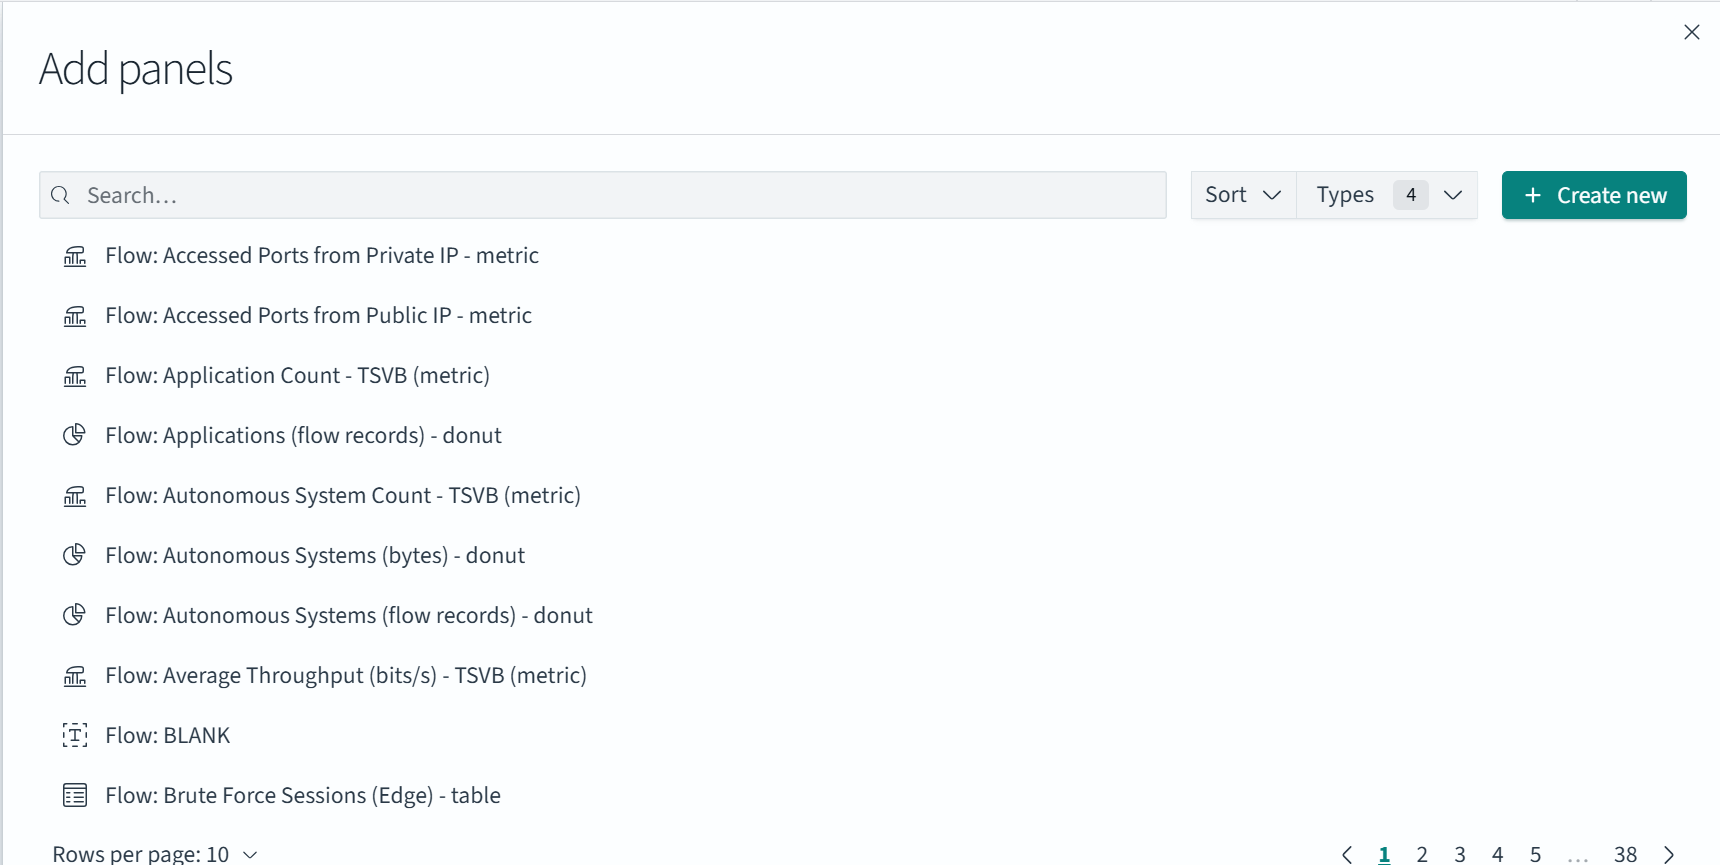
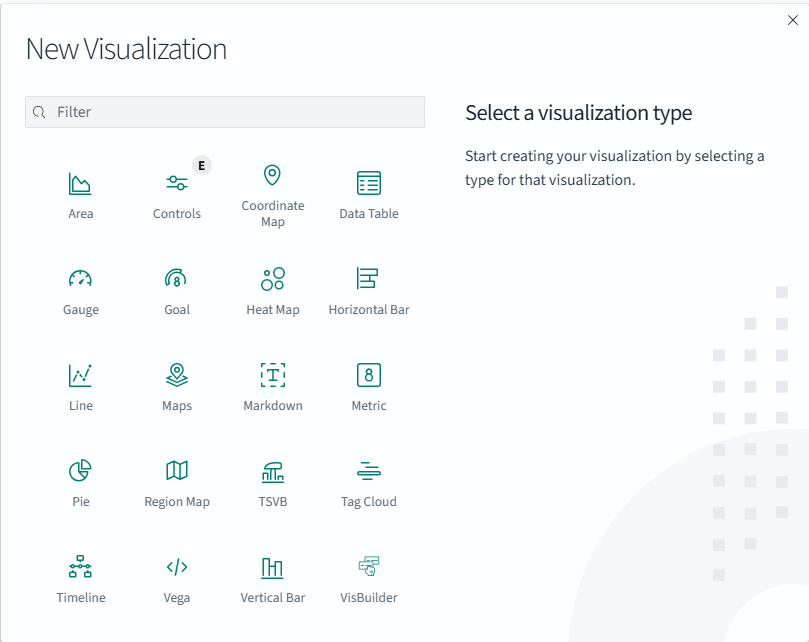
To add a new object, click Create new. Select a visualization type, such as a pie chart or bar graph, and then apply it to a source such as the Flow Records (client-server) type dashboard.
-
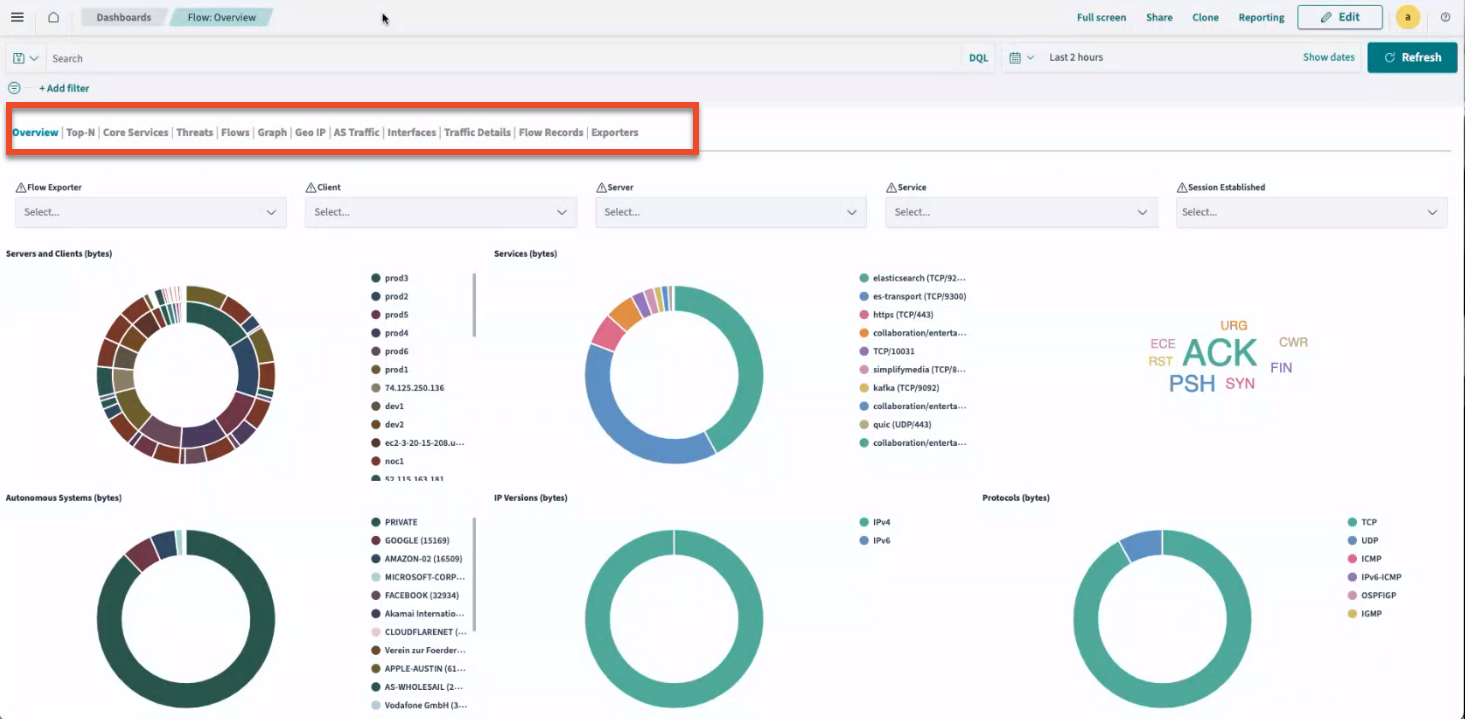
Select Overview from a Dashboard to open the
Flow:Overview dashboard. Each tab in this dashboard provides a
distinct view of your network traffic.
Access the Apstra Flow Dashboard from the Apstra GUI
Although Apstra Flow has its own dashboard, you can also
link directly to the dashboard from the Apstra GUI.
To access the Apstra Flow dashboard from the GUI:
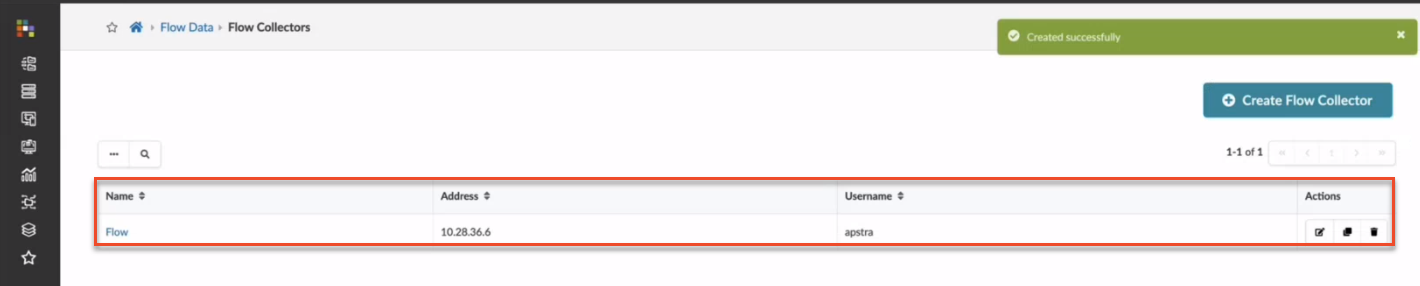
-
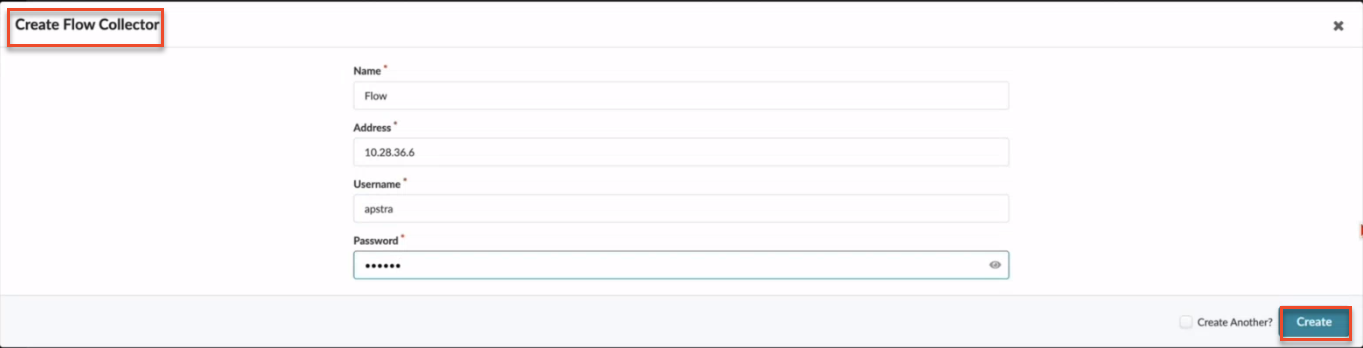
Enter the collector name, IP address, username and password and click Create.
Use the CLI password you used to access the Flow VM.
This information tells Apstra where your VM is located so you can access the flow collector and visualization dashboards.Note: Adding the flow VM allows you to collect show_tech files from Apstra and relevant logs from the flow VM.
-
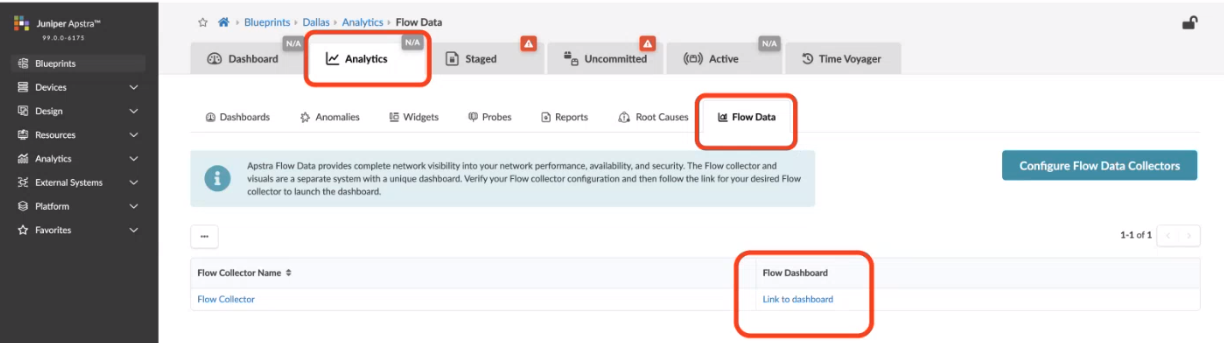
From your blueprint, navigate to Analytics > Flow Data.
Click Link to dashboard to access the Apstra Flow
dashboard.
For more details about Apstra Flow, see the Analytics chapter
in the Juniper Apstra User Guide.