Streaming Guide
Apstra Streaming Plugin Overview
You can configure Apstra to generate Google Protocol Buffer (protobuf) streams for counter data (perfmon), alerts, and events. Each data type is streamed to a receiver over its own TCP socket, maintaining separate connections even if configured for the same receiver. This also allows for all three data types to be sent to three different streaming receivers. You can choose from the many open-source projects, or develop your own solutions to capture, store, and analyze the protobuf data.
Juniper Apstra 5.1 introduces an external execd plugin for Telegraf, called the Apstra Streaming plugin. This plugin is maintained outside of Telegraf’s source code, simplifying telemetry data processing and ensuring compatibility, independent of Telegraf versions.
The plugin provides an effective way to consume telemetry data and integrates seamlessly into the following example telemetry stack, or other telemetry monitoring stacks.
This guide details how to use the plugin with the following example stack, consisting of:
-
A graphical interface based on Grafana (port 3000, username: admin, password: admin)
-
Prometheus for Counters and Alerts (port 9090, username: admin, password: admin)
-
Influxdb for Events (port 8086)
-
2 Collectors, one for each database based on Telegraf.
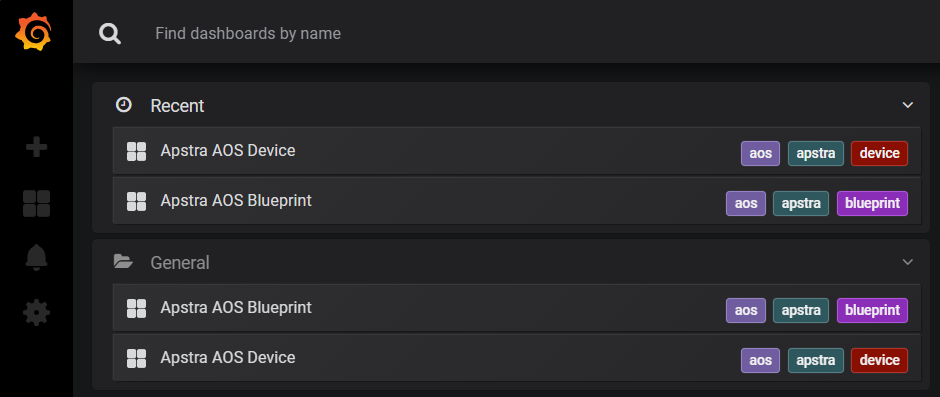
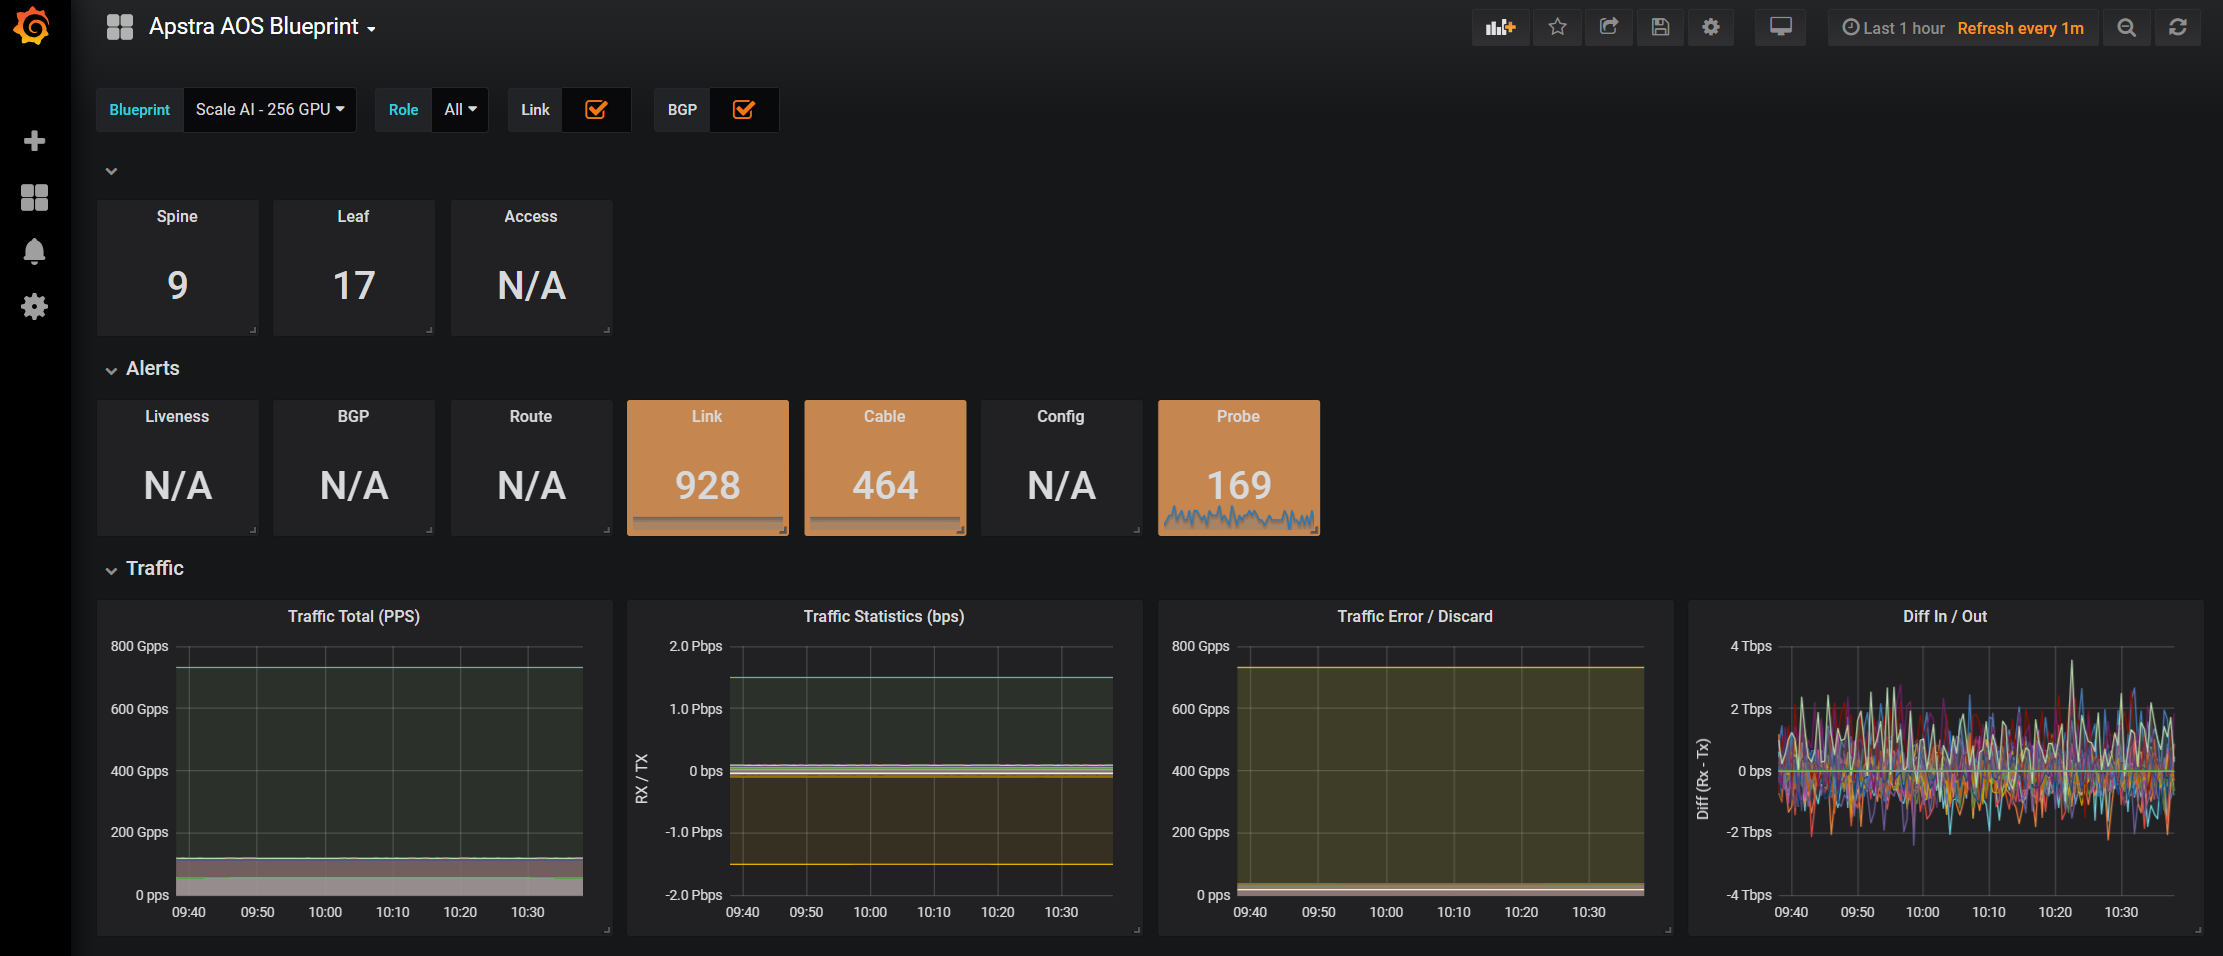
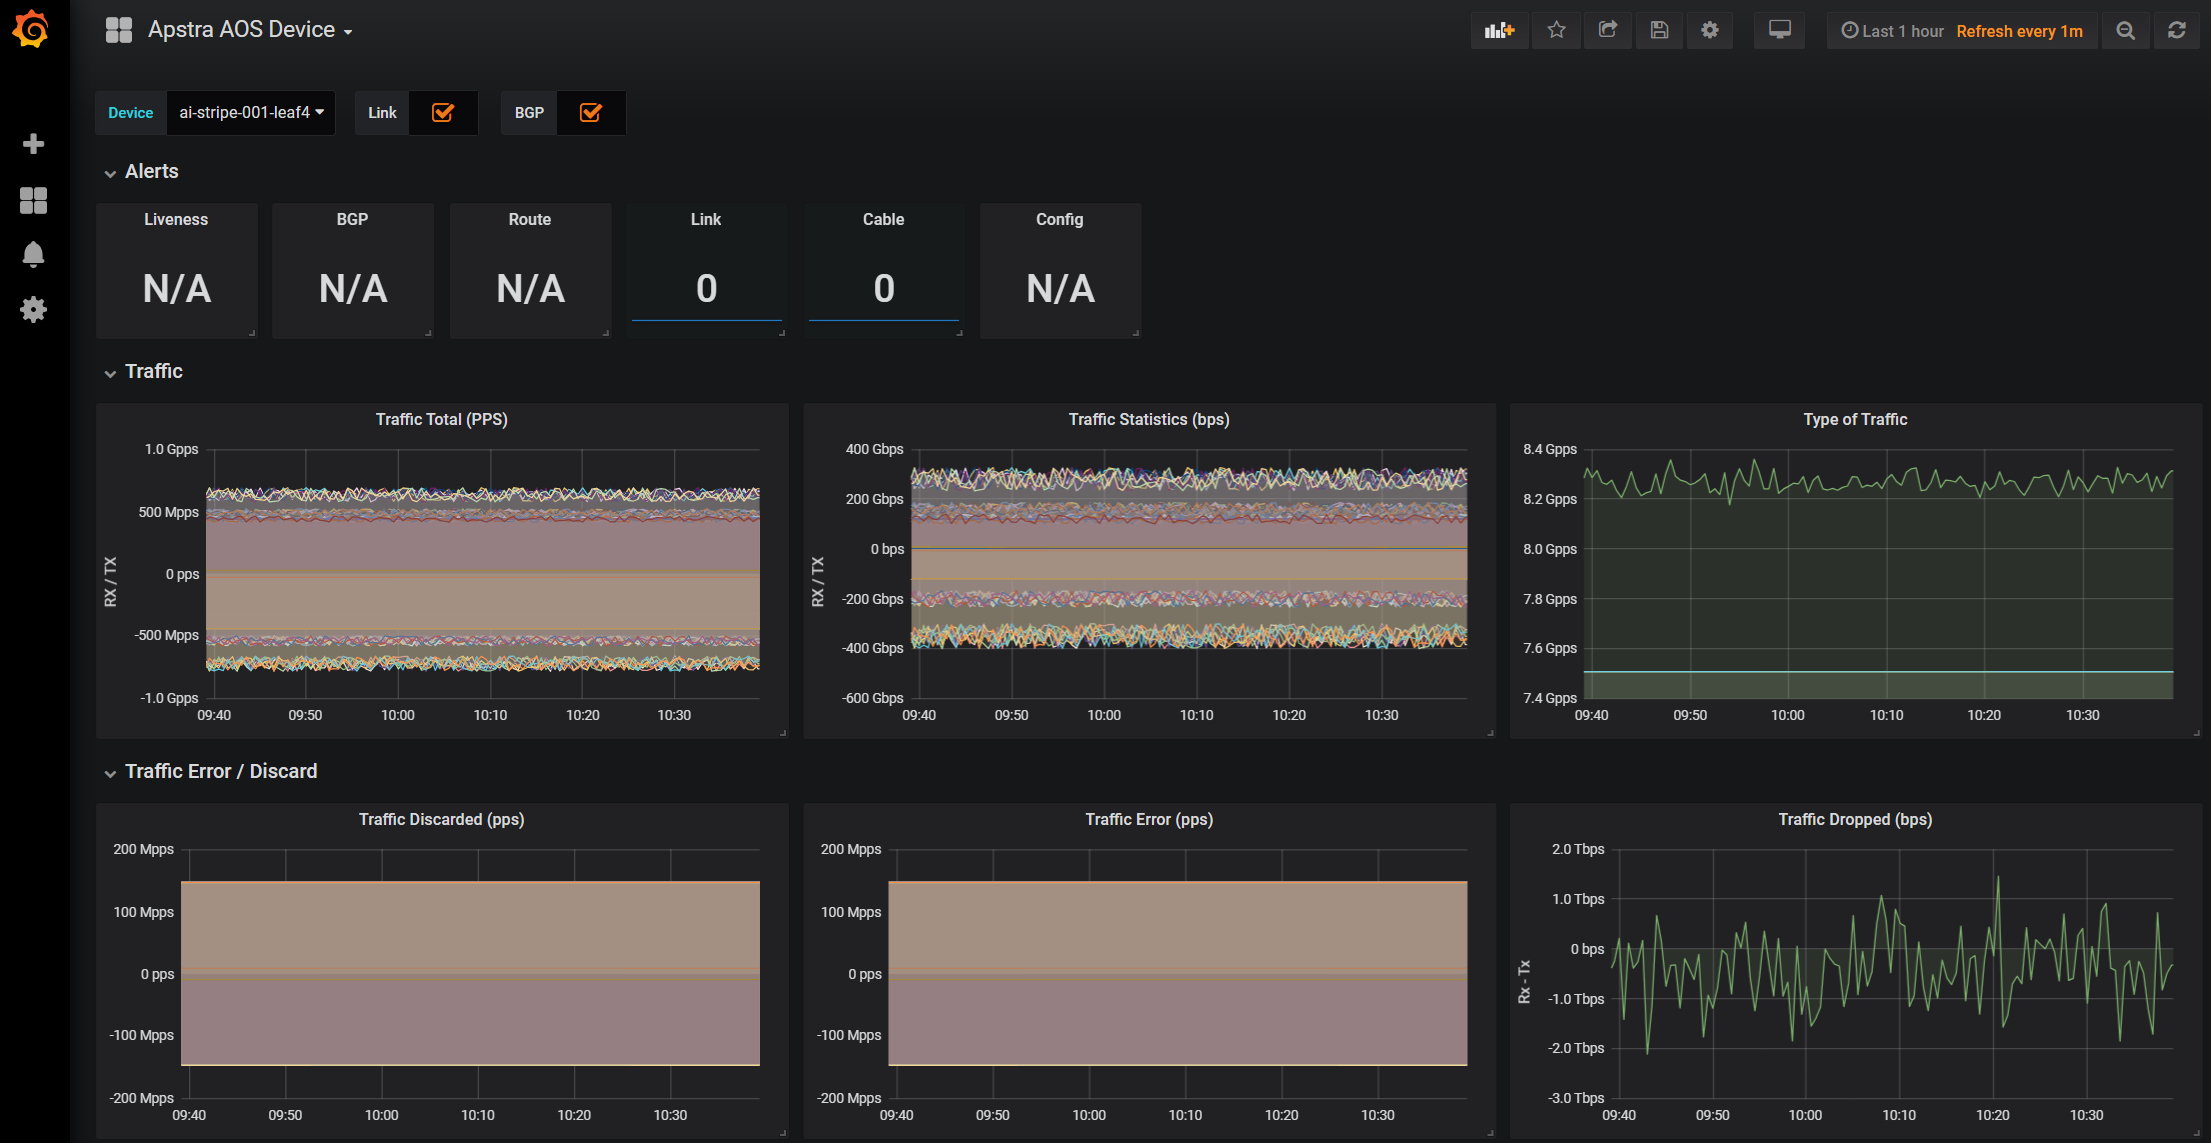
Grafana
From a web browser, enter the URL http://<apstra-streaming>:3000 and enter username admin (default) and password admin (default).
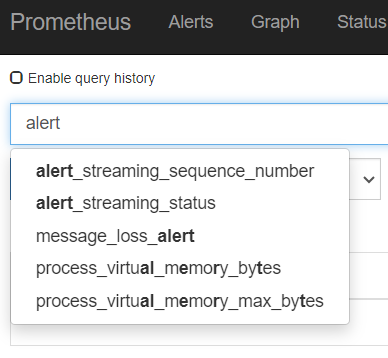
Prometheus
Prometheus is used for alerts and device telemetry counter storage in the Apstra-streaming appliance. From a web browser, enter the URL http://<apstra-streaming>:9090 to access the Prometheus GUI.
apstra-streaming VM. 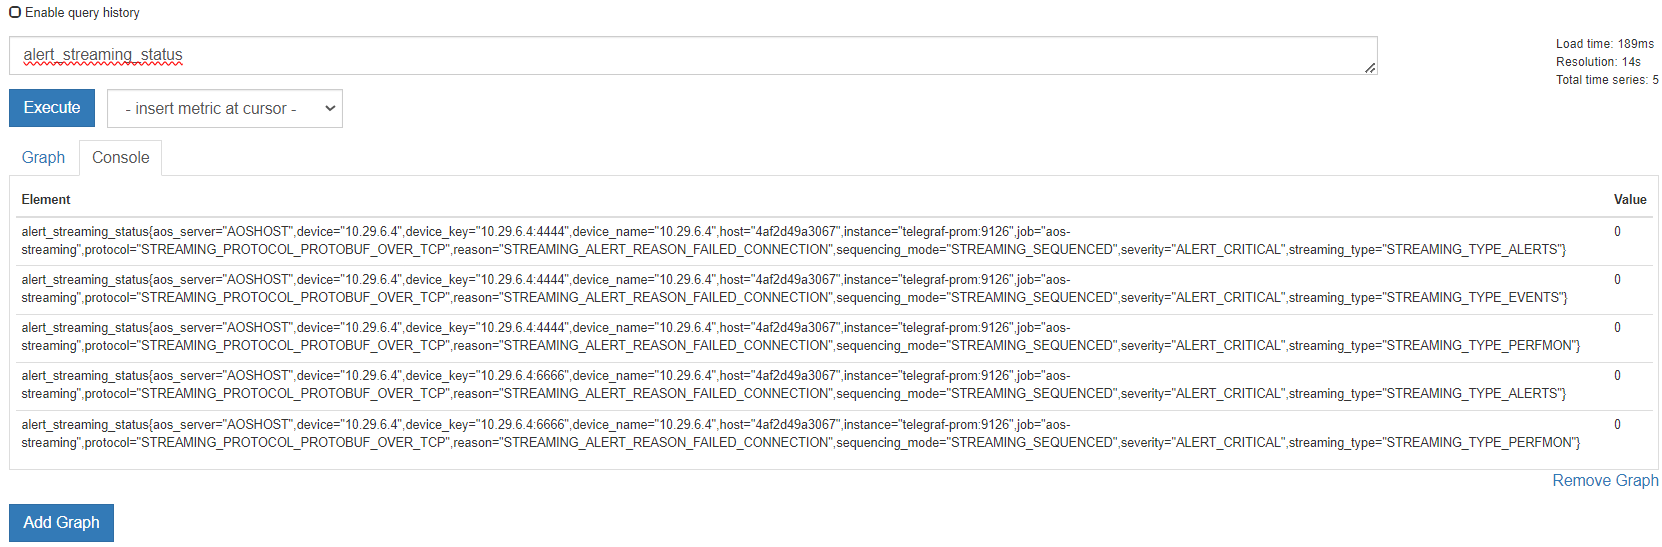
InfluxDB
Per official documentation, the web admin UI of InfluxDB is deprecated as of InfluxDB 1.1. If you want to interact with InfluxDB, we recommend using the CLI. For information about CLI commands, see https://archive.docs.influxdata.com/influxdb/v1.2/tools/shell/.
The example outputs below show the process of accessing the InfluxDB container and running a query for BGP information.
First, we run an -execute command to access the InfluxDB
container, then launch the influx shell.
admin@apstra-streaming:~/apstra-streaming$ docker exec -it apstra-streaming-influxdb-1 /bin/sh
/ # influx
Connected to http://localhost:8086 version 1.8.2
InfluxDB shell version: 1.8.2
After connecting to the InfluxDB container, run a command to view available
databases. In the case of Apstra Streaming, we access the aos
database.
> show databases
name: databases
name
----
aos
> use aos
Using database aos
View the available query sources.
> show measurements
name: measurements
name
----
alert_bgp_neighbor_mismatch
alert_cable_peer_mismatch
alert_hostname
alert_interface_link_status_mismatch
alert_liveness
alert_probe
event_bgp_neighbor
event_cable_peer
event_device_state
event_link_status
event_route_state
file_info
interface_counters
message_loss
process_info
system_info
In our example, we query alert_bgp_neighbor_mismatch.
> select * from "alert_bgp_neighbor_mismatch" limit 3
name: alert_bgp_neighbor_mismatch
time                actual_state        addr_family blueprint          blueprint_id                  device device_key   device_name expected_state host         lcl_asn lcl_hostname lcl_ipaddr   rmt_asn rmt_ipaddr   rmt_name            role       sequence_number severity       status vrf_name
----                ------------        ----------- ---------          ------------                  ------ ----------   ----------- -------------- ----         ------- ------------ ----------   ------- ----------   --------            ----       --------------- --------       ------ --------
1734565172926944082 BGP_SESSION_MISSING IPV4        Scale AI - 256 GPU rack-based-blueprint-9fbd2c05 spine5 0EAE163A0001 spine5      BGP_SESSION_UP 19ea2055515c 504     spine5       172.10.0.158 523     172.10.0.159 ai-stripe-002-leaf8 spine_leaf 3044            ALERT_CRITICAL 1      default
1734565172926961686 BGP_SESSION_MISSING IPV4        Scale AI - 256 GPU rack-based-blueprint-9fbd2c05 spine5 0EAE163A0001 spine5      BGP_SESSION_UP 19ea2055515c 504     spine5       172.10.0.150 519     172.10.0.151 ai-stripe-002-leaf4 spine_leaf 3045            ALERT_CRITICAL 1      default
1734565172926976718 BGP_SESSION_MISSING IPV4        Scale AI - 256 GPU rack-based-blueprint-9fbd2c05 spine5 0EAE163A0001 spine5      BGP_SESSION_UP 19ea2055515c 504     spine5       172.10.0.152 520     172.10.0.153 ai-stripe-002-leaf5 spine_leaf 3046            ALERT_CRITICAL 1      default
>
Configure Apstra-Streaming
To configure Apstra telemetry streaming as part of this example stack, you'll
edit variables.env, run the make
start command, and restart the containers. No Apstra server
configuration is required.
The Telegraf project connects to the Apstra API and posts an IP:Port that Apstra uses to stream realtime telemetry data back to.
Reconfigure Apstra Streaming after Apstra Server Upgrade
After you upgrade the Apstra server, you must reconfigure the
apstra-streaming VM to ensure a proper streaming
connection.
Build Apstra-Streaming VM (Optional)
You can build your own apstra-streaming VM, which is a Docker
container. The following steps show you how to set up a basic Docker server.
Install Ubuntu 24.04.1
Download the Ubuntu 24.04.1 ISO and provision a new VM. The default username is admin and the password is admin.
For larger blueprints, we recommend changing RAM to at least 8GB and CPU to at least 2 vCPU. More disk space may also be required.
|
Resource |
Quantity |
|---|---|
|
Ram |
8GB |
|
CPU |
2 vCPU |
|
Network |
1 vNIC |
Install Packages
Install required packages, based on Ubuntu 24.04.1
apt-get update
Update the system to ensure all packages are up to date.
apt-get install docker docker-compose git make curl openssh-server
Add the Apstra user to the Docker group. This allows ‘apstra-streaming' to make Docker configuration changes without having to escalate to sudo.
admin@ubuntu:~/apstra-streaming$ sudo usermod -aG docker apstra-streaming
Log out and log back in again for ‘apstra-streaming’ user to be properly added to the group.
Download the Apstra plugin from the Juniper Downloads site, under Apstra 5.1. Untar the Apstra streaming image files.
wget -O "<juniper-plugin-download-link>"
tar -xzf apstra-telegraf-plugin.gz
Create a softlink (apstra-telegraf-plugin) to the uncompressed
image. This ensures that you can use the same
apstra-telegraf-plugin image name across newer image
versions. If there are any existing images in your directory, delete them and
create a new softlink to refer to the newest image.
admin@apstra-streaming:~/apstra-streaming$ ln -s apstra-telegraf-plugin apstra-telegraf-plugin-5.1.0-26
Set Container Restart Policy
The Apstra streaming package does not set the Docker restart policy; this is up
to your orchestration toolchain. Open
apstra-streaming/docker-compose.yml and add
restart: always to each of the service directives. This
ensures that Docker containers are online after a service reboot.
admin@apstra-streaming:~/apstra-streaming$ vi docker-compose.yml
version: '2'
services:
# -------------------------------------------------------------------------
# Kibana
# -------------------------------------------------------------------------
  kibana:
    image: docker.elastic.co/kibana/kibana:7.3.2
    environment:
      SERVER_NAME: kibana
      ELASTICSEARCH_URL: http://elasticsearch:9200
    depends_on:
      - elasticsearch
    ports:
      - "5601:5601"
    restart: always

# -------------------------------------------------------------------------
# elasticsearch
# -------------------------------------------------------------------------
  elasticsearch:
    image: docker.elastic.co/elasticsearch/elasticsearch:7.3.2
    volumes:
     - /etc/localtime:/etc/localtime
    environment:
     - "discovery.type=single-node"
     - "xpack.security.enabled=false"
    ports:
     - "9200:9200"
     - "9300:9300"
    restart: always

# -------------------------------------------------------------------------
# Telegraf - Elasticsearch
# -------------------------------------------------------------------------
  telegraf-elasticsearch:
    image: telegraf:1.31.3
    command: telegraf -debug
    env_file:
      - variables.env
    volumes:
      - type: bind
        source: ./apstra-telegraf-plugin
        target: /apstra-telegraf-plugin
        read_only: true
      - ./config/telegraf-es.toml:/etc/telegraf/telegraf.conf
      - ./config/telegraf-es-plugin.toml:/etc/telegraf/apstra-telegraf-plugin.conf
      - /etc/localtime:/etc/localtime
    depends_on:
      - elasticsearch
    ports:
        - '7777:7777'
    restart: always
Follow the steps in the Configure
Apstra Streaming section to set up variables.env and
start the containers.
Change System Hostname
Modify /etc/hostname to apstra-streaming, and change the
loopback IP in /etc/hosts to apstra-streaming from
ubuntu.
Troubleshooting
You can run the following commands to monitor the health of your environment.
Check for Logs from Apstra to the Apstra-streaming VM
Check docker logs.
docker logs apstra-streaming-telegraf-influx-1
You should see a blueprint ID, and some influxdb "write" events when telemetry events occur on AOS - BGP, liveness, config deviation...etc.
Verify Containers are Running
Ensure that all expected containers are running.
admin@apstra-streaming:~/apstra-streaming$ docker ps
CONTAINER ID   IMAGE                                                      COMMAND                  CREATED      STATUS      PORTS                                                                                  NAMES
09b92ed3c57b   docker-registry-ng:5000/streaming/telegraf:1.31.3          "/entrypoint.sh tele…"   3 days ago   Up 3 days   8092/udp, 0.0.0.0:4444->4444/tcp, :::4444->4444/tcp, 8125/udp, 8094/tcp                apstra-streaming-telegraf-influx-1
b91695b1076d   docker-registry-ng:5000/streaming/telegraf:1.31.3          "/entrypoint.sh tele…"   3 days ago   Up 3 days   8092/udp, 0.0.0.0:6666->6666/tcp, :::6666->6666/tcp, 8125/udp, 8094/tcp                apstra-streaming-telegraf-prom-1
013e22faf918   telegraf:1.31.3                                            "/entrypoint.sh tele…"   8 days ago   Up 8 days   8092/udp, 0.0.0.0:7777->7777/tcp, :::7777->7777/tcp, 8125/udp, 8094/tcp                apstra-streaming-telegraf-elasticsearch-1
3f8f06d80f97   docker.elastic.co/kibana/kibana:7.3.2                      "/usr/local/bin/dumb…"   8 days ago   Up 8 days   0.0.0.0:5601->5601/tcp, :::5601->5601/tcp                                              apstra-streaming-kibana-1
23b2db25200c   docker.elastic.co/elasticsearch/elasticsearch:7.3.2        "/usr/local/bin/dock…"   8 days ago   Up 8 days   0.0.0.0:9200->9200/tcp, :::9200->9200/tcp, 0.0.0.0:9300->9300/tcp, :::9300->9300/tcp   apstra-streaming-elasticsearch-1
9e1264766799   docker-registry-ng:5000/streaming/grafana/grafana:5.4.3    "/run.sh"                8 days ago   Up 8 days   0.0.0.0:3000->3000/tcp, :::3000->3000/tcp                                              apstra-streaming-grafana-1
c8a3c277e1fb   docker-registry-ng:5000/streaming/prom/prometheus:v2.4.3   "/bin/prometheus --c…"   8 days ago   Up 8 days   0.0.0.0:9090->9090/tcp, :::9090->9090/tcp                                              apstra-streaming-prometheus-1
d8f18529f51b   docker-registry-ng:5000/streaming/influxdb:1.8.2-alpine    "/entrypoint.sh infl…"   8 days ago   Up 8 days   0.0.0.0:8086->8086/tcp, :::8086->8086/tcp                                              apstra-streaming-influxdb-1