Interface Queue Stats Monitoring Probe
Introduction
Version 6.0 introduces a predefined probe, called the Interface Queue Stats Monitoring Probe. The probe is designed for granular interface-level monitoring. The probe collects and monitors interface metrics to determine whether your AI fabric is delivering lossless Ethernet service (lossless packet delivery). Lossless Ethernet is required for an AI fabric using RDMA over Converged Ethernet version 2 (ROCEv2) protocol. The probe is designed to help you verify lossless operation by continuously tracking crucial congestion and loss metrics for the interfaces and queues in the fabric.
For more information about lossless Ethernet and RDMA, see AI/ML Data Center Networking on Ethernet.
Probe Overview
The Interface Queue Stats Monitoring Probe collects and reports metrics like transmitted Explicit Congestion Notification (ECN) packets, Priority Flow Control (PFC) signals, buffer utilization, and packet drop ratio, on a per-interface, per-queue basis. These metrics are crucial for verifying that the AI fabric is delivering lossless Ethernet in production.
The probe also stores time series data (default 14 days) for a historical view for analysis and troubleshooting. The probe provides detailed metrics on queue behavior, including:
- Transmitted ECN: ECN packets are transmitted via network devices, allowing them to signal potential congestion to sending devices, enabling them to reduce their transmission rates before packets are dropped.
- PFC: A link-level flow control mechanism that can pause transmission of packets based on specific traffic classes (Class of Service) to prevent buffer overflow and packet loss in lossless networks.
- Buffer utilization: How "full" a network device's packet buffer queue is at any given time. High buffer utilization typically signals potential congestion or microbursts.
- Packet drops: The number of packets dropped by a network device due to congestion or buffer utilization overflow.
Fore more information about ECN, see CoS Explicit Congestion Notification.
For more information about PFC, see Understanding Priority-Based Flow Control.
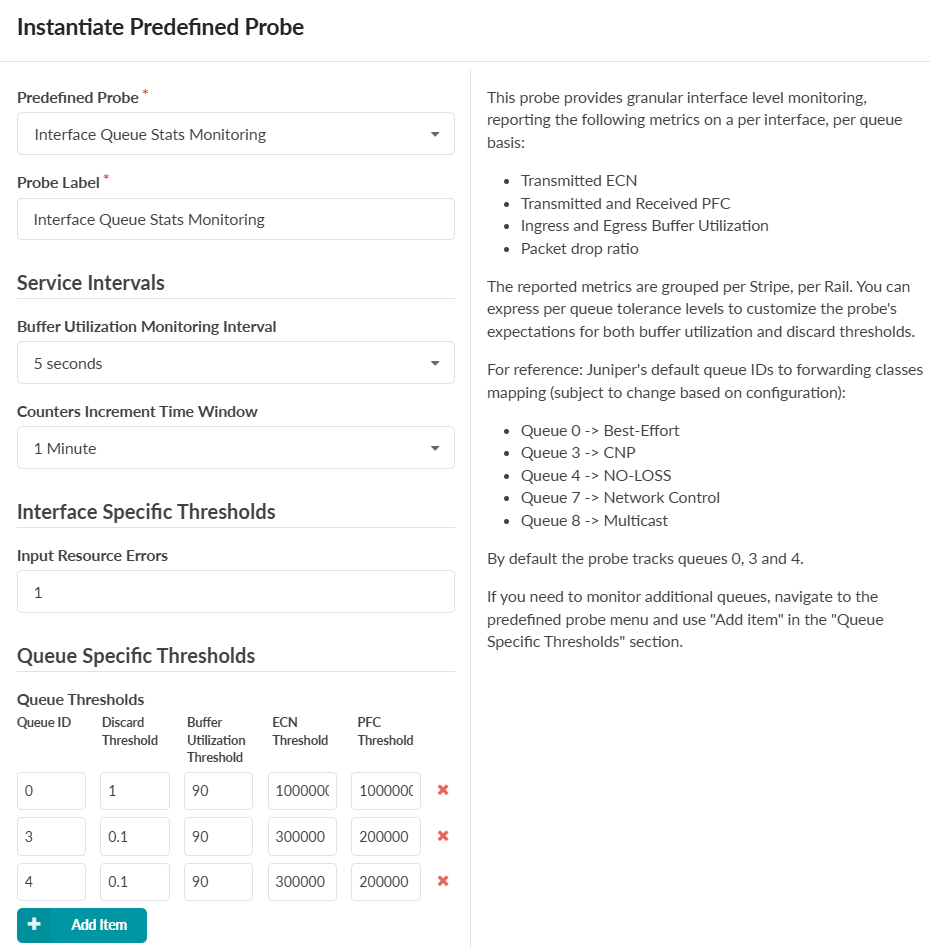
Probe Settings
|
Setting |
Descriptrion |
|---|---|
|
Probe Label |
The name of the probe |
|
Buffer Utilization Monitoring Interval |
The frequency at which the probe collects buffer utilization metrics. |
|
Counters Increment Time Window |
The period over which counter increments (like packet drops or ECN packets) are measured and aggregated. |
|
Input Resource Errors |
The threshold for input resource errors (packet drops) on an interface before raising an alert. |
|
Number of Queues |
The number of queues the probe monitors on the network interface. The default value is 3. |
|
Queue Thresholds |
Individual queue thresholds. The default values are displayed in the first row.
|
|
Utilization Monitoring Interval |
The interval at which the probe checks interface queue utilization. The default value is 5 seconds. |
|
Counters Increment Time Window |
The time period over which interface counter increments are measured. |
|
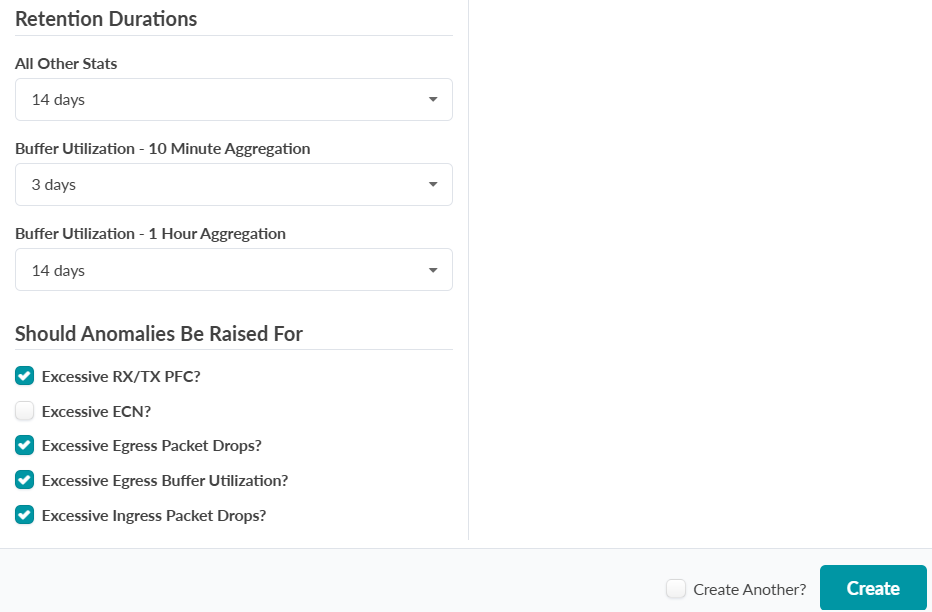
Retention Durations |
The duration for which interface stats are stored. You can set different durations for buffer utilization at different aggregation levels. |
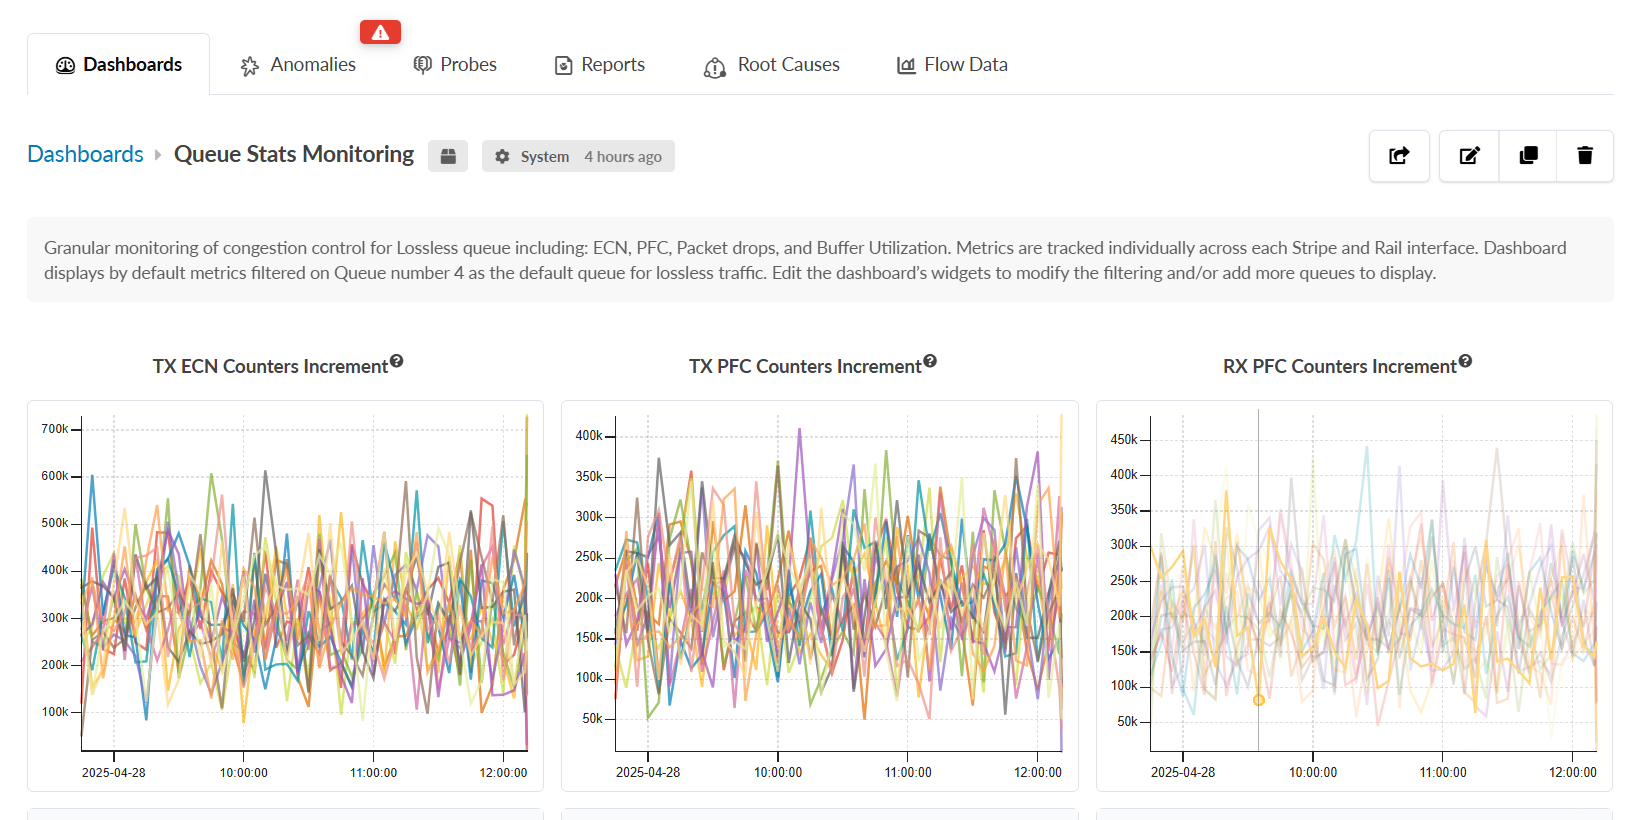
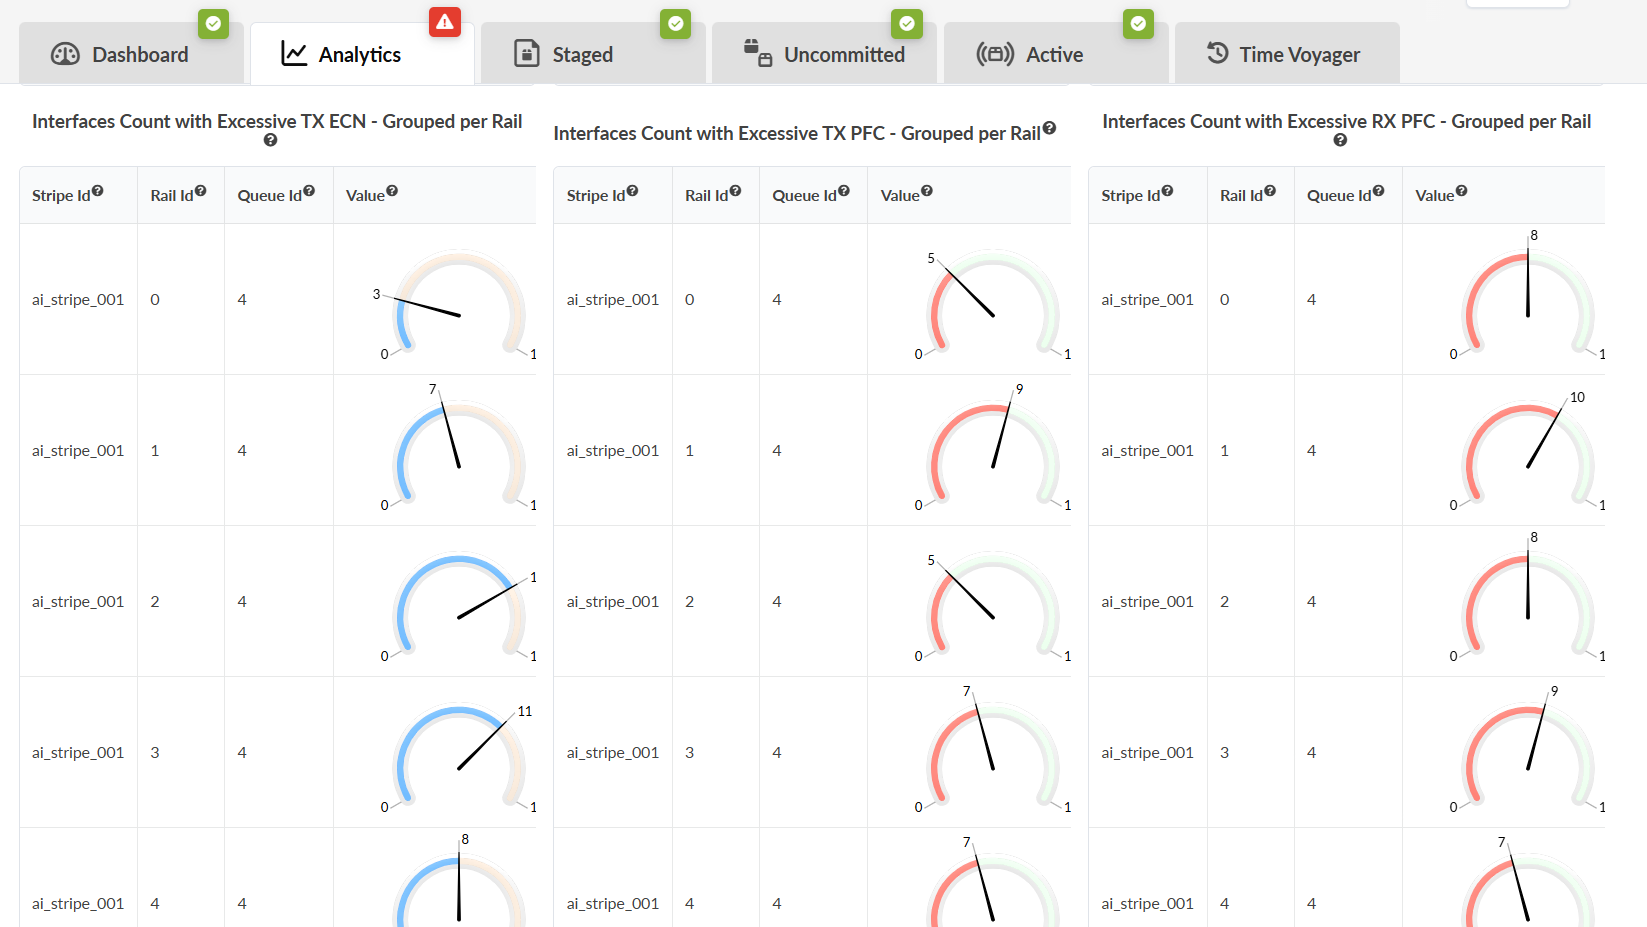
Queue Stats Monitoring Dashboard
The Queue Stats Monitoring dashboard visualized probe data. To view the dashboard within your blueprint, navigate to Analytics > Dashboards. The dashboard provides the following features:
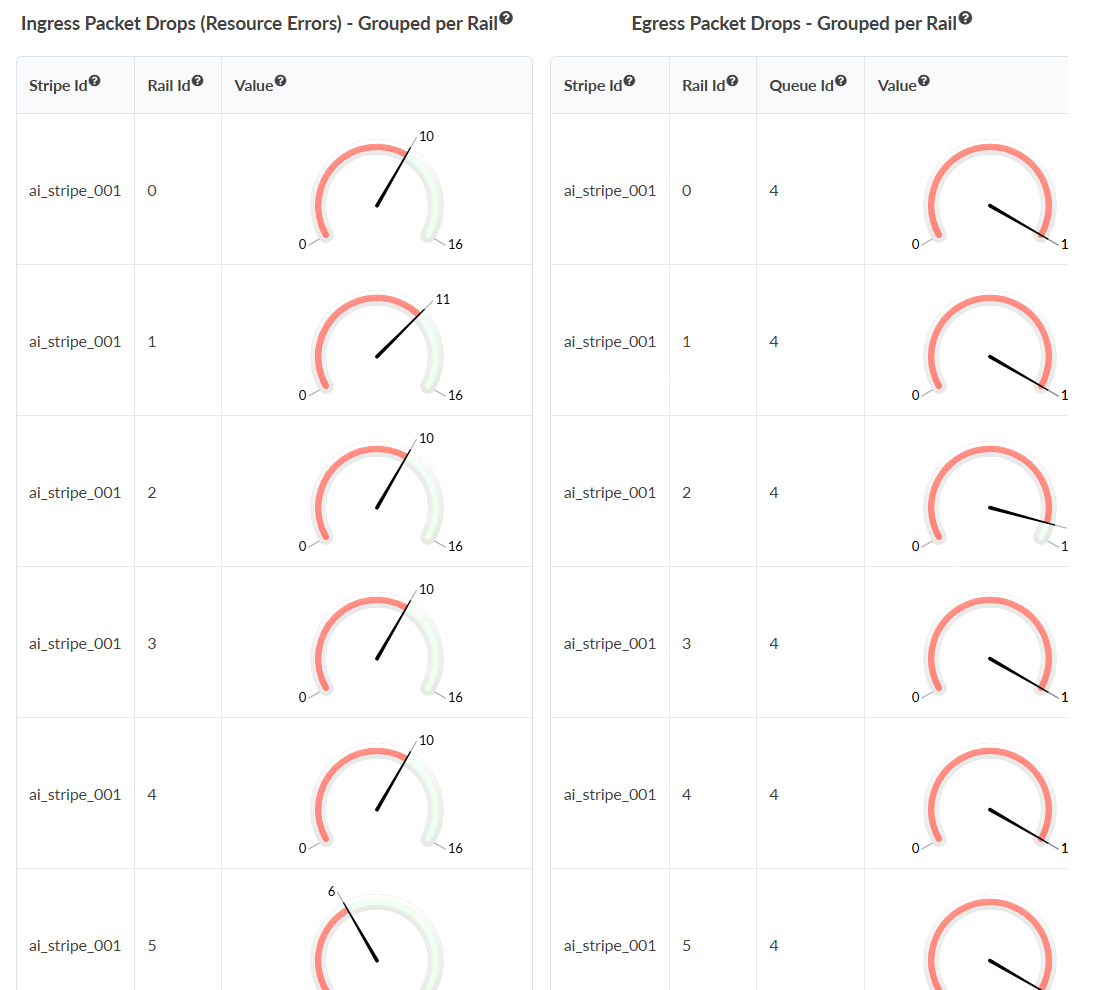
ECN and PFC increments
Excessive PFC events per Rail
Buffer utilization and packet drops
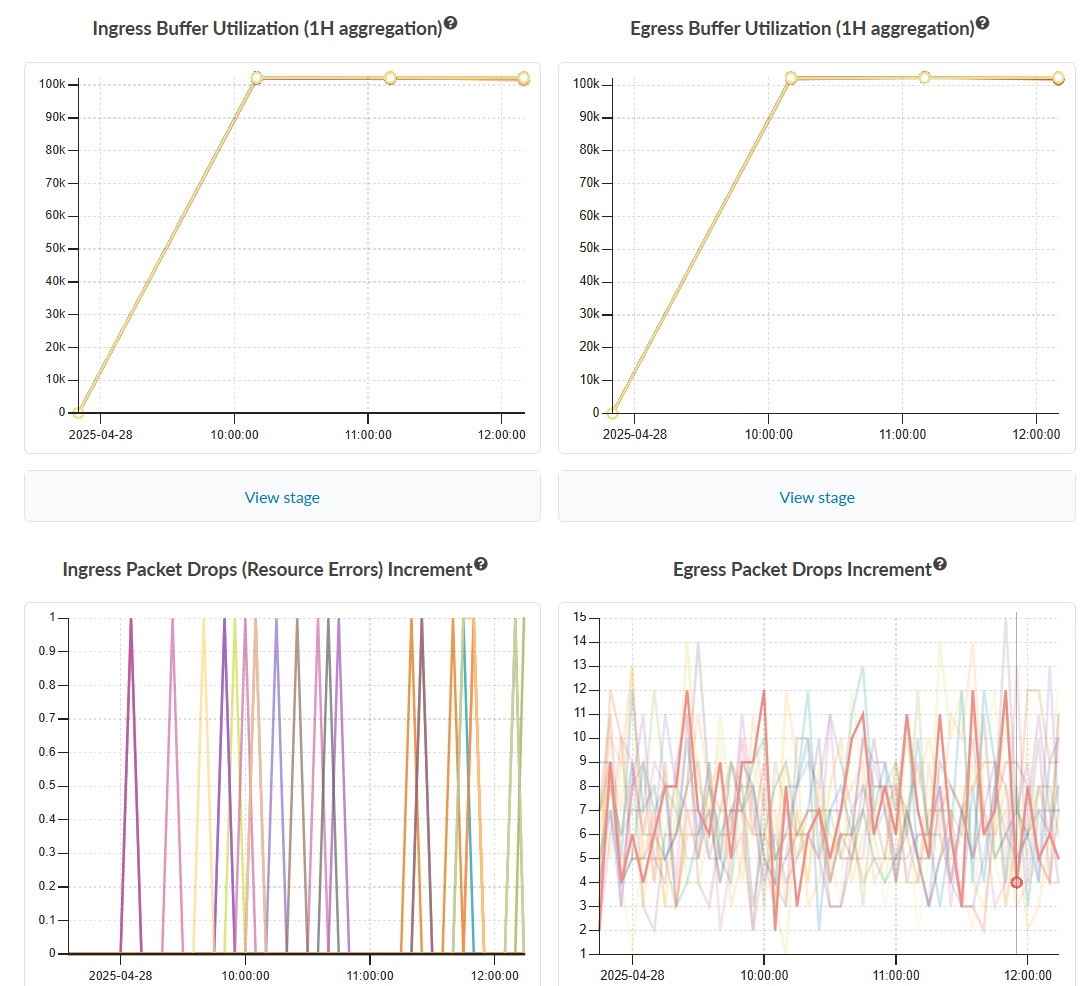
Packet drops per Rail