GPU Hardware Traffic Monitoring Probe
Introduction
The GPU Hardware Traffic Monitoring probe is designed to monitor critical RDMA over Converged Ethernet (RoCEv2) counters on GPU NIC interfaces to help identify traffic managements issues, such as congestion. The probe monitors critical network performance metrics that affect the performance and downtime of AI workloads.
The probe detects congestion by monitoring Out of Sequence (OOS) packets and Congestion Notification Packets (CNP), which are key indicators of GPU network performance in Remote Direct Memory Access (RDMA) environments. By monitoring these conditions, you can quickly identify and resolve congestion issues on the NVIDIA GPU NICs, like data corruption, errors, and performance issues, ensuring optimal network performance and reducing downtime.
Probe Overview
The GPU Hardware Traffic Monitoring probe collects and analyzes data directly from NVIDIA GPU NICs. The probe closely monitors:
-
Out of Sequence (OOS) packets: Both detected and received OOS packets. OOS packets are packets that arrive in a different order than they were sent. This is usually because the fabric has a load balancing policy that is set too aggressively for the NICs. Most standard NICs expect packets in order, so out-of-order packets can cause delays or performance issues. Some newer NICs can handle reordering. Aggressive load balancing policies increase the chance of OOS packets, especially on devices that can’t reorder them. It is important to alert users when their load balancing settings might cause OOS packets and impact network performance.
-
Congestion Notification Packets (CNP): CNPs help manage network congestion by signaling when traffic needs to slow down. When network devices detect traffic nearing a congestion threshold (usually around 55%), they mark certain packets with Explicit Congestion Notification (ECN). These marked packets reach their destination, like a GPU server, which then sends a CNP packet back to the original sender (such as another GPU node). When the sender receives this CNP, it reduces its throughput by 50% to help minimize congestion.
The probe works by collecting 30 MLX5 Linux hardware counters.These counters are relevant to RDMA traffic over both Ethernet and InfiniBand. These hardware-level counters provide visibility into networking conditions that standard network monitoring tools might not capture, especially for workloads using RDMA technologies like RDMA over Converged Ethernet version 2 (ROCEv2).
For more information about these counters, see Understanding mlx5 Linux Counters and Status Parameters.
For more information about RDMA and ROCEv2 in the AI data center, see AI/ML Data Center Networking on Ethernet.
Data collected by the probe is stored for 14 days by default, enabling real-time monitoring and historical trend analysis.
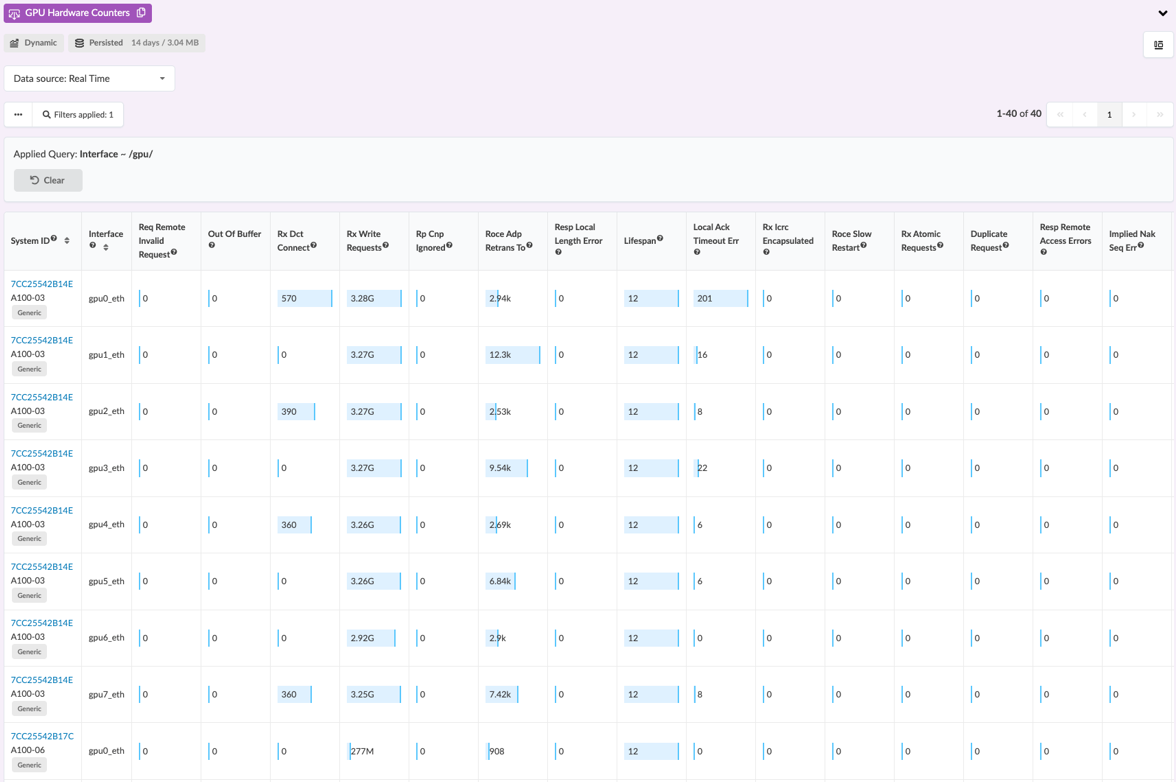
GPU Hardware Counters
The GPU Hardware Traffic Monitoring probe uses the following telemetry services that monitor NVIDIA MLX5 hardware counters:
- Gpu_Hardware_Counters Service: This service closely monitors the following metrics,
which are defined in official documentation here: Understanding mlx5 Linux Counters and Status
Parameters.
- packet_seq_err
- out_of_sequence
- np_cnp_sent
- rp_cnp_handled
- out_of_buffer
-
Gpu_Infiniband_Dev_To_Interface Service: This service maps GPU hardware counters to their associated Infiniband interfaces. It correlates counter information like CPU and memory utilization with GPU NIC metrics.
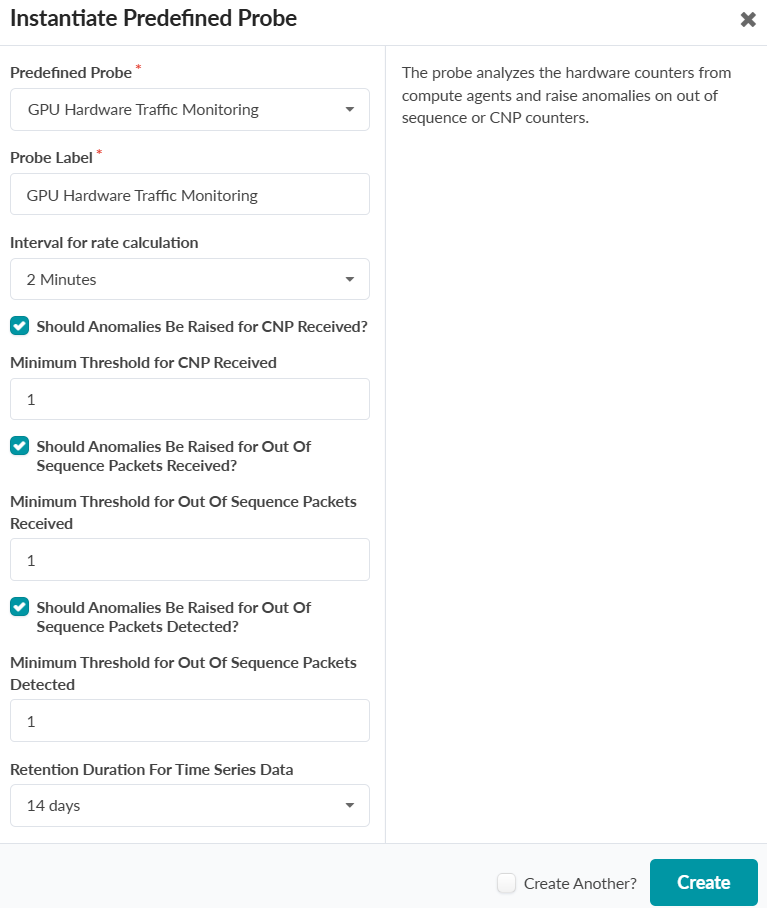
Probe Settings
|
Setting |
Description |
|---|---|
|
Probe Label |
Name of the probe |
|
Interval for rate calculation |
The sampling interval. The default value is 2 minutes. |
|
Should Anomalies Be Raised for CNP Received? |
When enabled, the probe raises alerts when CNP thresholds are exceeded |
|
Minimum Threshold for CNP Received |
The minimum number of CNPs that will trigger an anomaly alert. The default value is 1. |
|
Anomaly detection for Out Of Sequence Packets Received |
When enabled, the probe raises an alert on out of sequence packets at the receiver |
|
Minimum Threshold for Out Of Sequence Packets Received |
Sets the minimum threshold count to trigger an alert for OOS packets at the receiver. The default value is 1. |
|
Should Anomalies Be Raised for Out Of Sequence Packets Detected? |
When enabled, the probe raises an alert for OOS packets detected |
|
Minimum Threshold for Out Of Sequence Packets Detected |
The minimum count threshold to trigger an OOS packets detected alert. The default value is 1. |
|
Retention Duration For Time Series Data |
How long the system stores historical data. The default value is 14 days. |
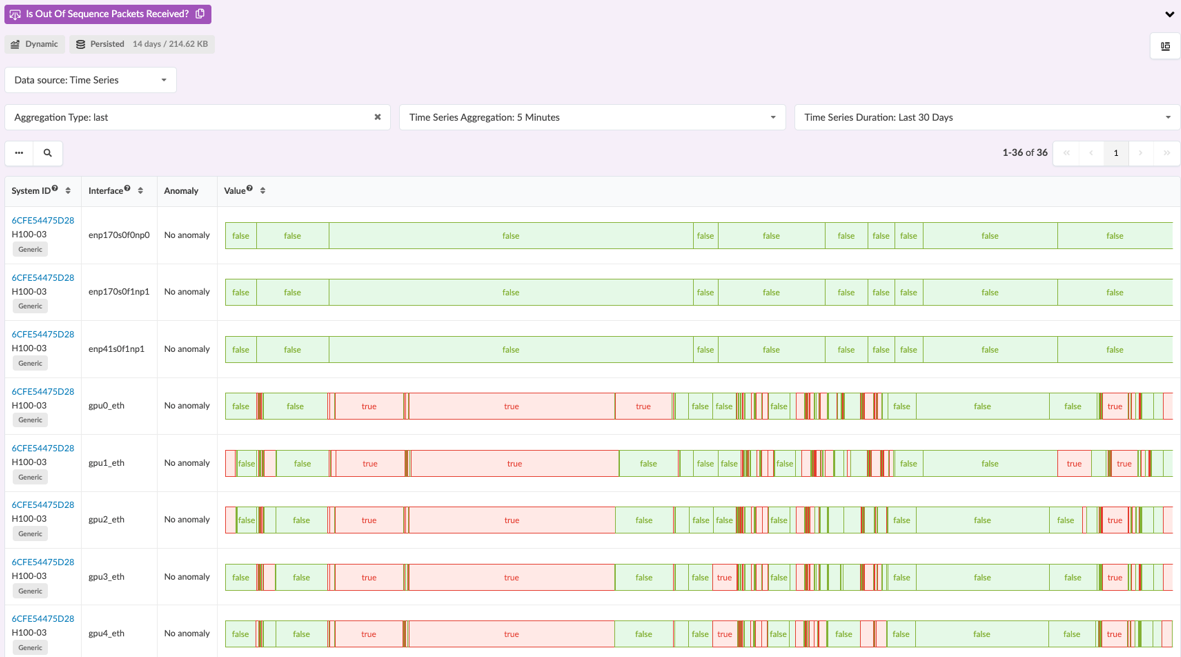
GPU Monitoring Dashboard
The GPU Monitoring Dashboard provides an intuitive way to view GPU NIC traffic management health and statistics. The dashboard visualizes real-time and historical GPU NIC metrics. You can drill down into specific GPU interfaces for more information.
The dashboard is displayed in your blueprint under Analytics > Dashboards.
The dashboard includes widgets for the following data sources:
-
Out of Sequence Packets Detected
-
Out Of Sequence Packets Received
-
CNP Received
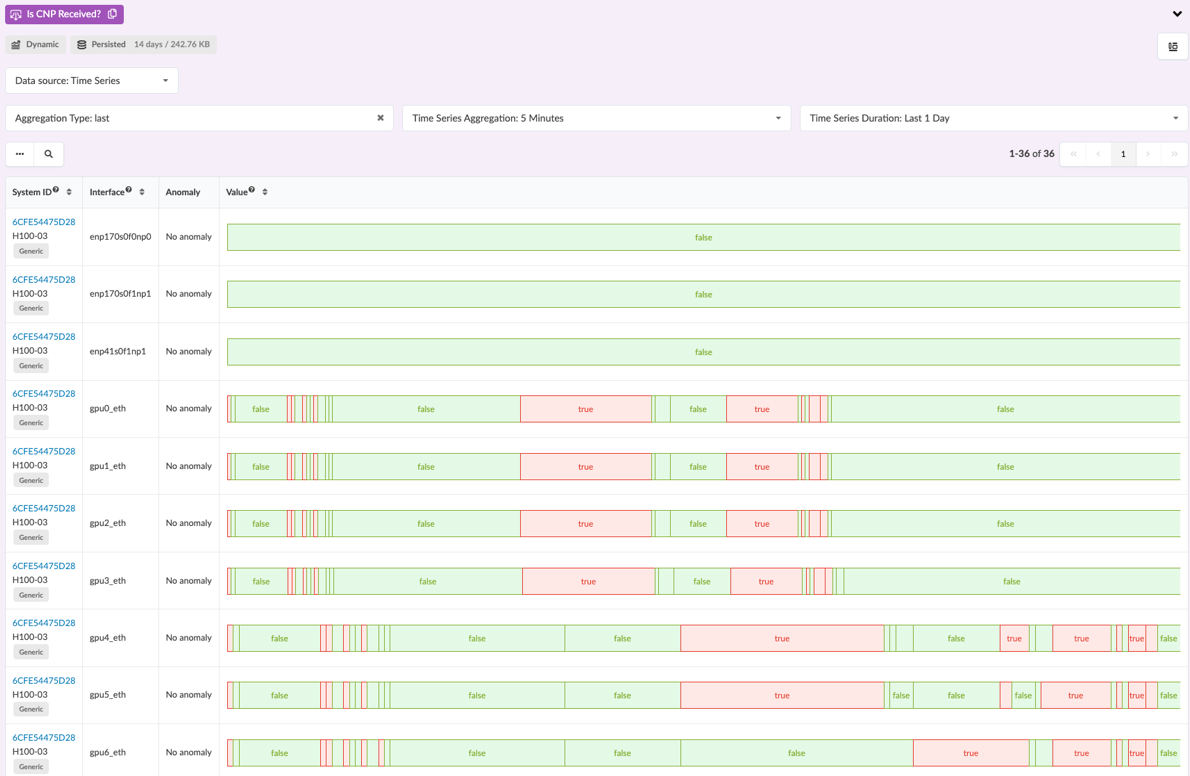
Note that each widget shows "No anomalies!" when detected probe values are below the configured thresholds.
The probe also includes a GPU Infiniband Port Information table that displays:
-
System ID
-
InfiniBand Device identifier (mlx5_X)
-
Interface Name
-
Port
-
Status