ON THIS PAGE
GPU NIC Analytics Dashboard
Introduction
Version 6.0 introduces the GPU NIC Analytics Dashboard. This dashboard is designed to monitor and visualize GPU network utilization across AI fabrics. The dashboard provides a heatmap-style view of transmitted (Tx) and received (Rx) traffic per GPU NIC, enabling you to visualize GPU traffic patterns and optimize GPU network performance.
GPU NIC Analytics Dashboard Overview
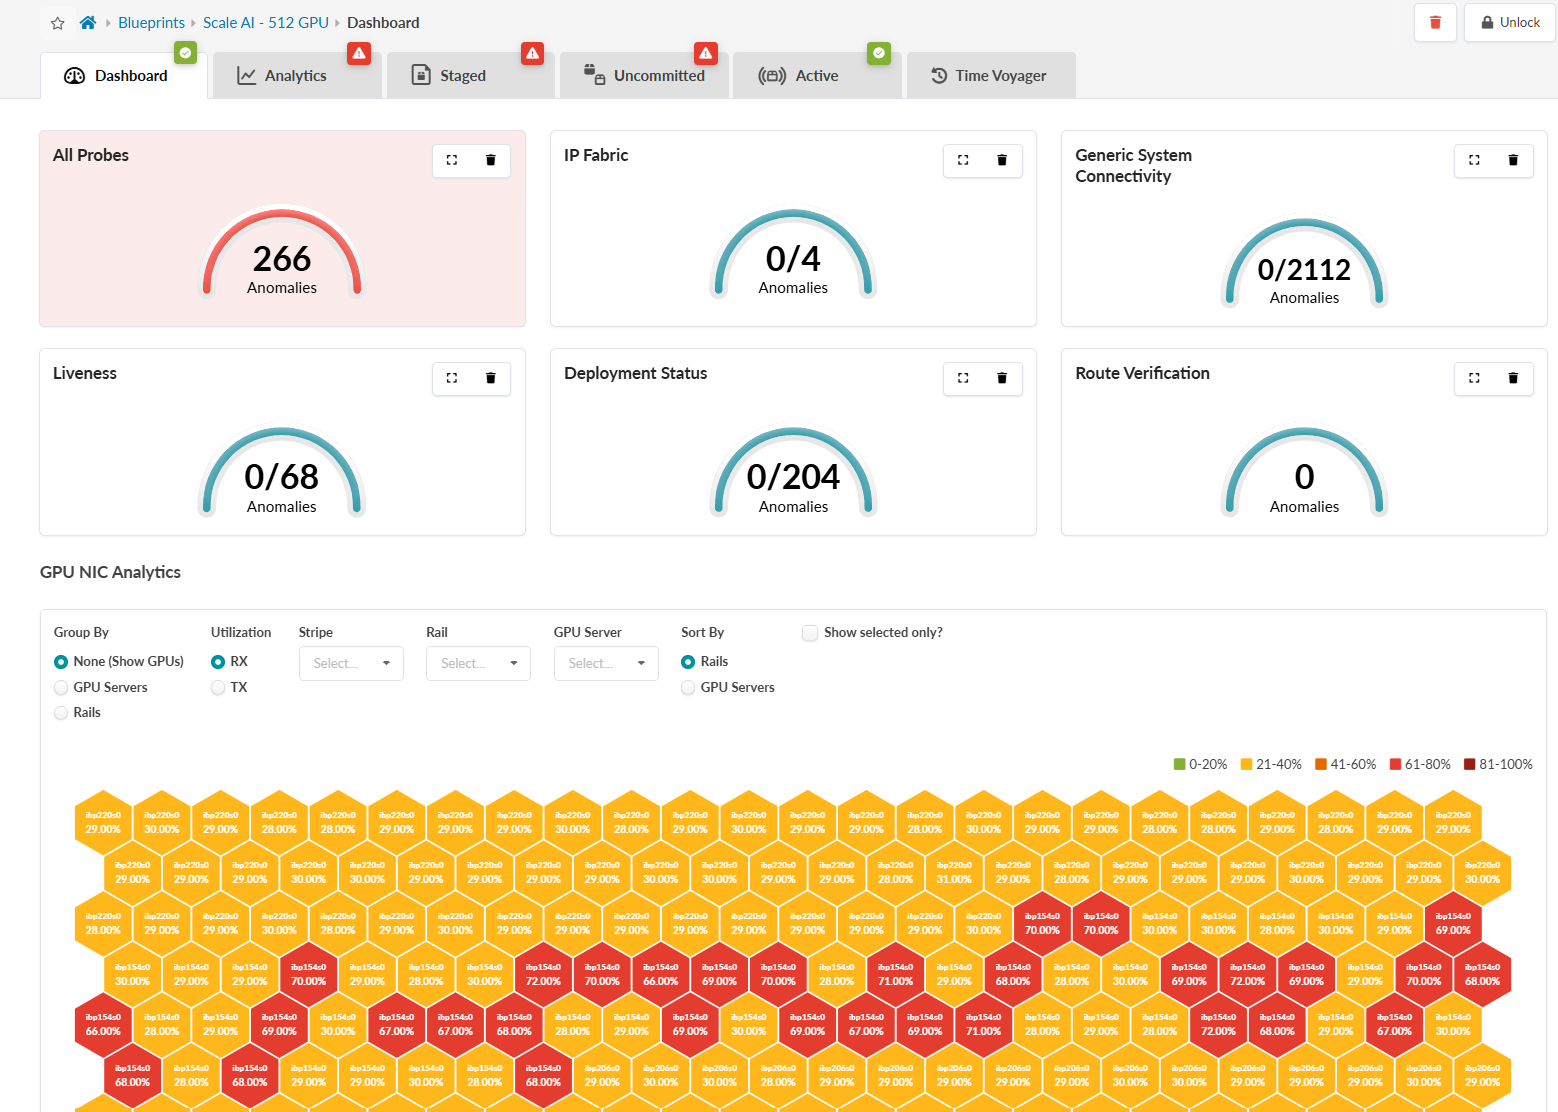
The dashboard also offers the following features:
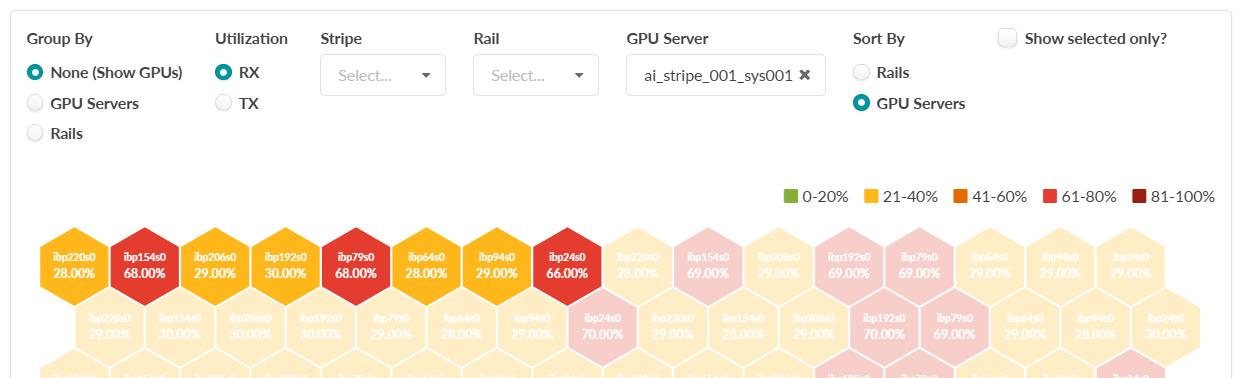
Heatmap Visualization: A honeycomb heatmap represents GPU NIC utilization. Color-coded hexagons indicate the following traffic levels:
-
Green (0-20%)
-
Yellow (21-40%)
-
Orange (41-60%)
-
Red (61-80%)
-
Dark Red (81-100%)
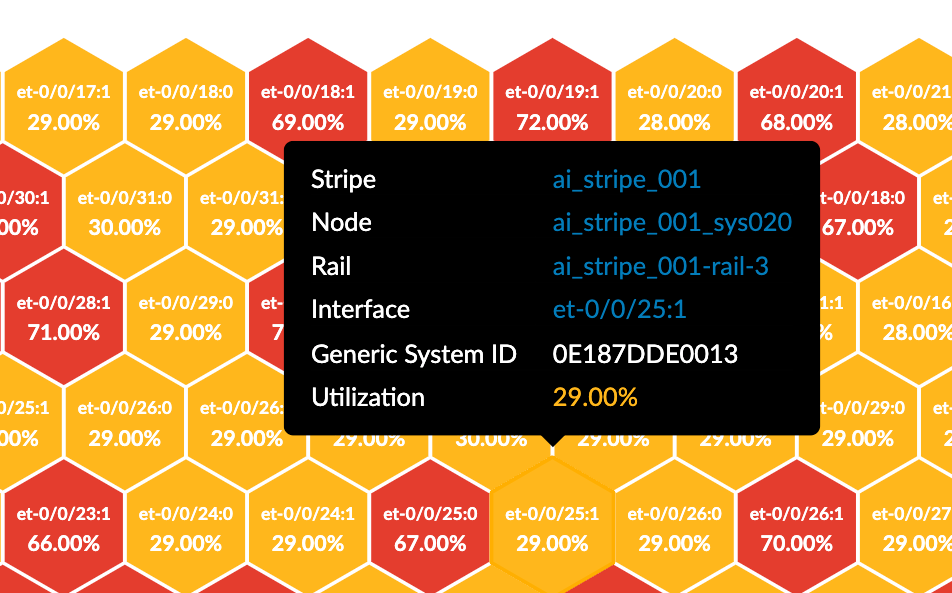
Traffic Statistics: View Tx and Rx traffic metrics for the entire fabric or drill down into specific components. You can filter traffic by:
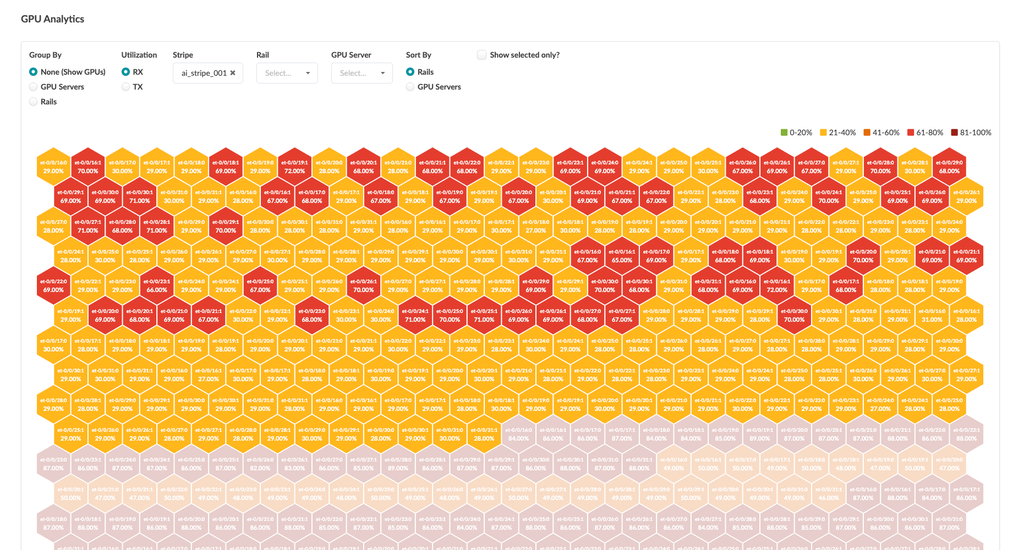
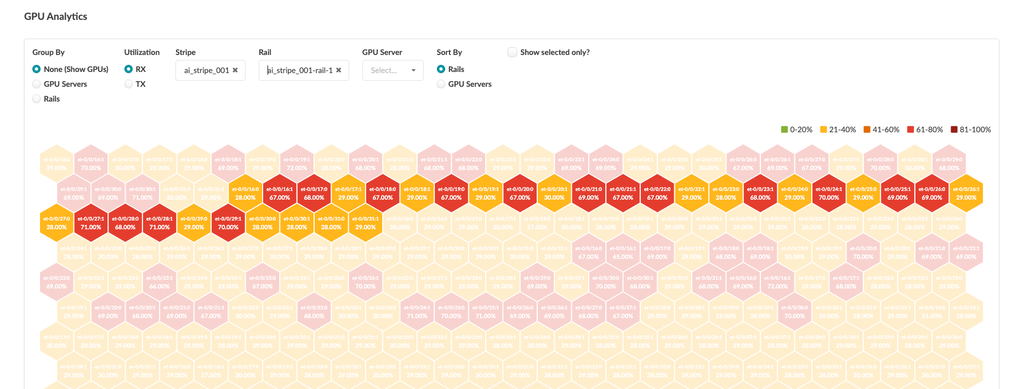
You can also view and filter aggregated traffic for GPU servers and rails.
In the image above, for the Utilization option, RX is selected for the GPU Server "ai_stripe_001_sys001". For the Sort By option, GPU Servers is selected. This displays RX traffic for all of the GPUs in the selected GPU Server.