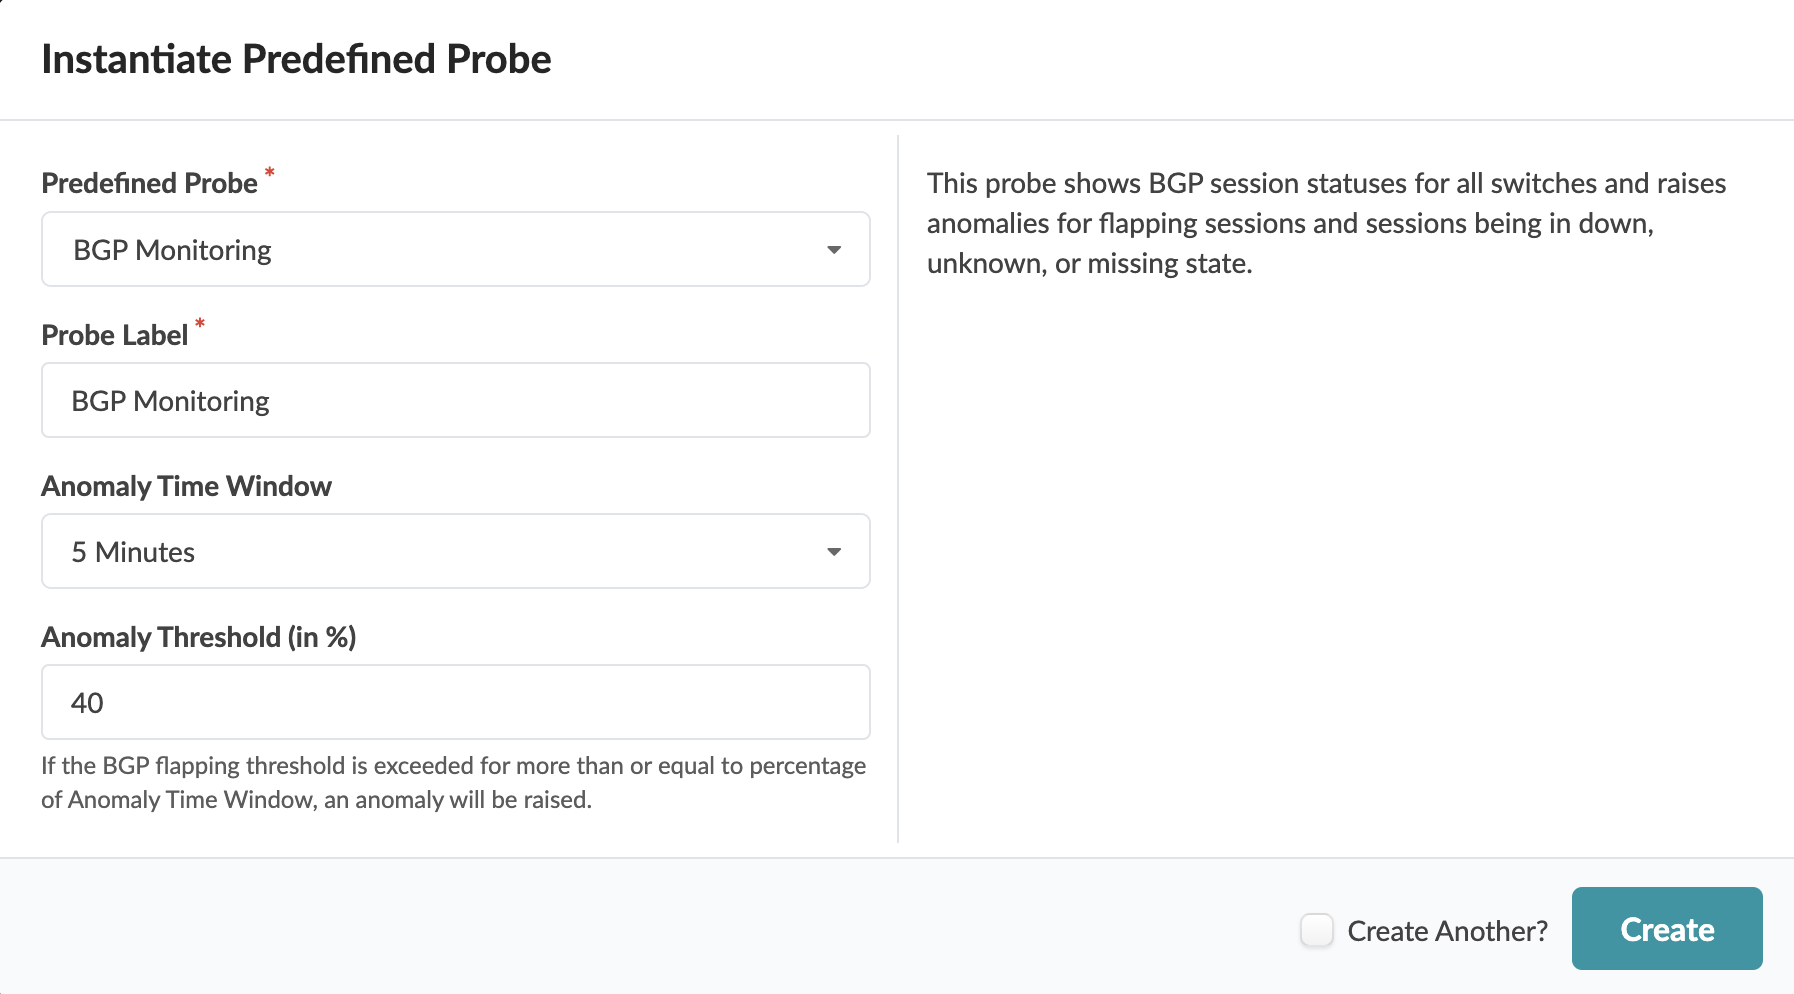
Probe: BGP Monitoring
This probe is supported on Junos OS, Junos OS EVO, Arista EOS, Cisco NX-OS and SONiC (Cisco and SONiC as of Apstra version 5.1.0). The BGP Monitoring probe shows BGP session status for all switches and raises anomalies for flapping BGP sessions. In Freeform blueprints, the probe also monitors and raises anomalies when BGP sessions are down, missing or unknown. (In Datacenter blueprints, BGP session up and down state is included with built-in telemetry, so it's not required in this probe.)
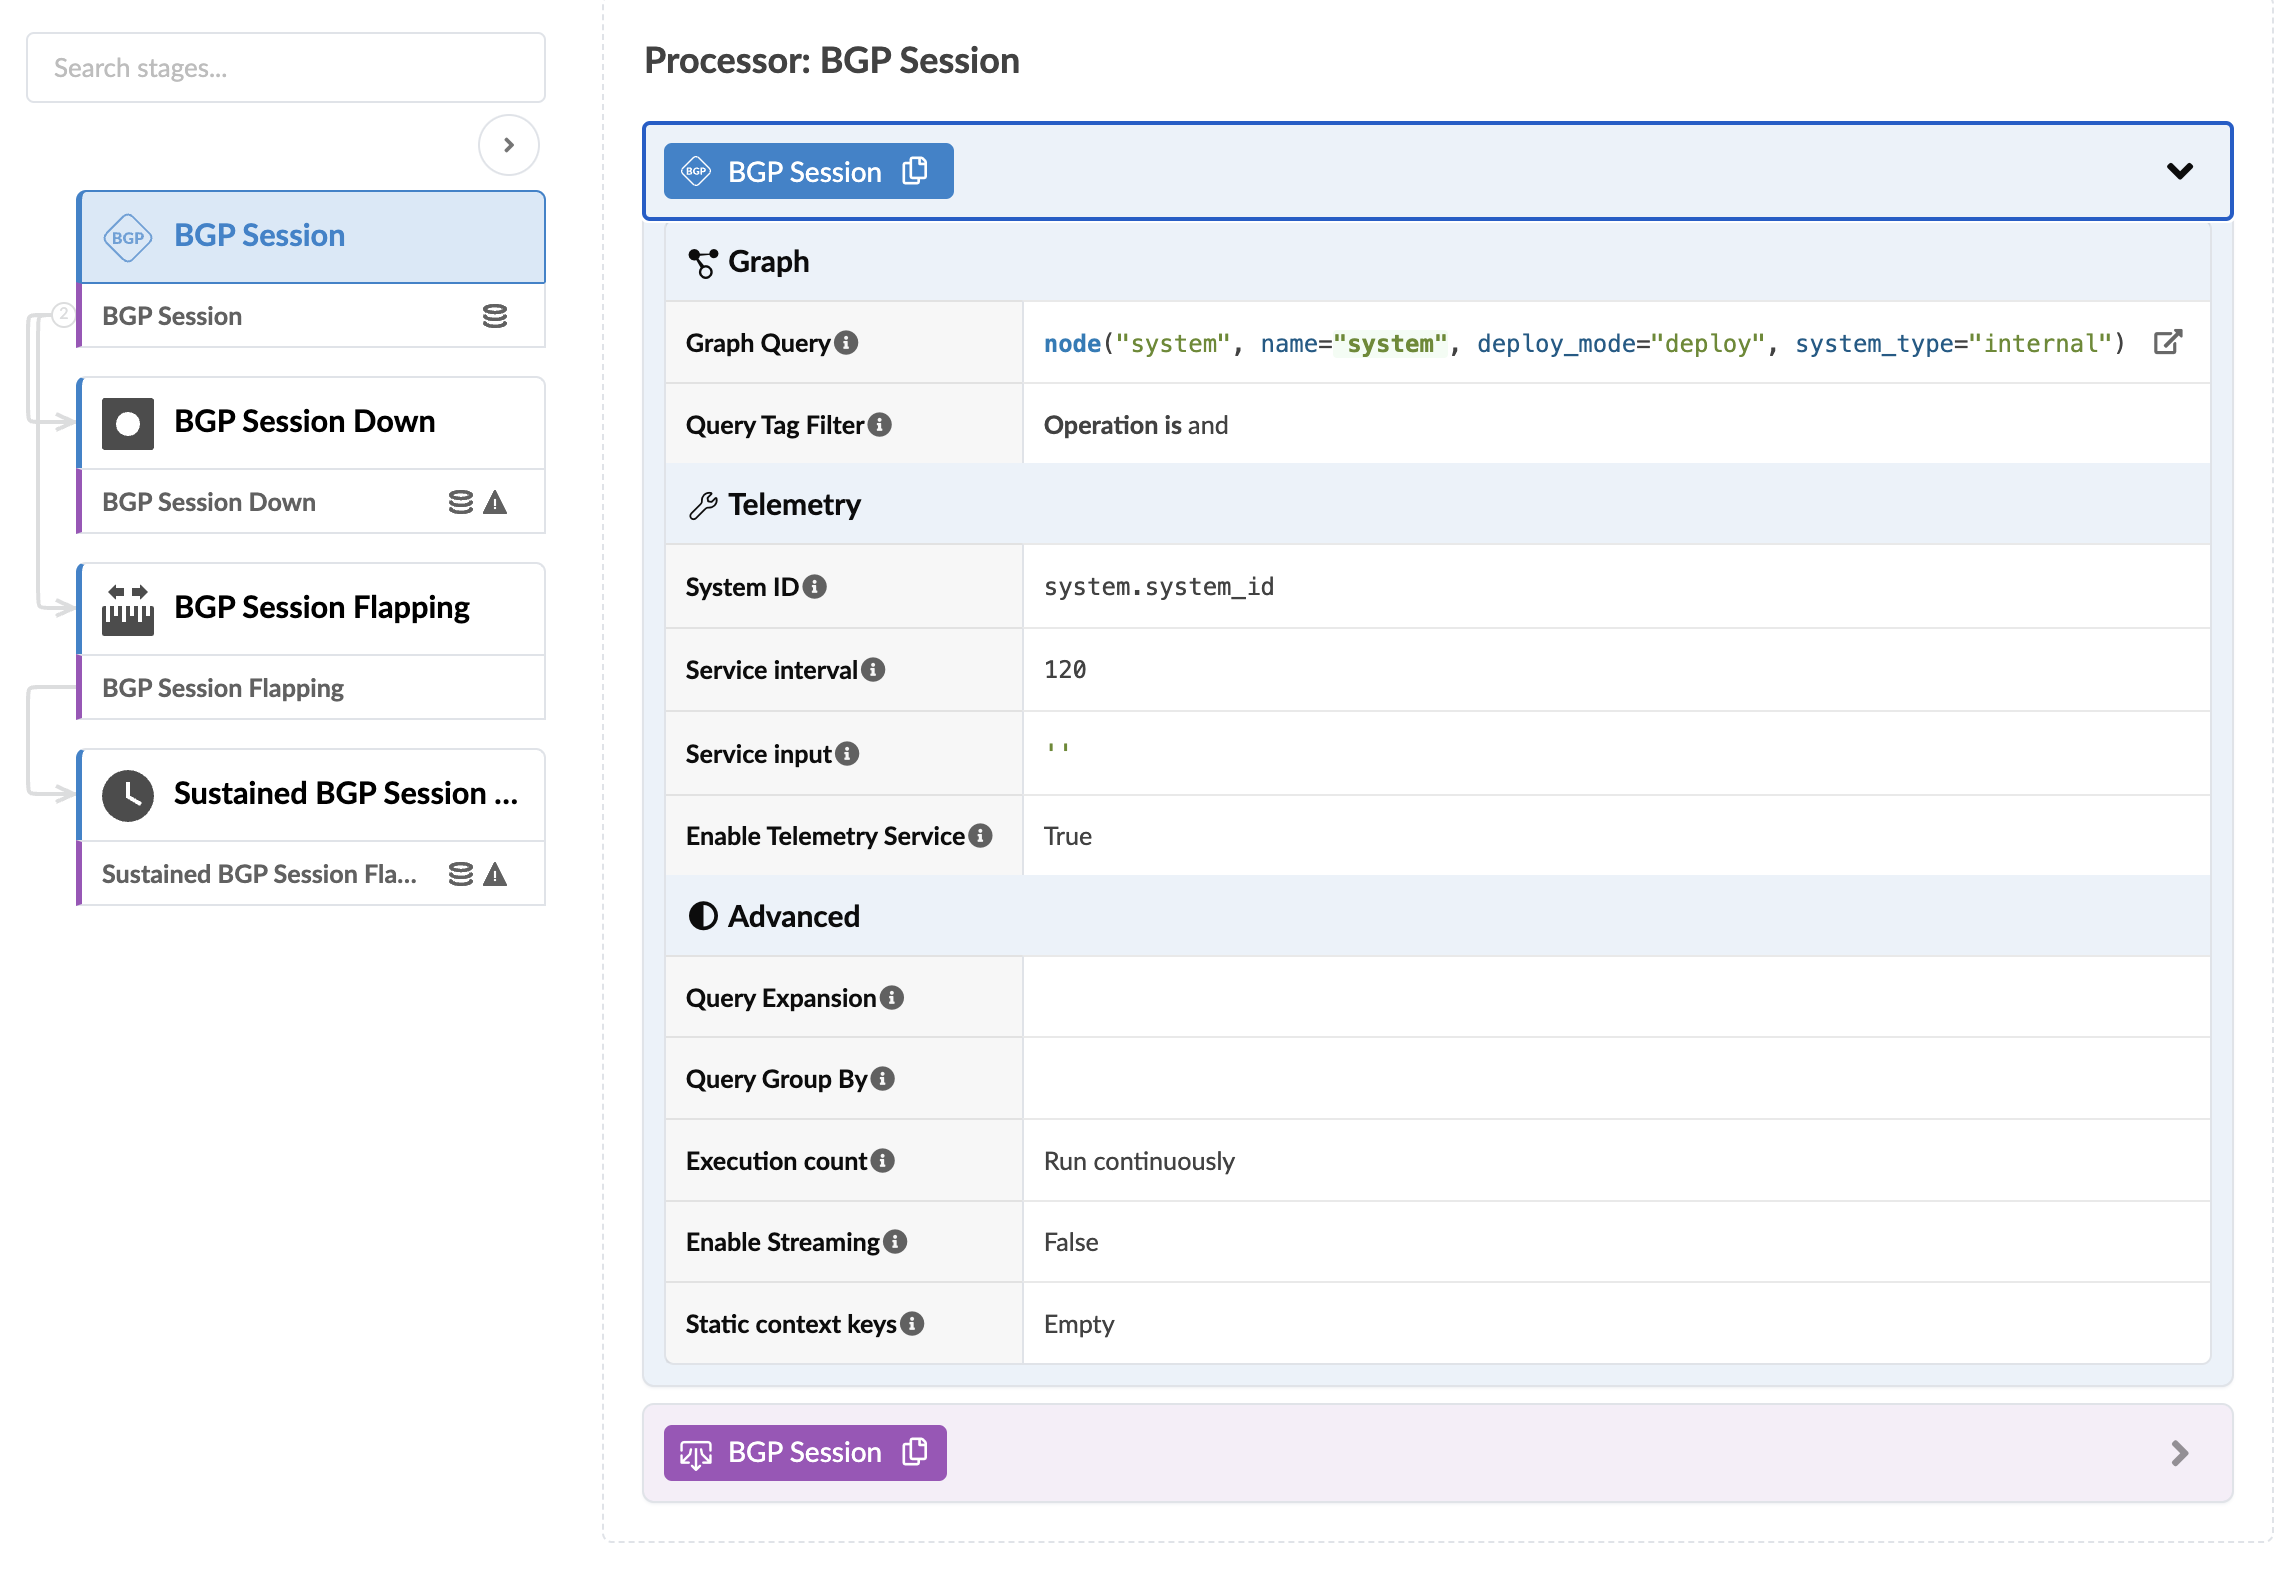
BGP Session
The BGP Session stage shows all BGP sessions for devices.
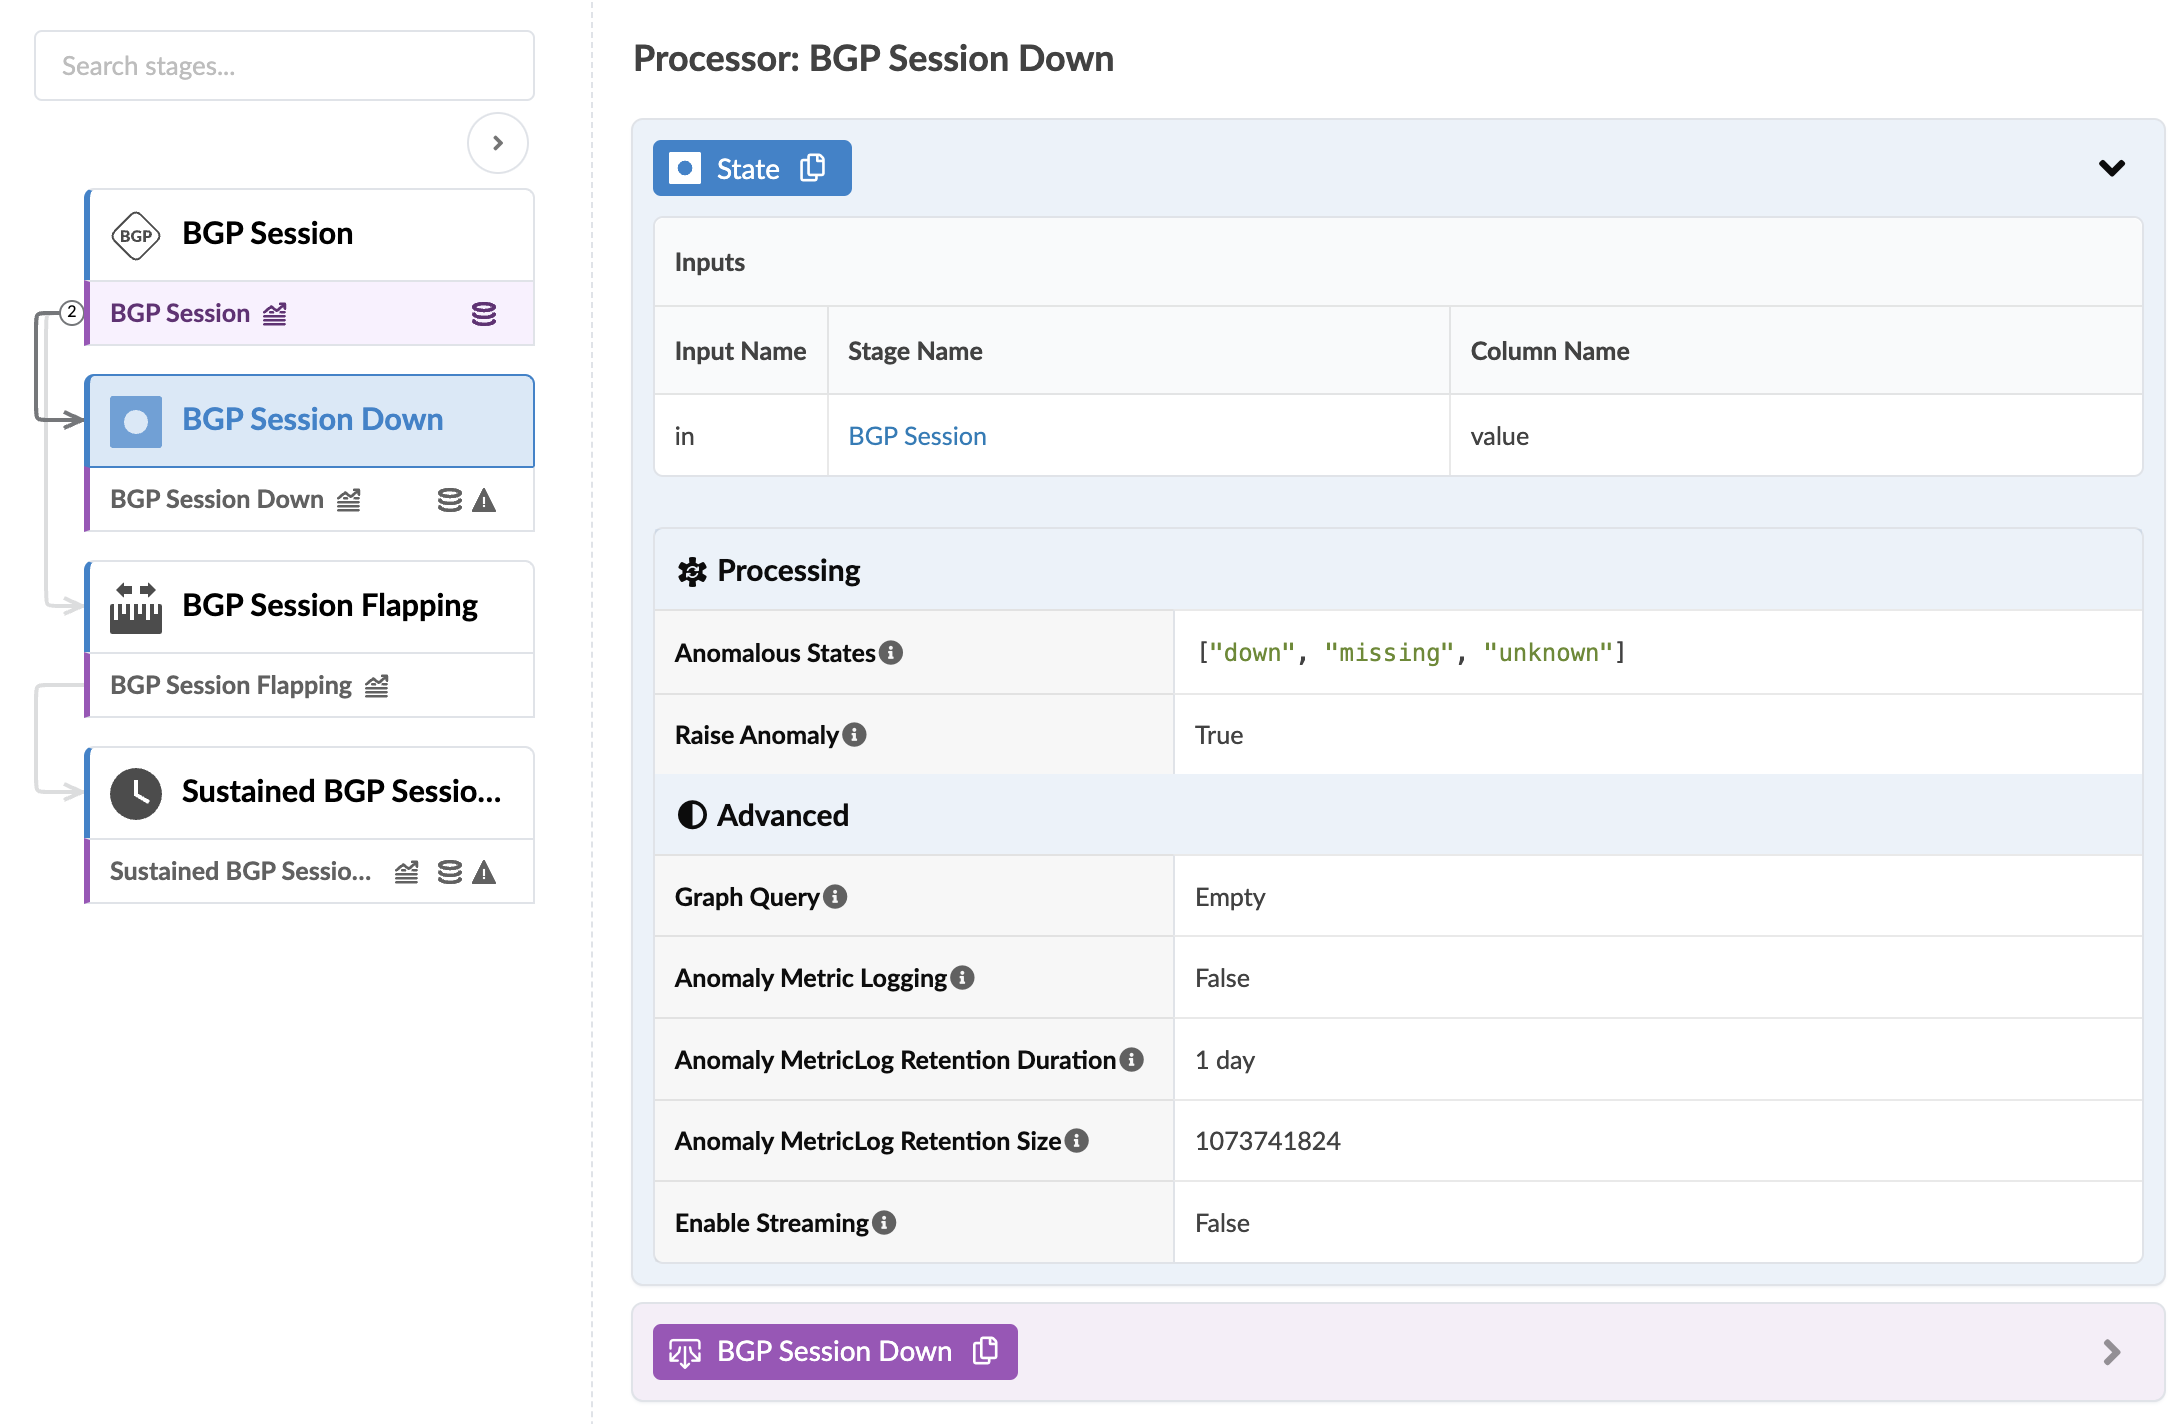
BGP Session Down
The BGP Session Down stage determines if the BGP session is not "up" and raises an anomaly accordingly. BGP Session Down is included only in Freeform blueprints. The processor includes the parameters as shown in the screenshot below:
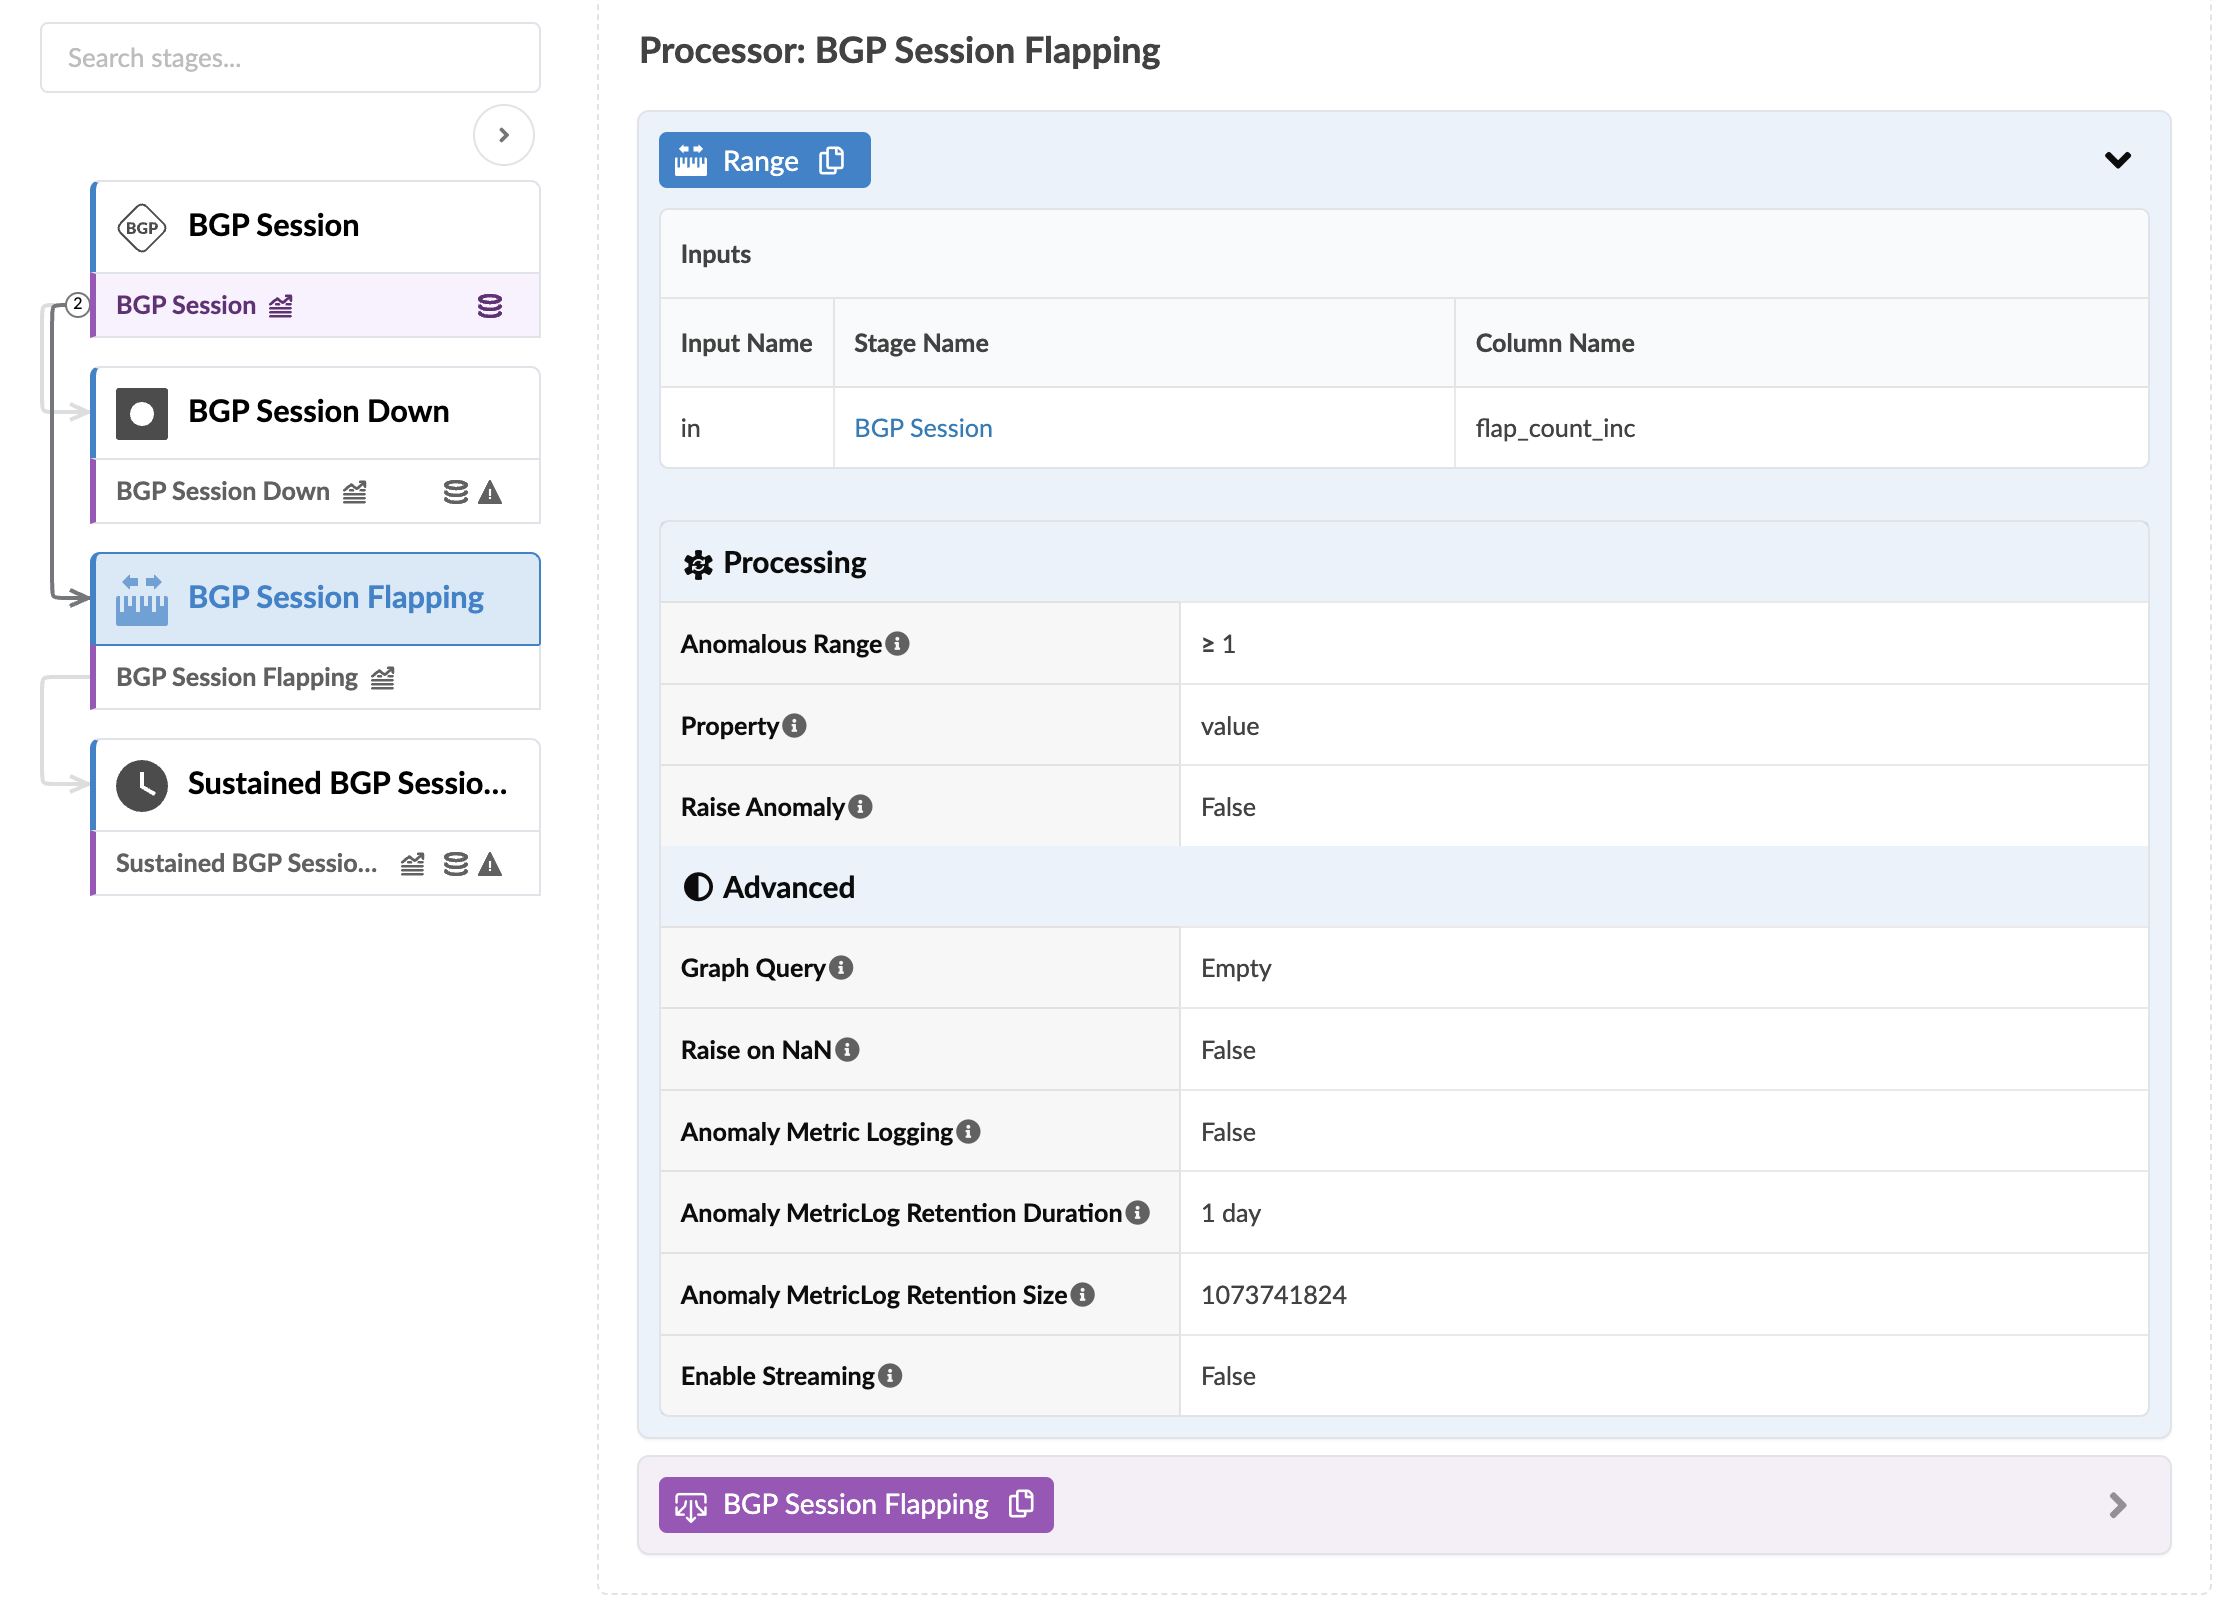
BGP Session Flapping
The BGP Session Flapping stage checks if the BGP session has new flaps for the last service interval period. (2 minutes by default). The BGP Session Flapping processor includes the parameters as shown in the screenshot below:
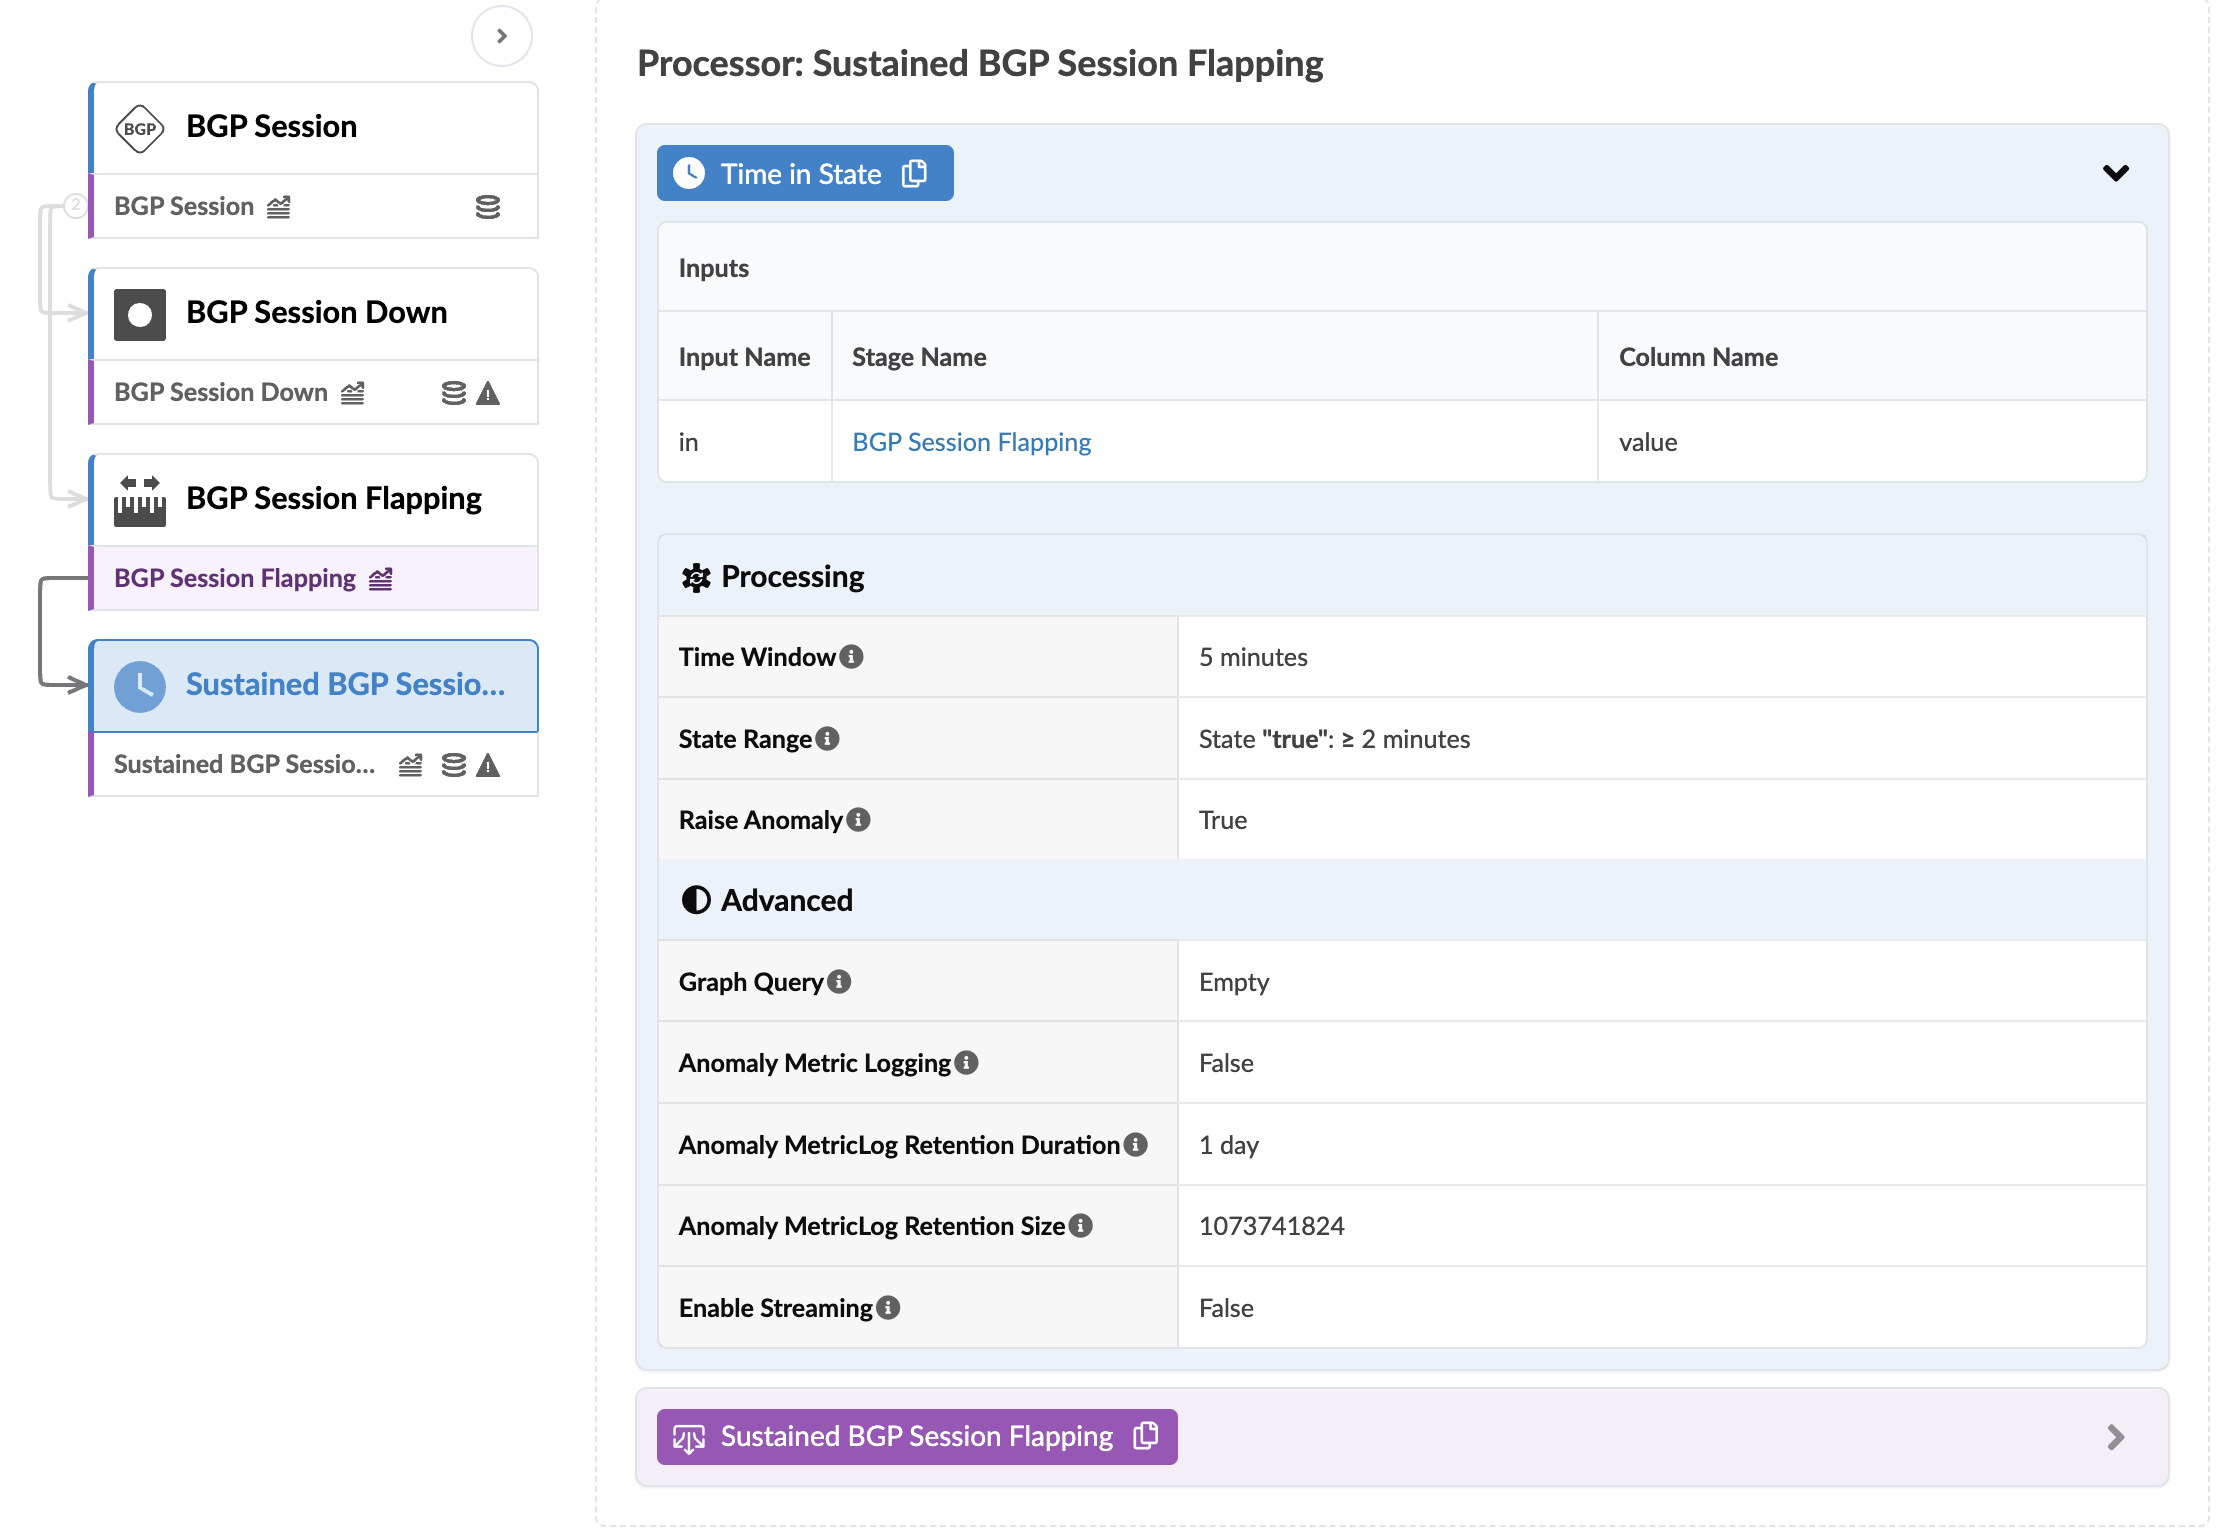
Sustained BGP Session Flapping
The Sustained BGP Session Flapping stage checks if the BGP session has new flaps for the specified period of time. For example, assume there are BGP flaps between leaf1 and spine1 nodes. The fabric BGP session between these nodes generates new BGP flaps when the interface status is changed on spine1 that's connected to leaf1. When shutdown and up interface is performed seven times on spine 1, it creates seven flaps for fabric BGP sessions between leaf1 and spine1. The seven new flaps are added and two anomalies are raised.
The Sustained BGP Session Flapping processor includes the parameters as shown in the screenshot below:
For more information about this probe, from the blueprint, navigate to Analytics > Probes, click Create Probe, then select Instantiate Predefined Probe from the drop-down list. Select the probe from the Predefined Probe drop-down list to see more details specific to the probe.