Create a Custom Telemetry Collector
This topic describes the steps that are required to create a custom telemetry collector.
In this topic, we'll walk you through creating your own custom telemetry service using power-related metrics as an example.
Step 1. Execute the CLI Command
Starting in Apstra version 4.2.0, you can run CLI show commands for Junos devices
directly from the Apstra GUI. Although you can run show
commands without opening a CLI session, its primary purpose is to help you
create your own custom telemetry collectors.
You can execute CLI commands from within a staged or active blueprint (shown in our example), or from the Devices > Managed Devices page.
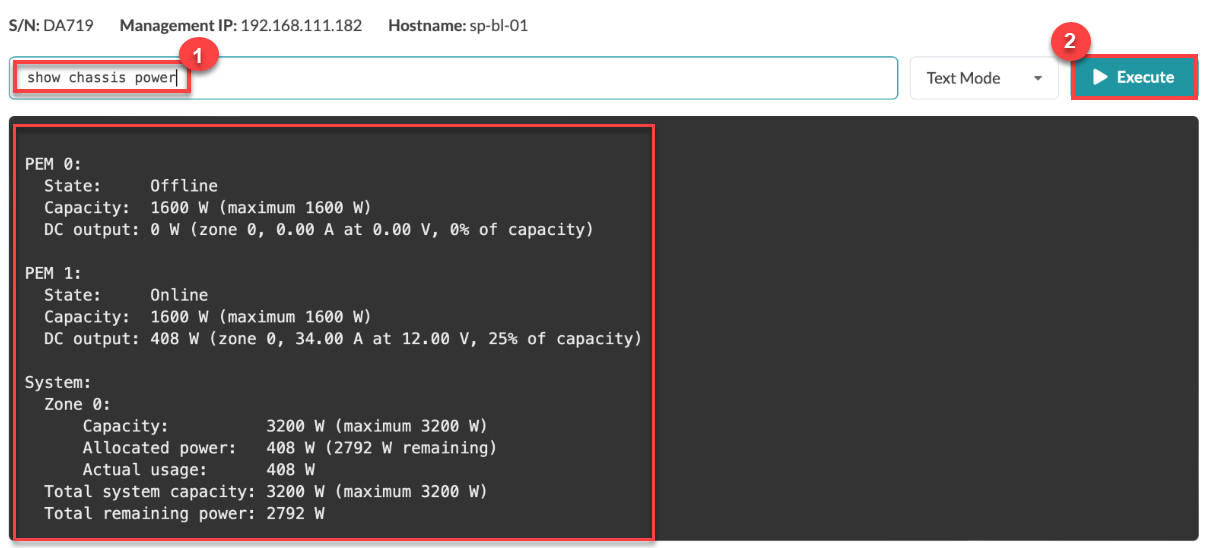
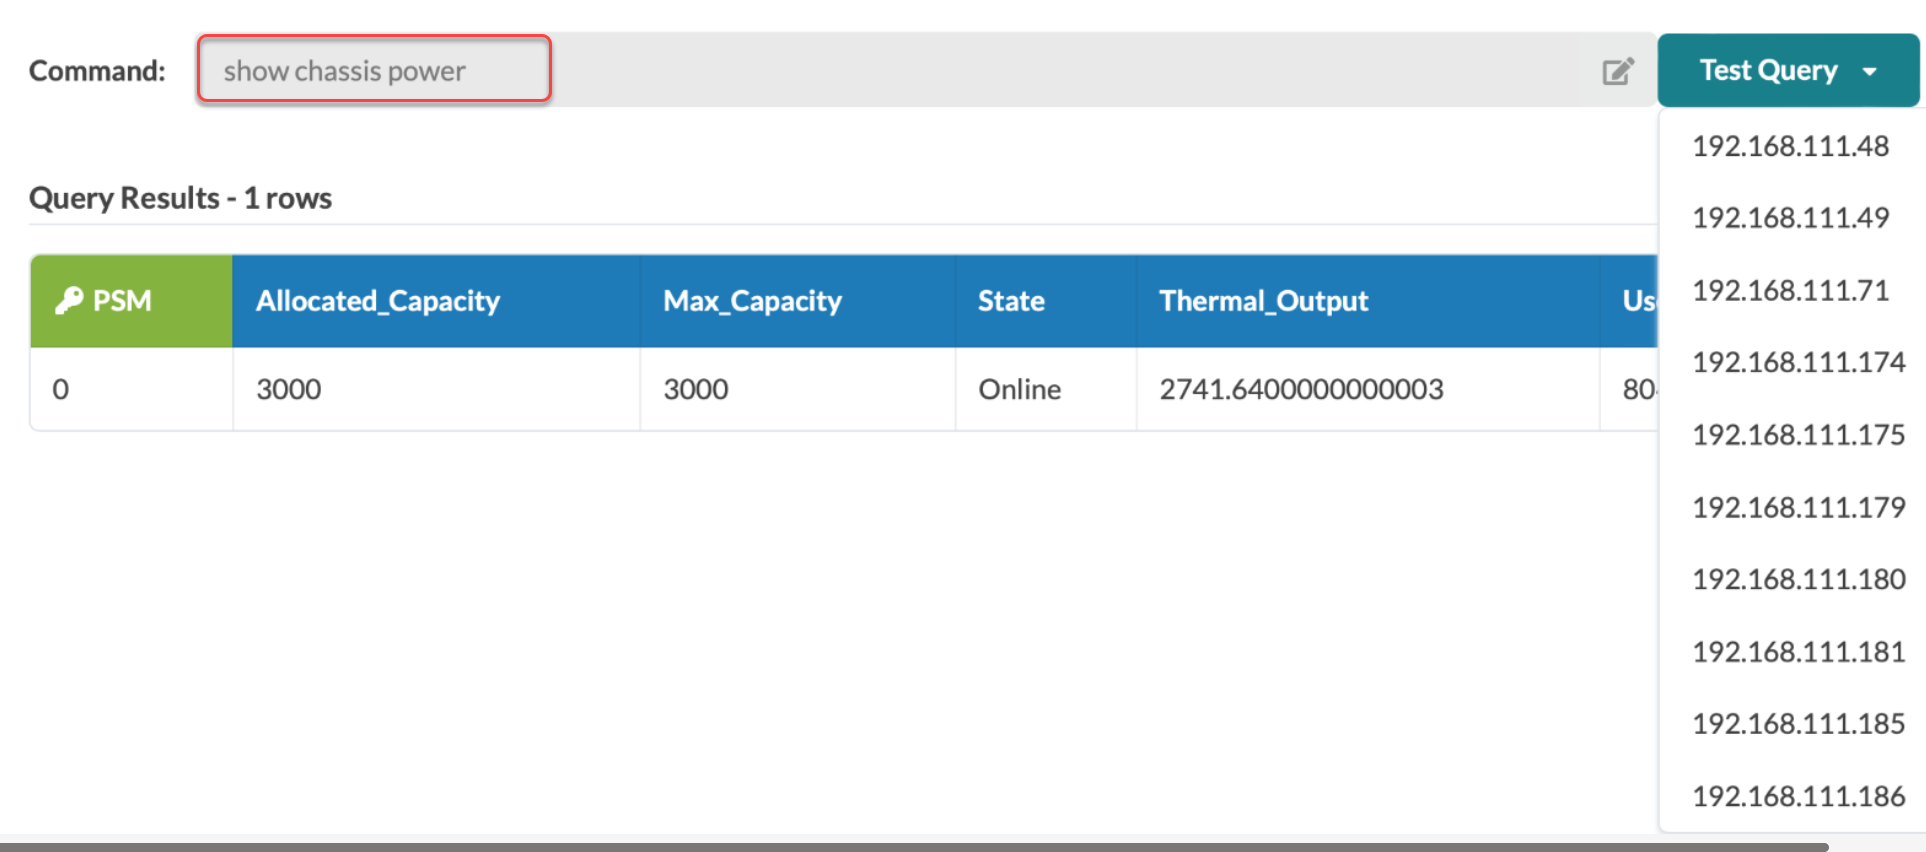
Before you get started, identify the CLI command that you want to use for the
output values. In this procedure, we're using the show chassis
power command as an example.
To execute the CLI command:
-
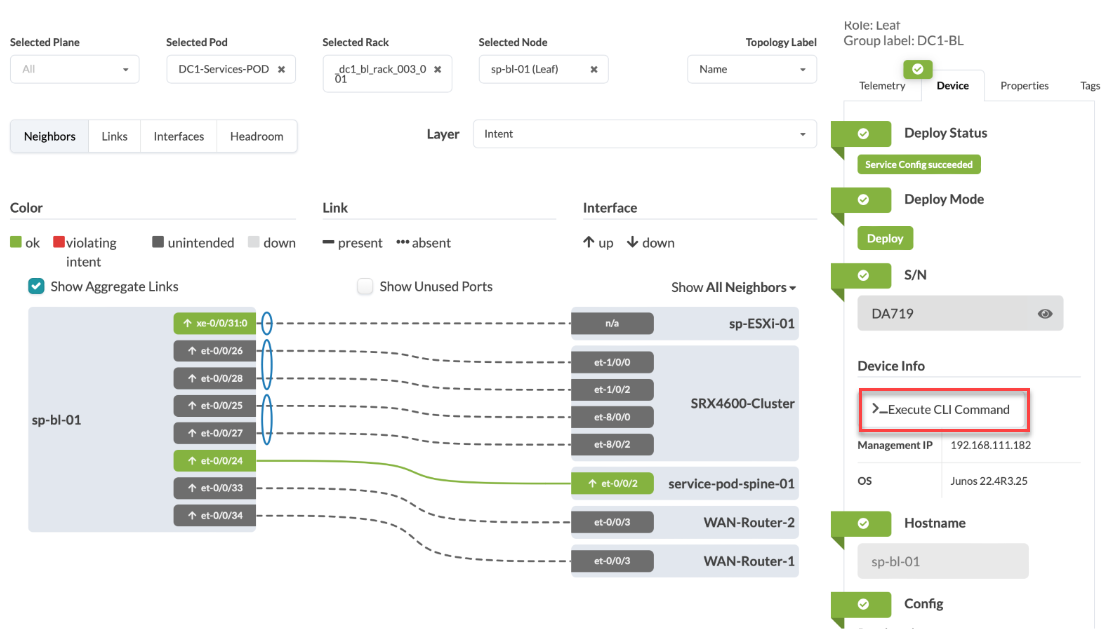
From your deployed blueprint, select Staged > Physical >
Topology, then select your Juniper device node. In this
example, sp-bl-01 (Leaf).

-
In the Selection section that appears in the right
panel, on the Device tab, select Execute
CLI Command.
 In the dialog box that opens, select how you want to view the results: Text Mode, XML Mode, or JSON mode.
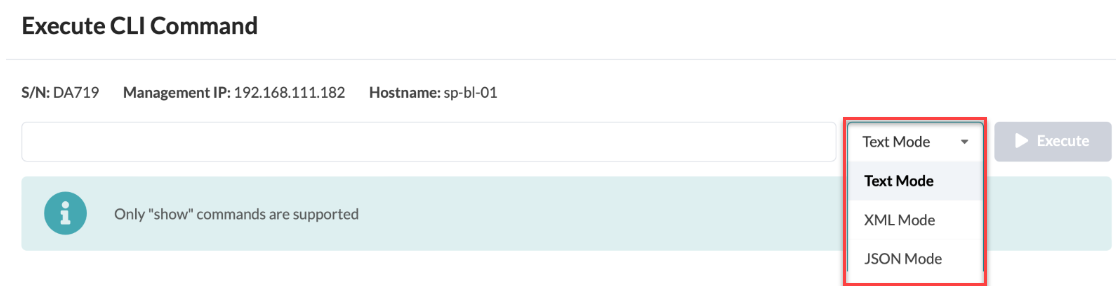 Note:
Note:The CLI supports only Junos
showcommands. You cannot run commands that affect the device state, such asrequest system reboot. For information about the various show commands, see the CLI User Guide for Junos OS.Here is an example of the CLI output in Text Mode.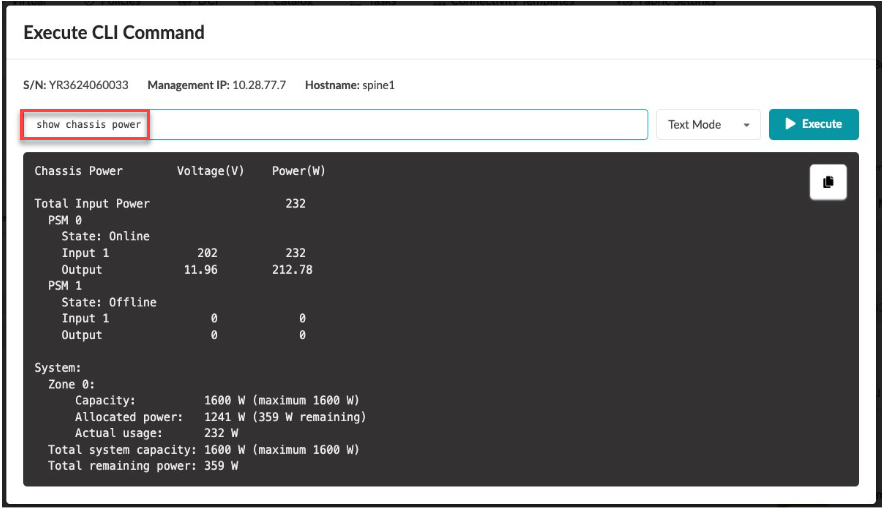 Here is an example of the CLI output in XML Mode.
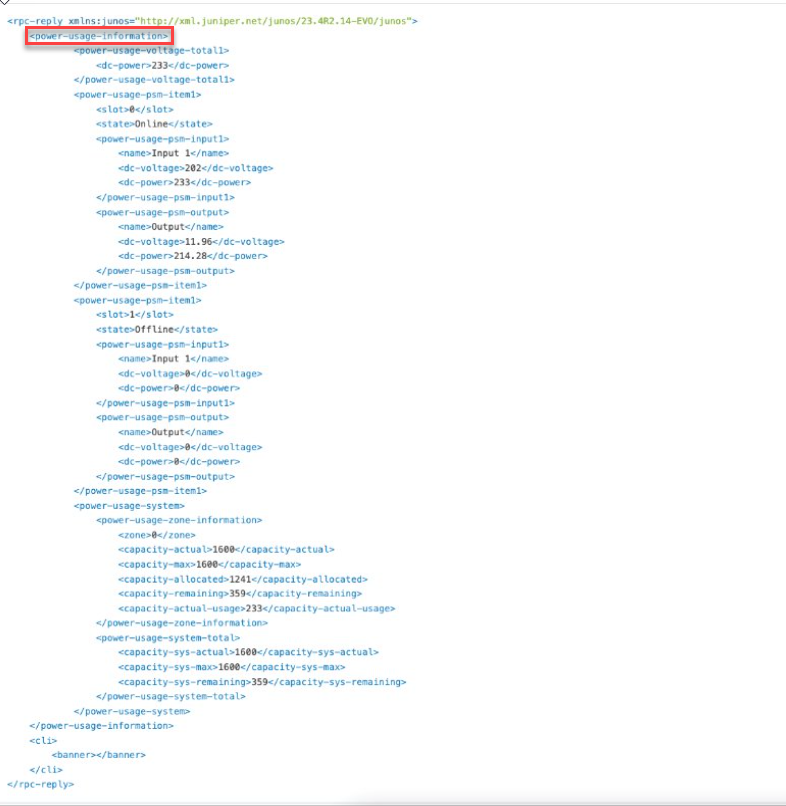 In this example, the output shows the power usage information for the device. This power information is what we'll use to create our telemetry collection service.
Step 2. Identify the Keys and Values of Interest from the CLI Output
show command to view the power utilization for your
devices.-
Click Execute to view the power utilization information.
Step 3. Create a Service Schema
A service defines your schema. You can create a service for a schema with a single output value or multiple output values. This procedure shows how to create a schema with multiple output values.
To create a service schema:
-
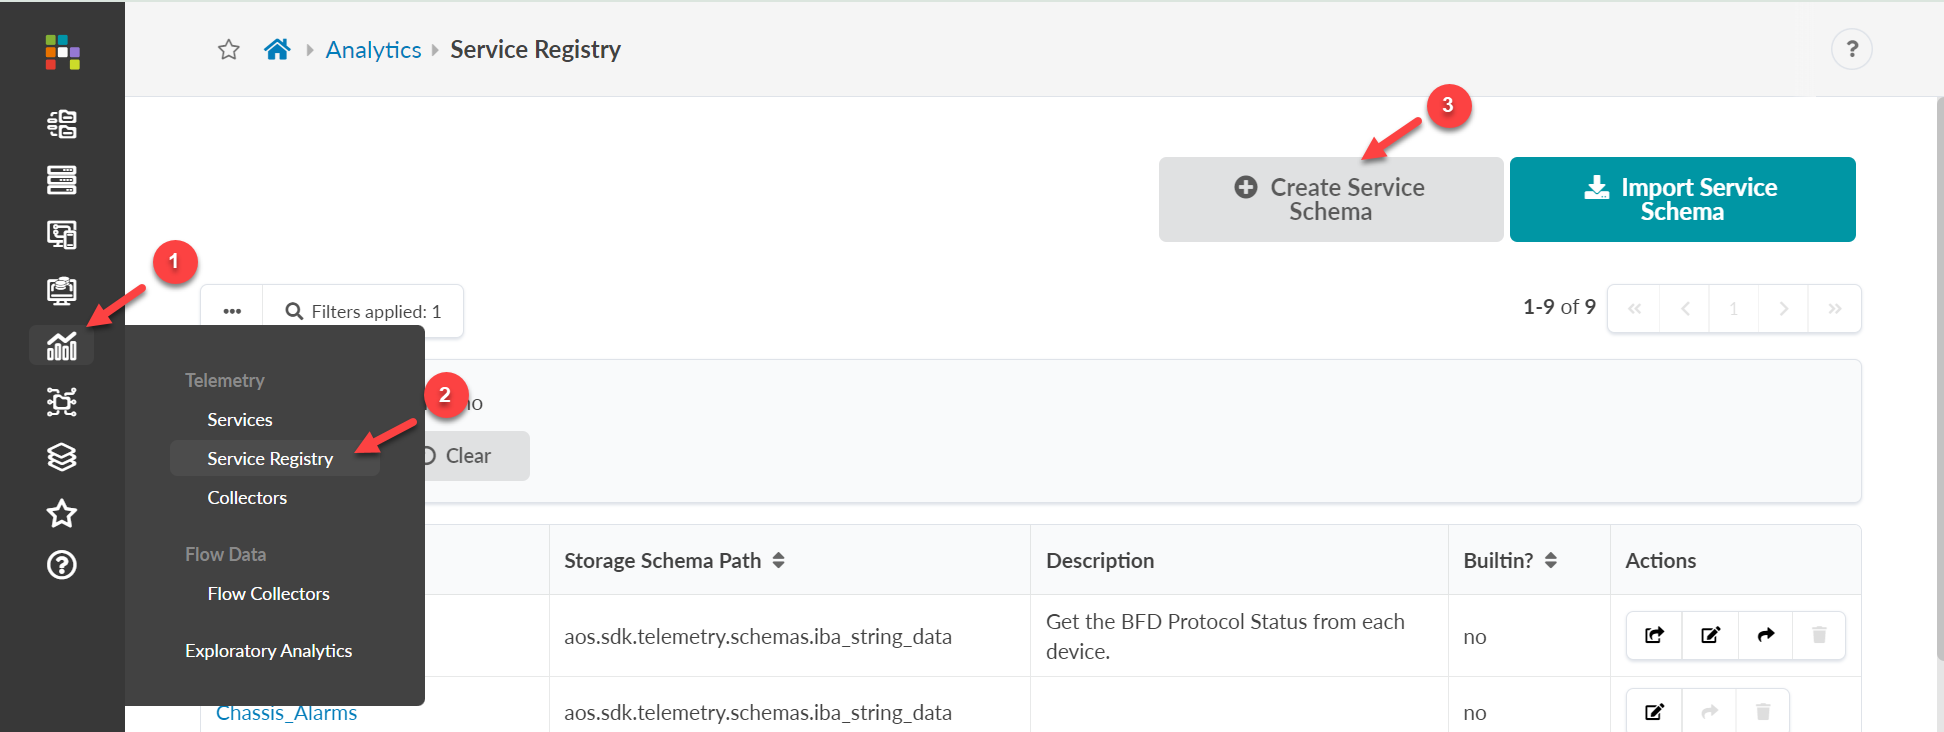
From the left navigation menu in the Apstra GUI, navigate to
Analytics > Service Registry, then click
Create Service Schema.
-
Define your schema.
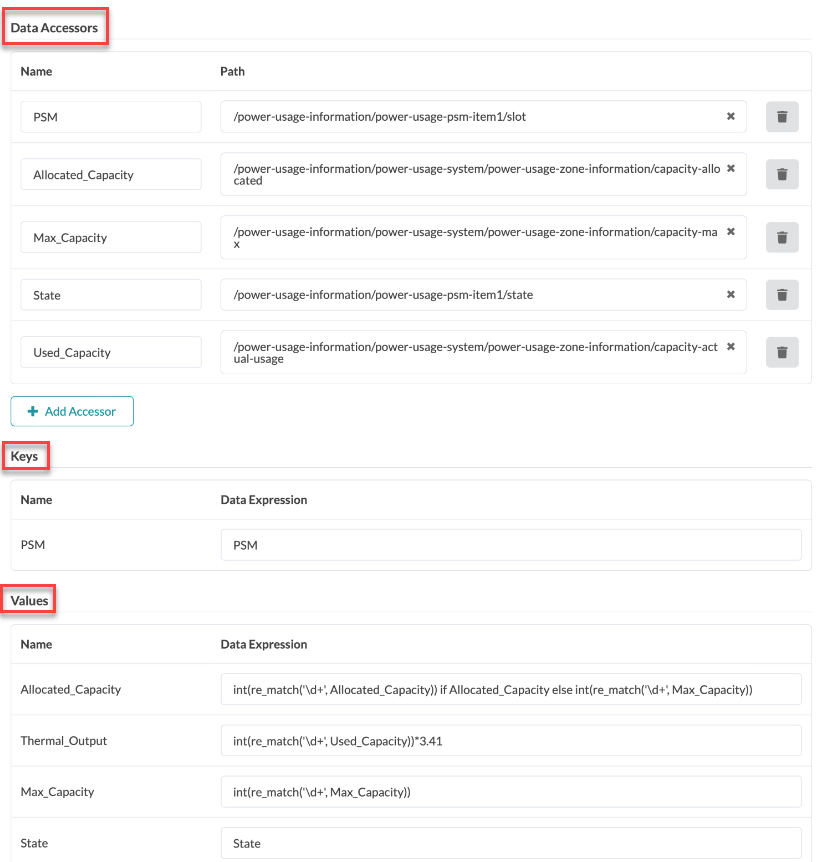
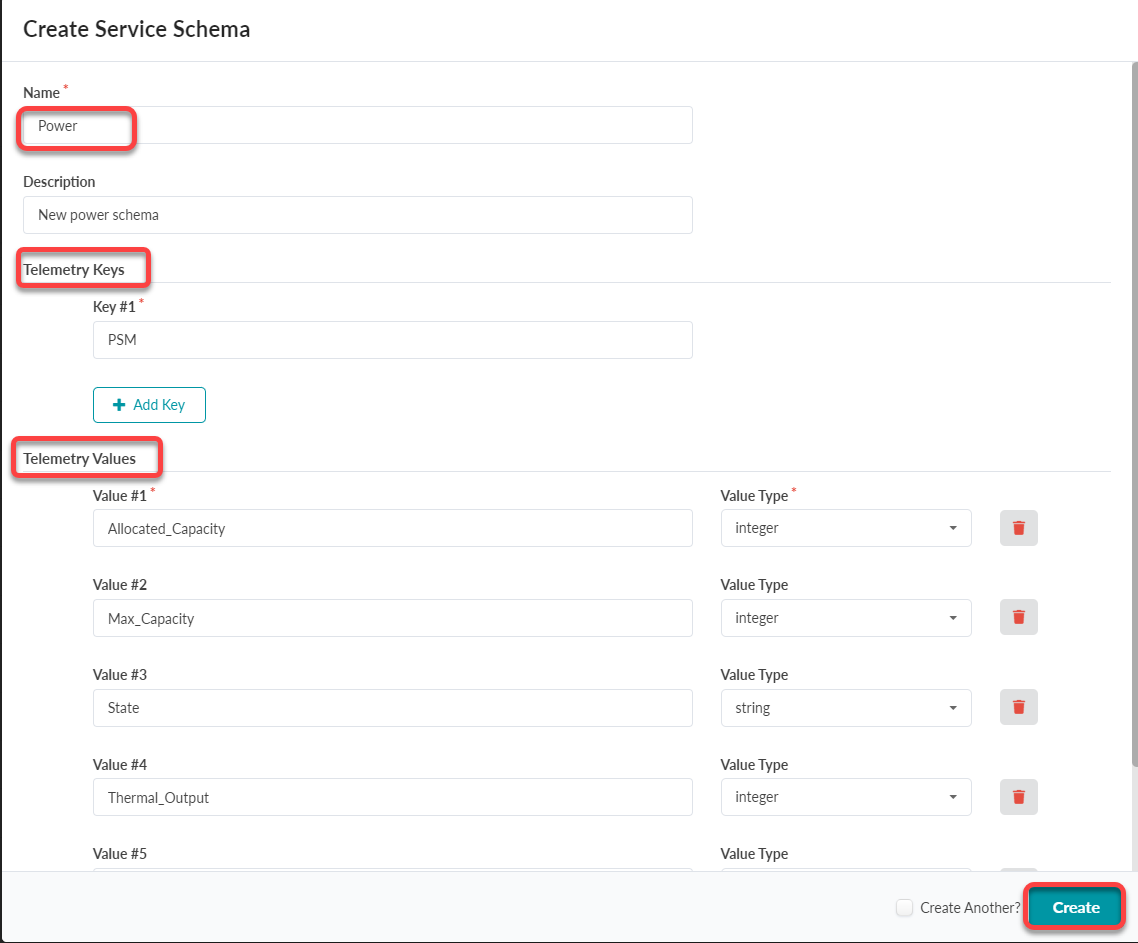 Specify the Telemetry Keys and Telemetry Values.In Apstra, the telemetry keys and value type are a collection of key-value pairs.
-
The telemetry key represents the identity of your service, such as
Interface_nameorPower_Supply_Module. The Value name might beTx_rateor, for power monitoring,VoltageorPower_Draw. -
The value type is the data produced by the telemetry service, which can be a String (text) or an Integer (whole number).
Note:Key names and value names cannot contain hyphens or other special characters, except for underscores ( _ ).
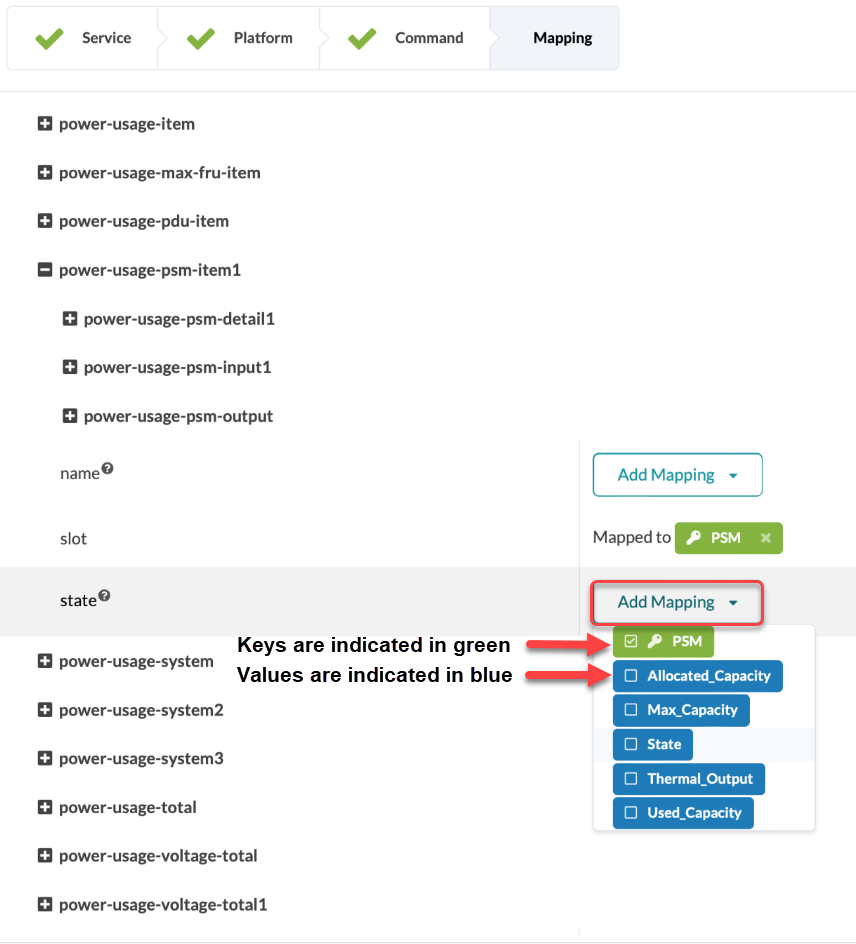
In our example, we've created a service schema that has multiple output values. We specified the PSM (Power Supply Module) as the Service Key and added multiple Service Values for Allocated Capacity, Max_Capacity, State, Thermal_Output, and Used_Capacity.Note:For more information about PSM's (also referred to as PEMs), see Managing Power in the Juniper Chassis-Level User Guide.
-
-
Click Create to finish creating your schema.
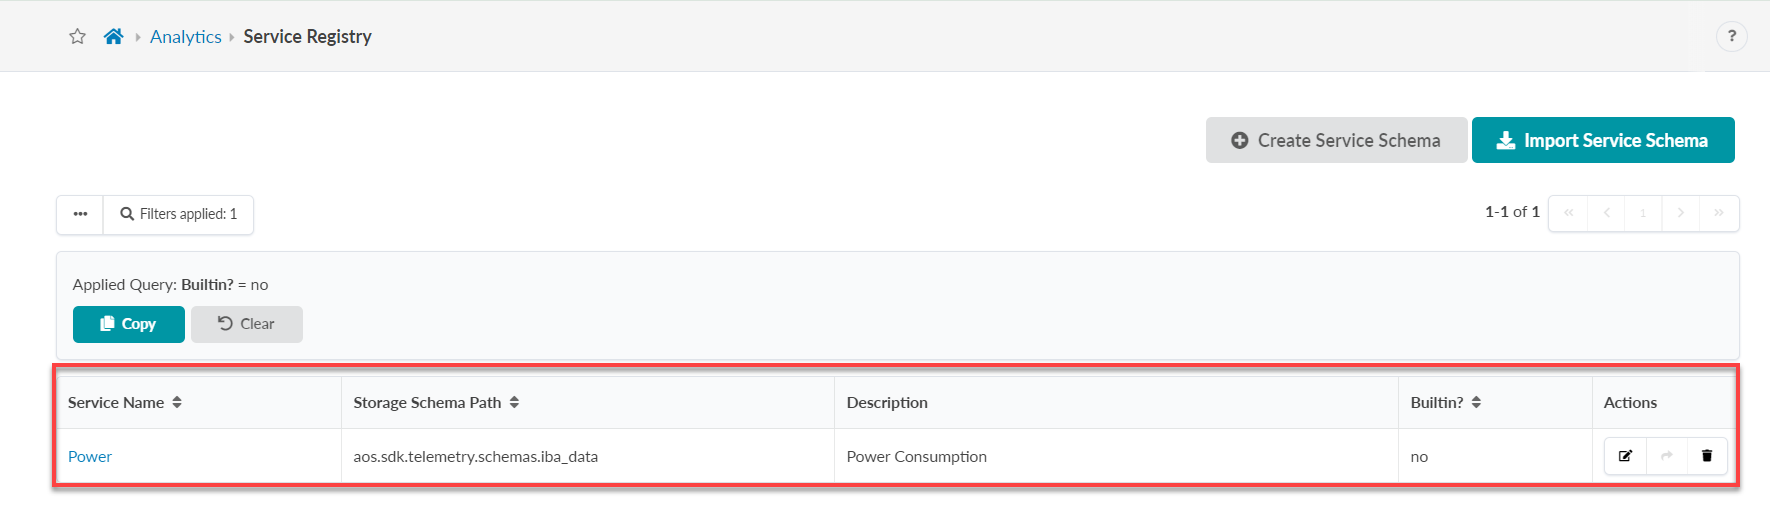
The new service schema is added to the Service Registry table.
Step 4. Create a Telemetry Collector
So far, you've defined the data you want to collect and determined how the data will be organized and structured. Our final step is to create a telemetry collector for our service.
A service is composed of one or multiple collectors. In this example, the service has a single collector.
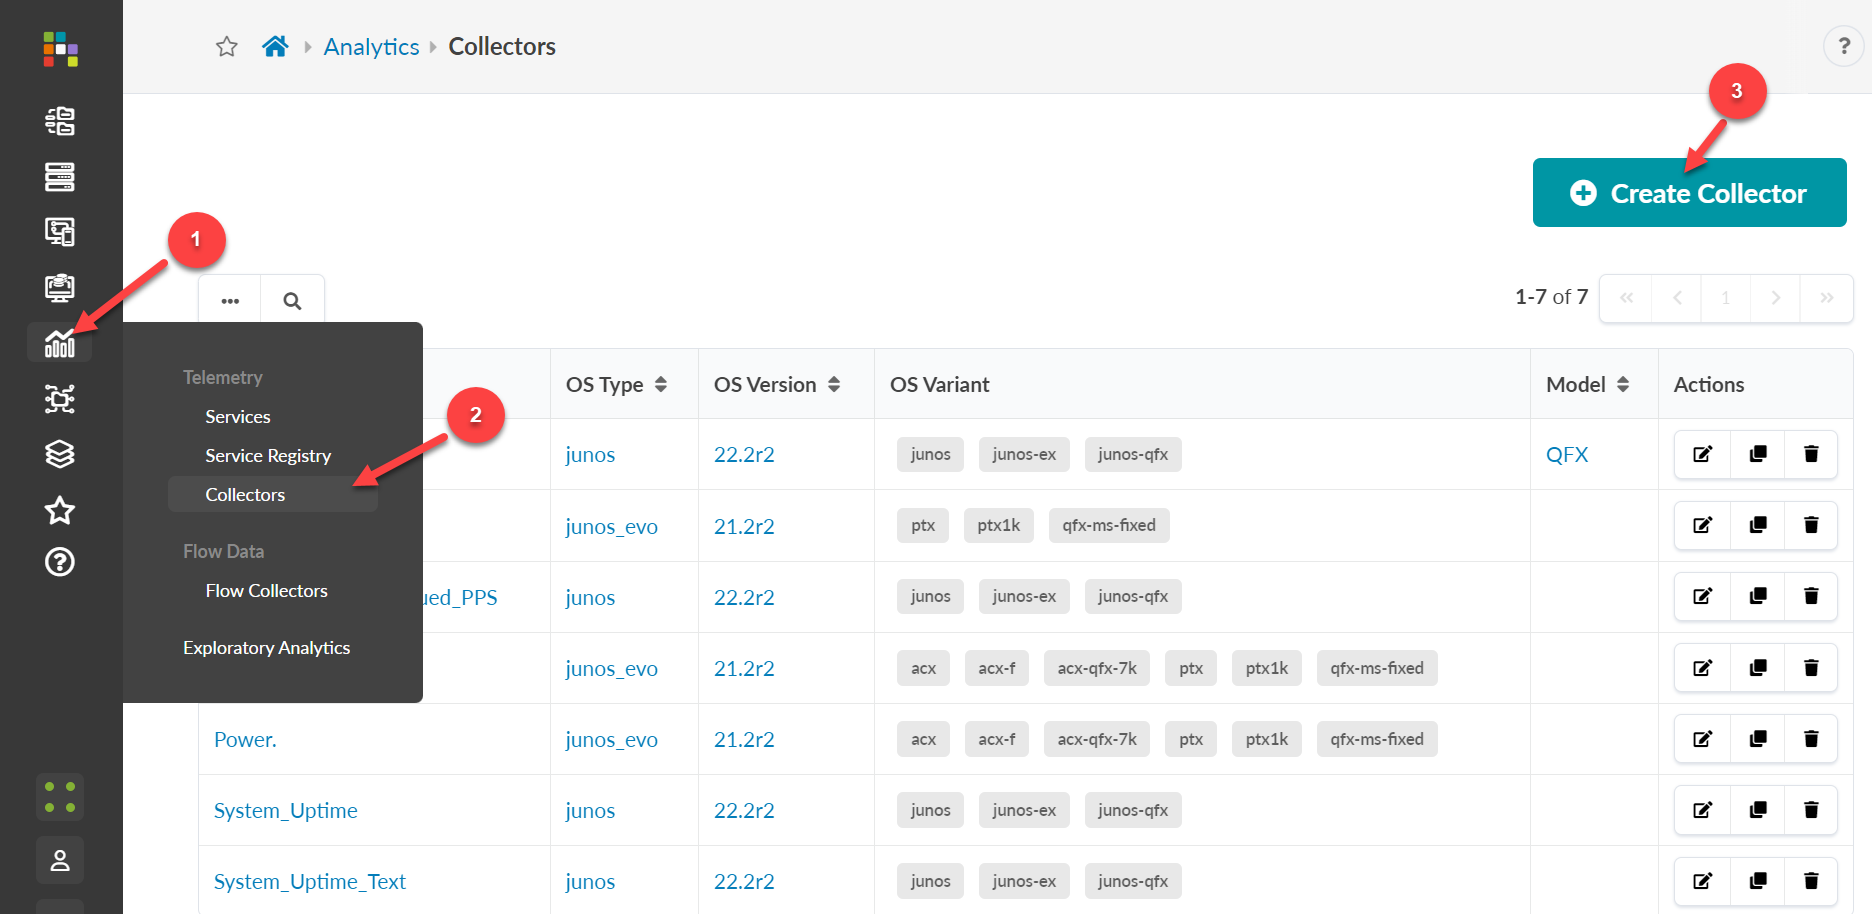
-
From the left navigation pane, navigate to Analytics >
Collectors, then click Create
Collector.
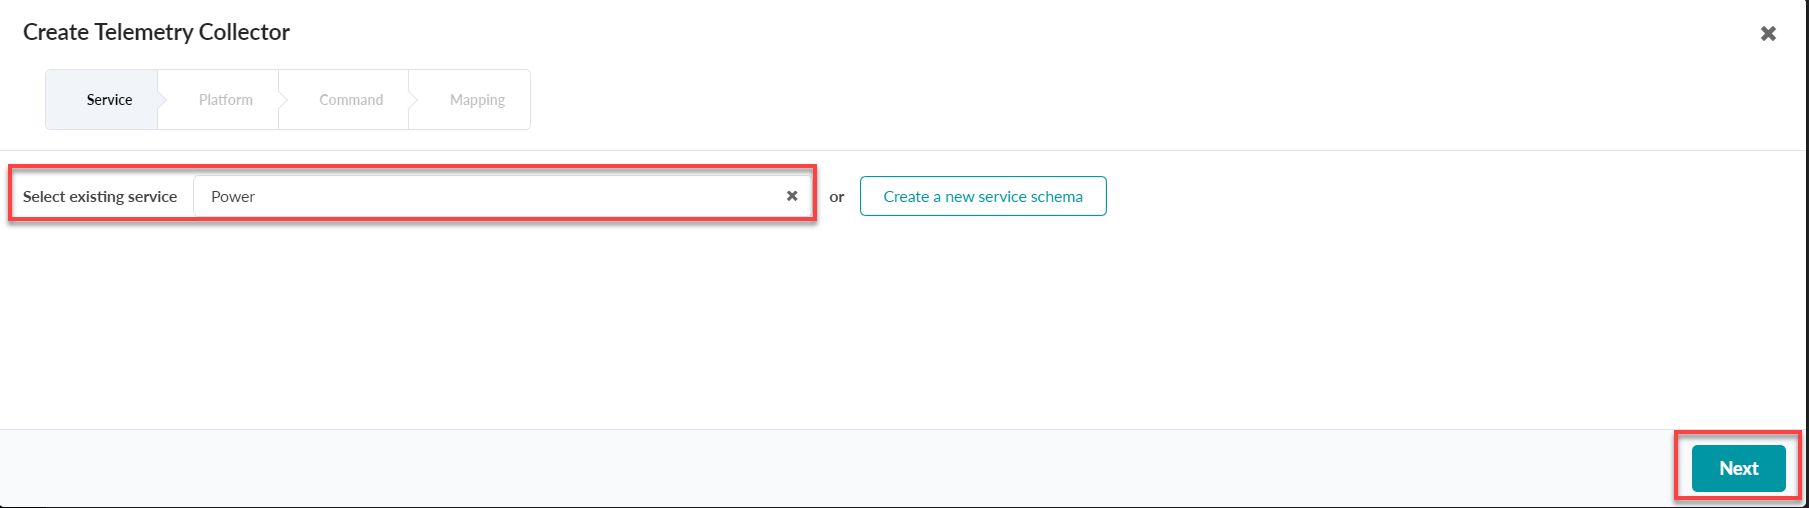
-
Select the existing service schema you just created (in our example,
Power), then click
Next.
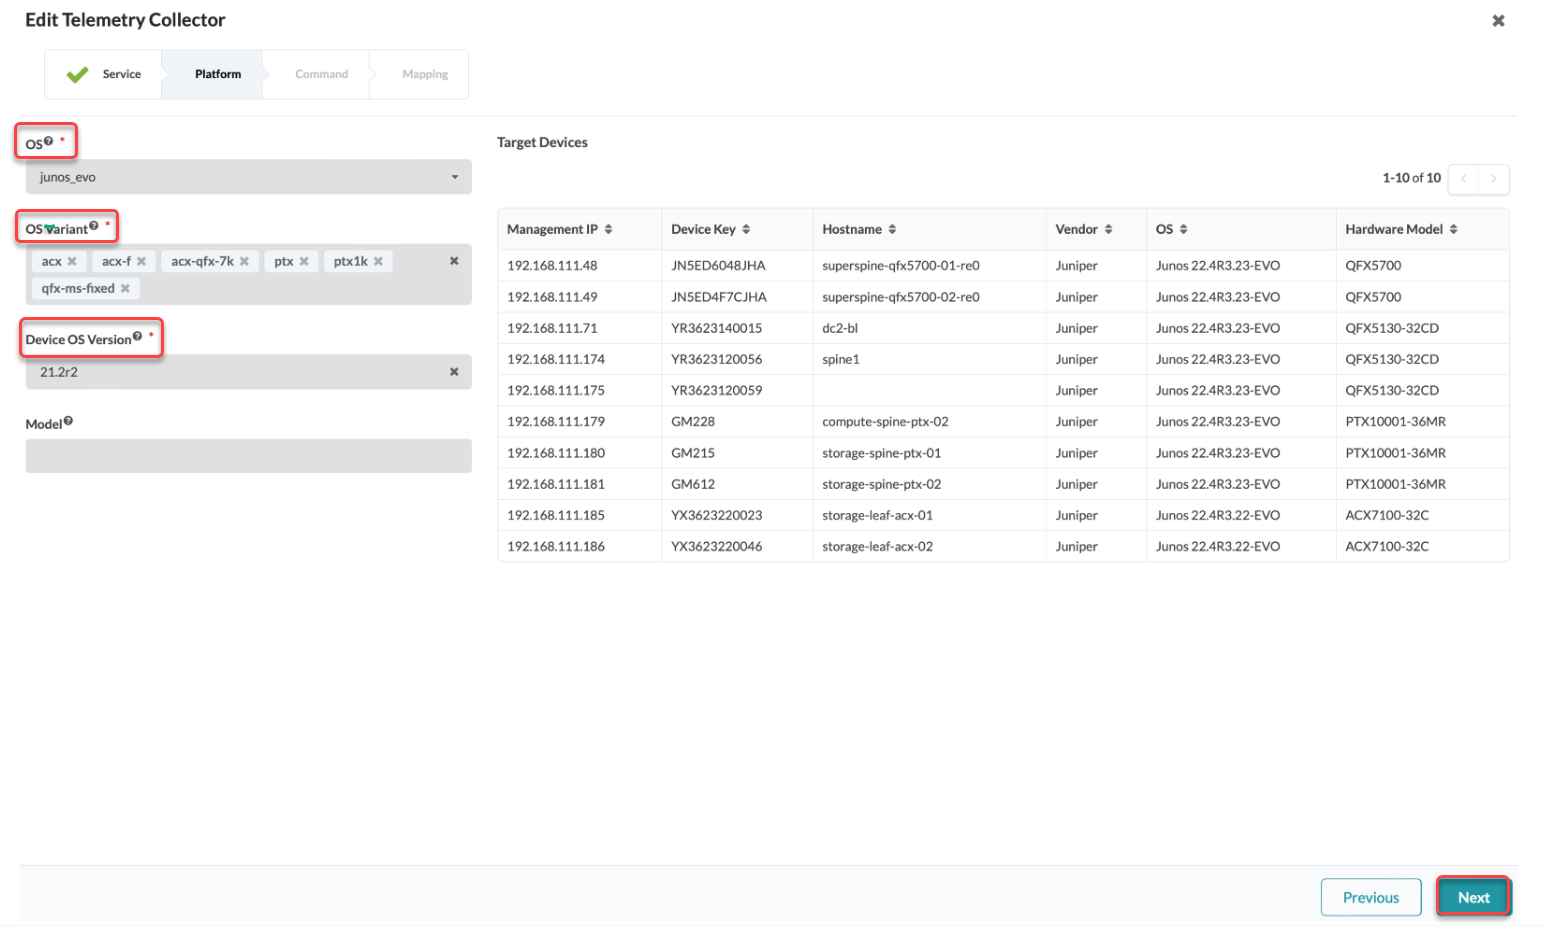
-
Select the platform and devices for your telemetry collection. Defining a
mix of these inputs enables you to be very broad or very granular. For
example, you might want to collect telemetry just from a specific model or
series.
-
Execute the CLI command.
Use the
showcommand to collect data from the device (in our example,show chassis), then click Execute to load the CLI schema.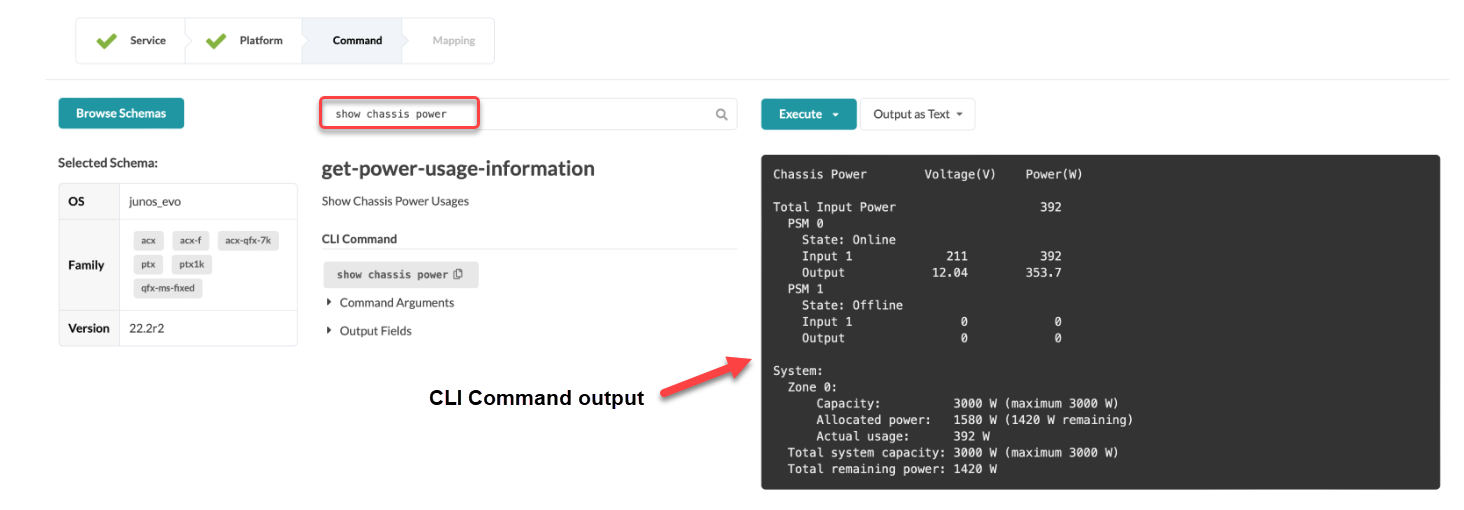 Click Next.
 -
Map the Keys and Value.
So far, we've defined the service schema, the target platforms, and the CLI command the custom telemetry collector will execute. Next, we'll map the key(s) and value type we defined in Step 3. Create a Service Schema.
-
To map the keys, click Expand All to search
for the RPC value you want to map.
-
Assign the value to the key.
In our example, PSM is the key and state is one of the values. This value is populated based on the dynamic
statefield returned by the CLI command as shown in XML output below.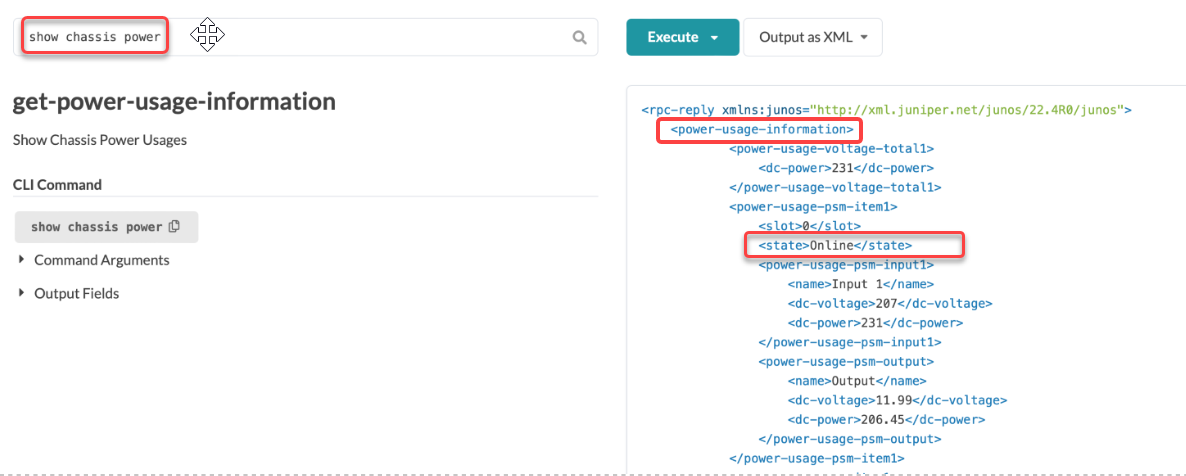
-
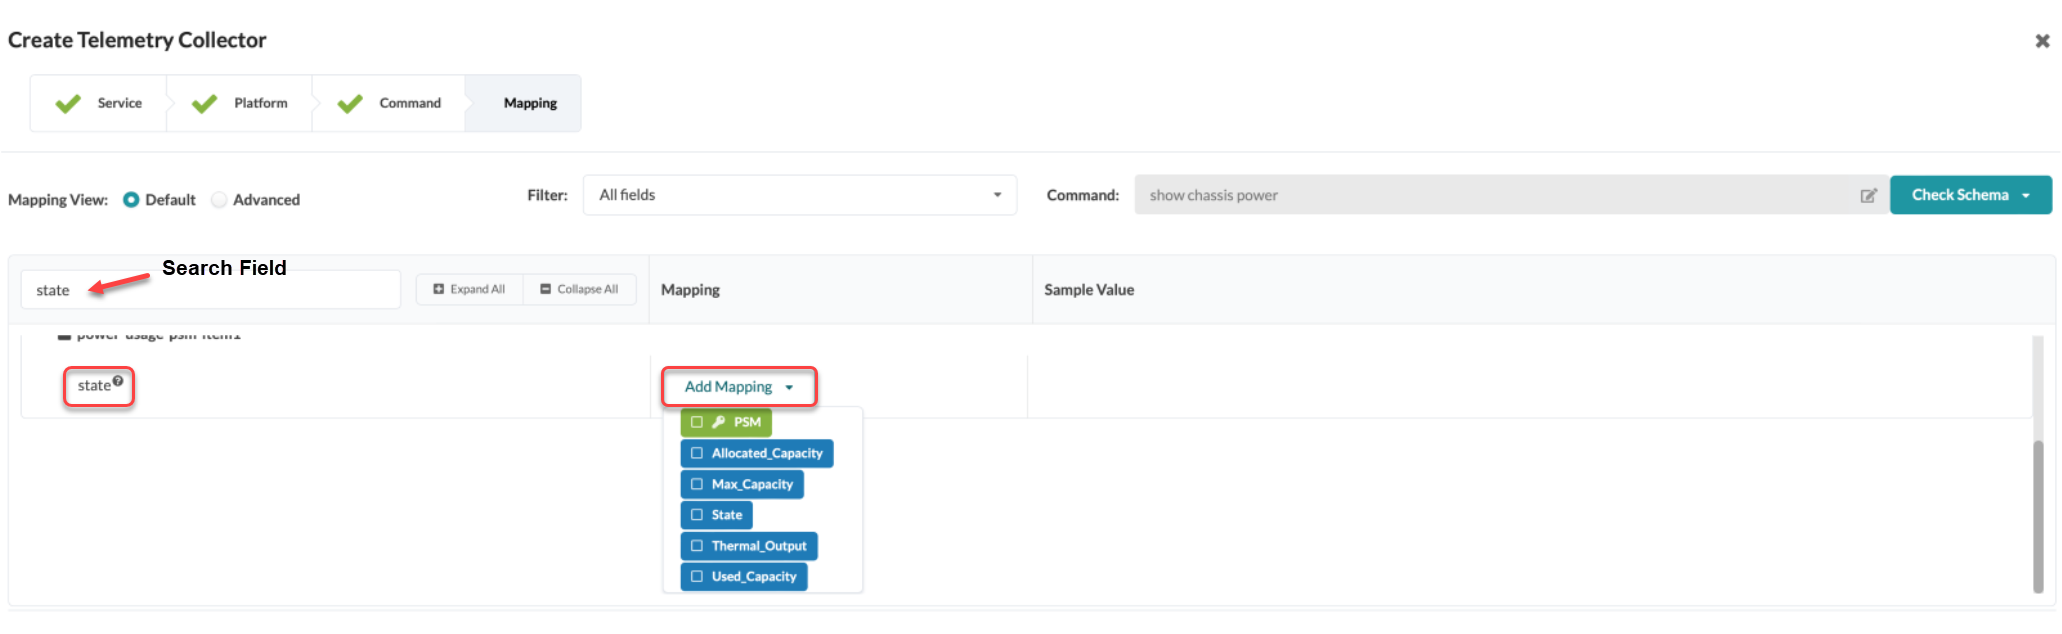
In the Create Telemetry Collector window,
search for the state field, then click
Add Mapping.
-
To map the keys, click Expand All to search
for the RPC value you want to map.
-
Validate that the collector is working.
-
Verify that the query and test results match your expected
results.
-
Verify that the query and test results match your expected
results.
When you define the integer (number) values for a collector, you might need to enter a value expression for the collector to function. This is because Junos occasionally reports number data as a string. Before the collector can be processed, you must perform a conversion from string to integer on the Apstra side.
To define the integer (number) values for a collector, enter int(value) into the Value Expression field, then click Submit.
You can also use additional operators as shown in the figure below. Calculating the Thermal_Output, for example, multiplies the used capacity by 3.41. For more information, see Calculating System Thermal Output.