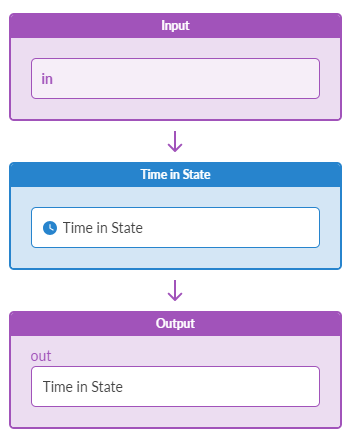
Processor: Time in State
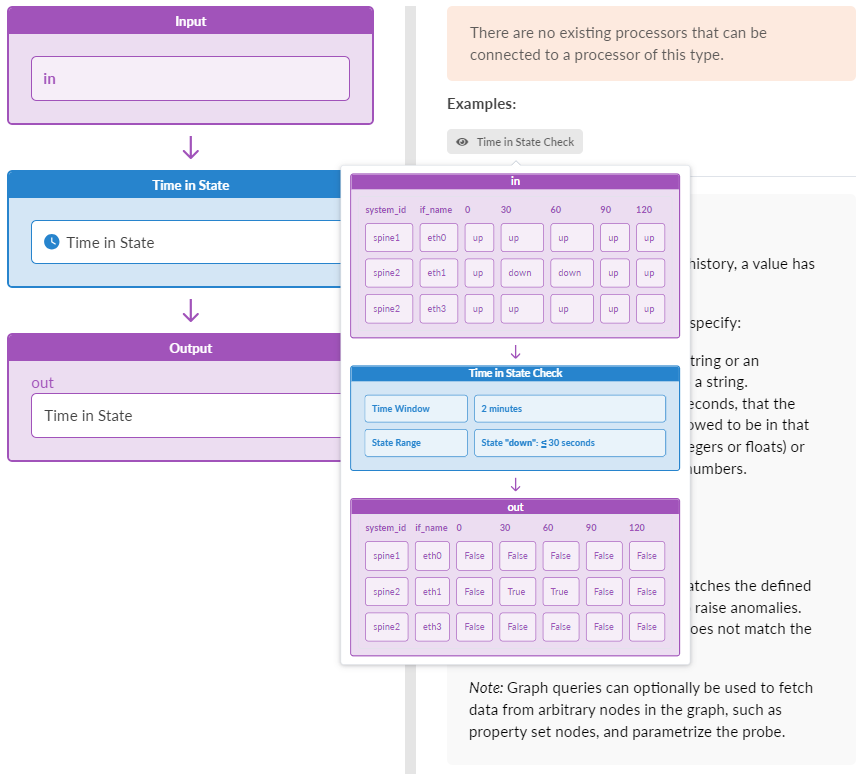
The Time in State processor measures time when a value is in the range. For each input DS, monitor it over the last time_window seconds. If at any moment, for the state in state_range, the amount of time we have been in that state over the last time_window seconds falls into a range specified in the corresponding state_range entry, we set the corresponding output DS to 'true'. Otherwise, the output DS for a given input DS is nominally 'false'. (previously called 'time_in_state_check')
| Parameter | Description |
|---|---|
| Input Types | Discrete-State (DS) |
| Output Types | Discrete-State (DS) |
| Time Window (time_window) | How long to monitor state. (seconds or an expression that evaluates to integer) |
| State Range (state_range) | Map state value to its allowed time range in seconds. dict mapping from a single possible state to a single range of time during the most recent time_window seconds that the value from input state is allowed to be in that state. At least one of the range object's two fields must be specified. The omitted field is regarded as "infinity". The fields are numbers (integers or floats) or expressions evaluated into numbers. State is a string or an expression that evaluates to string. |
| Graph Query (graph_query) |
One or more queries on graph specified as strings, or a list of such queries. (String will be deprecated in a future release.) Multiple queries should provide all the named nodes referenced by the expression fields (including additional_properties). Graph query is executed on the "operation" graph. Results of the queries can be accessed using the "query_result" variable with the appropriate index. For example, if querying property set nodes under name "ps", the result will be available as "query_result[0]["ps"]". In collector processors ( In other processors it is used for general parameterization and it is only supported as a list of queries.
graph_query: "node("system", role="leaf", name="system").
              out("hosted_interfaces").
              node("interface", name="iface").out("link").
              node("link", role="spine_leaf")"
graph_query: ["node("system", role="leaf", name="system")",
              "node("system", role="spine", name="system")"]
Non-collector processors containing the
graph_query: [node("property_set", label="probe_propset", name="ps")]
duration: int(query_result[0]["ps"].values["accumulate_duration"])
Another example is a that probes can validate a compliance requirement; the compliance value may change over time and/or it can be used by more than one probe. Also, a probe can validate NOS versions on devices. In this case, property sets can be used to define the current NOS version requirement. If it changes tomorrow: change the property set value, instead of going under the probe stage. |
| Anomaly MetricLog Retention Duration | Retain anomaly metric data in MetricDb for specified time period |
| Anomaly MetricLog Retention Size | Maximum allowed size, in bytes of anomaly metric data to store in MetricDB |
| Anomaly Metric Logging | Enable metric logging for anomalies |
| Enable Streaming (enable_streaming) | Makes samples of output stages streamed if enabled. An optional boolean that defaults to False. If set to True, all output stages of this processor are streamed in the generic protobuf schema. |
| Raise Anomaly (raise_anomaly) | Outputs “true” and “false” values, “true” meaning an appropriate item is anomalous, and "false" meaning the item is not anomalous. When Raise Anomaly is set to True, an actual anomaly is generated in addition to a sample in the output. |


Example: Time in State
Config is set to:
time_window : 2 seconds
state_range: { "down" : [{"max": 1},] }
The above configuration means that for the input DS, we will set output to True and optionally raise an anomaly if the input is in the "down" state for more-than one second out of the last two seconds.
In the sample below, certain values are capitalized to indicate what has changed from the previous time.
Sample Input at time t=0
[if_name=eth0] : "up"
[if_name=eth1] : "up"
[if_name=eth3] : "up"
Sample Output at time t=0
[if_name=eth0] : "false"
[if_name=eth1] : "false"
[if_name=eth3] : "false"
Sample Input at time t=1:
[if_name=eth0] : "up"
[if_name=eth1] : "down"
[if_name=eth3] : "up"
Sample Output at time t=1
[if_name=eth0] : "false"
[if_name=eth1] : "false"
[if_name=eth3] : "false"
Sample Input at time t=2:
[if_name=eth0] : "up"
[if_name=eth1] : "down"
[if_name=eth3] : "up"
Sample Output at time t=2
[if_name=eth0] : "false"
[if_name=eth1] : "true"
[if_name=eth3] : "false"
Sample Input at time t=3:
[if_name=eth0] : "up"
[if_name=eth1] : "up"
[if_name=eth3] : "up"
Sample Output at time t=3
[if_name=eth0] : "false"
[if_name=eth1] : "True"
[if_name=eth3] : "false"
Sample Input at time t=4:
[if_name=eth0] : "up"
[if_name=eth1] : "up"
[if_name=eth3] : "up"
Sample Output at time t=4
[if_name=eth0] : "false"
[if_name=eth1] : "false"
[if_name=eth3] : "false"
If expressions are used for min or max fields for states specified in the state property, then they are evaluated for each input item which results into item-specific thresholds. Properties of the respective output items are extended by range_min or range_max keys with calculated values.
If state key is an expression, output items are extended with state key. The same applies for time_window property.
Configuration:
time_window : int(100/context.severity)
state_range: { context.ref_state : [{"max": "int(20*(context.severity/5.0))"}] }
Sample Input at times t=0..6:
[if_name=eth0,severity=1,ref_state=down] : "down"
[if_name=eth1,severity=2,ref_state=down] : "down"
Sample Output at time t=6:
[if_name=eth0,range_max=4,time_window=100,state=down] : "true"
[if_name=eth1,range_max=8,time_window=50,state=down] : "false"
