Optical Transceiver Analytics Report
This topic provides an overview of the optical transceiver reports you can generate in the ApstraGUI. To learn how to generate this report, see Generate an Analytics Report.
The Optical Transceiver (XCVR) report analyzes optical transceivers telemetry patterns and trends.
Built-in telemetry for optical interfaces is analysed in the optical receivers probe. To generate a report, you must enable the necessary probes that analyze built-in telemetry for optical interfaces. The probes check real-time values against manufacturers' default thresholds specified in transceivers and summarizes statistics for each interface. If any threshold is exceeded within a specified period, the probe marks the interface as anomalous and raises an anomaly.
The Optical Transceivers probe monitors optical statistics based on the following telemetry data:
-
Temperature: measured in Celsius (C) of the physical port (interface stats)
-
Voltage: measured in Volts (V) of the physical port (interface stats)
-
Transmit Power Level: measured in decibel-milliwatts (dBm) of each optical lane (lane stats)
-
Receive Power Level: measured in decibel-milliwatts (dBm) of each optical lane (lane stats)
-
Transmit Bias: measured in millAmps (mA) of each optical lane (lane stats)
Analysis of Interface-based Metrics
In this section, we analyze interface-based temperature metrics for optical transceivers. The charts provide examples of analyzing temperature measurements. You can use the same method to measure voltage.
Vendor/Part Inventory Pie Chart
Figure 1 shows the number of transceivers grouped by vendor and part. The collector retrieves transceiver vendor and model numbers from the hardware and aggregates this information into a pie chart. The pie chart displays the relative portions between different vendors and parts, providing you with the exact number of parts observed in the data center.
Figure 2 shows the same type of transceiver inventory information based on media type you are using, such as 10GBASE LR or 40GBASE LX4.
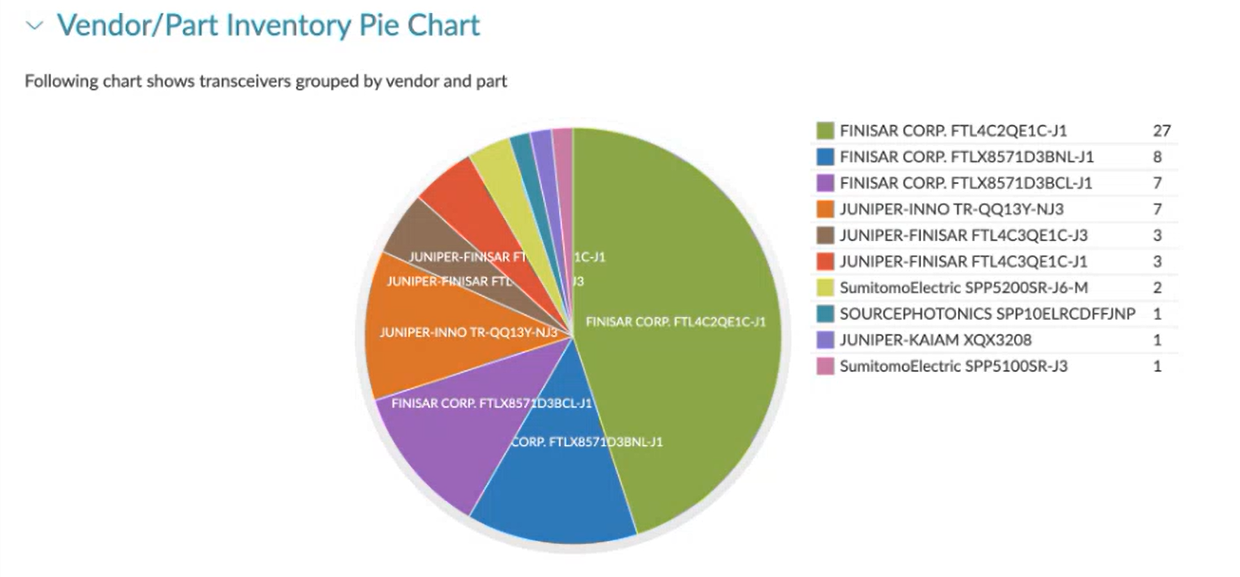
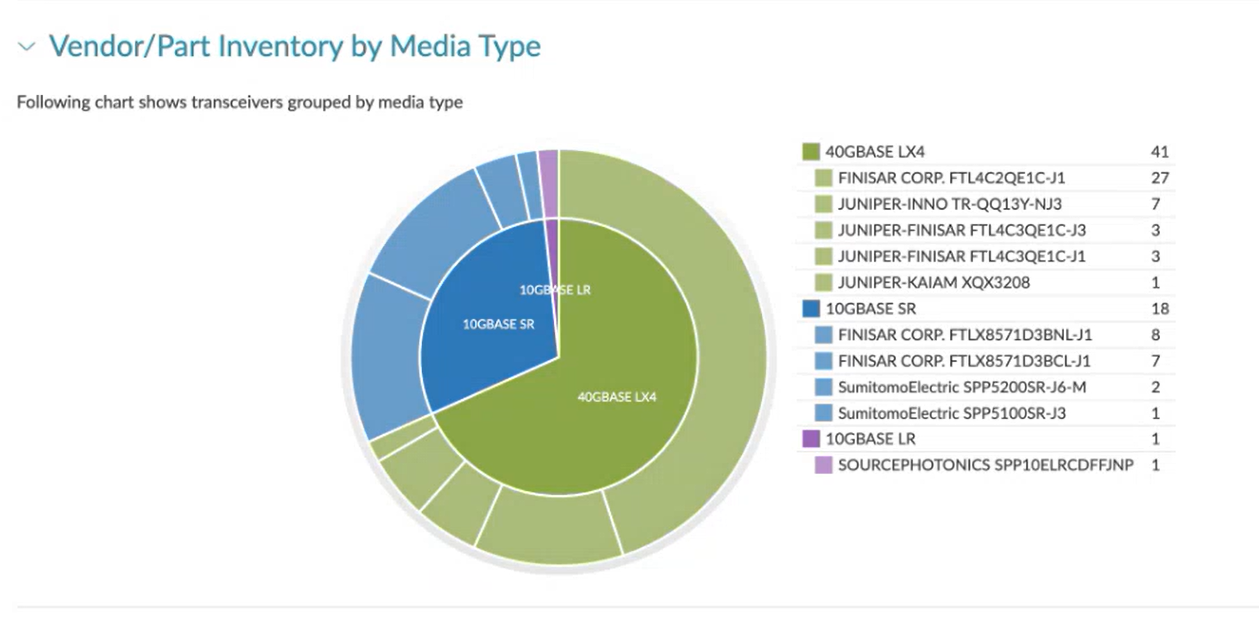
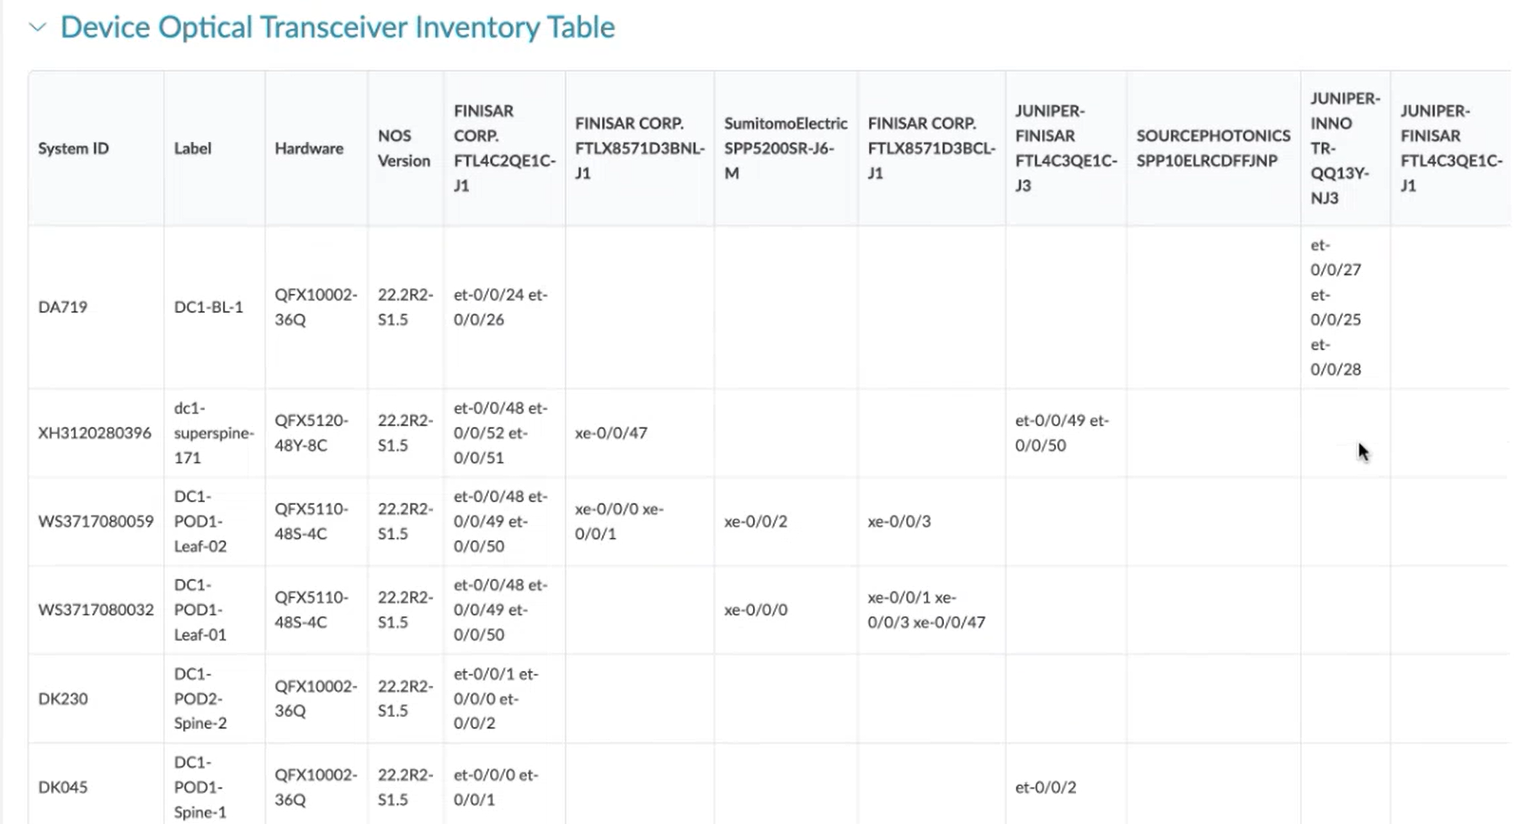
Figure 3 shows the metadata for each device and the mapping of each device's interfaces to their respective vendor and part numbers.
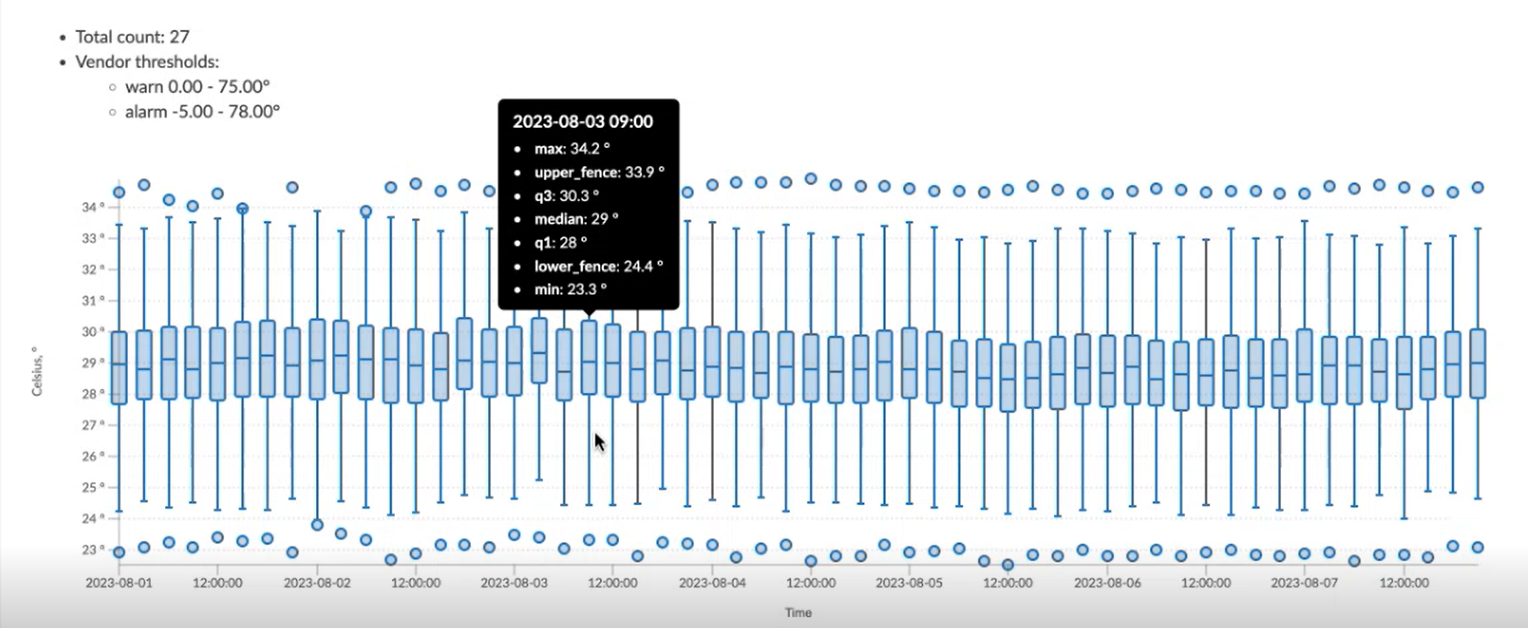
The Trend Analysis chart (Figure 4) groups all data collected by the vendor and parts. We use Interquartile Range (IQR) to present this trend analysis, measuring data dispersion over time to identify normal ranges and their frequency.
This report uses the following formulas to calculate IQR thresholds:
-
Q0 = Minimum value, ie 0th percentile
-
Q1 = Lower quartile corresponds to 25th percentile
-
Q2 = Median 50th percentile
-
Q3 = Upper quartile corresponds to 75th percentile
-
Q4 = Maximum value, ie 100th percentile
-
IQR = Q3 - Q1
-
Lower Fence = Max (Q0, Q1 - 1.5 * IQR)
-
Higher Fence = Min (Q4, Q3 + 1.5 * IQR)
Q1, Q2, and Q3 are used to render the box in the middle of the plot. The lower and upper values are used to render the whiskers for the temperature IQR distribution of the top 5 vendors/parts.
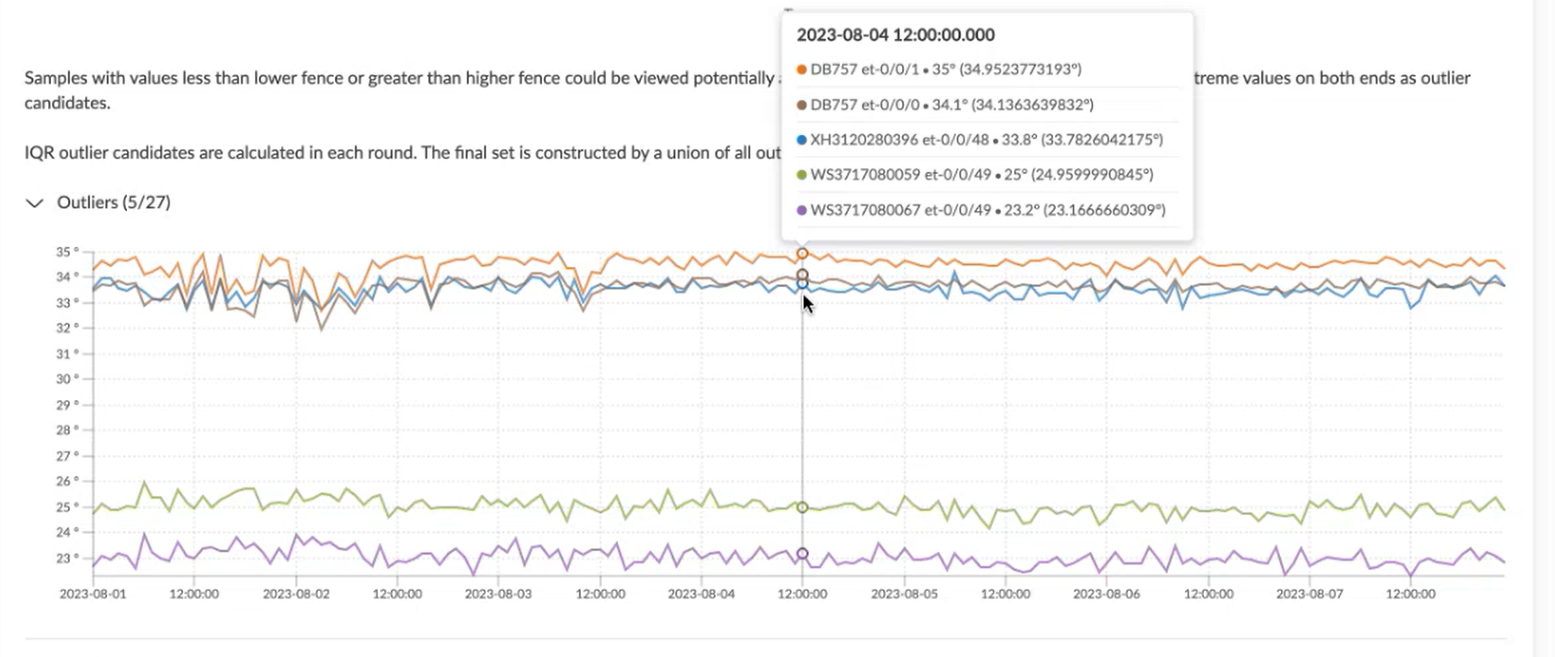
Samples whose values fall outside the lower and higher fences may be considered abnormal. Two samples with extreme values at both ends in the chart are considered outlier candidates (dots shown at the top and bottom of the chart).
We calculate IQR candidates during each round. The final set is the union of all outlier candidates from all rounds. The lines in the outliers chart (Figure 5) represent outlier transceivers with temperatures that are too high or too low. This determination is based on the IQR for this particular group.
FCS Error Observation
FCS (Frame Checksum Sequence) detects checksum errors from optical transceiver traffic probes, helping identify corrupted frames or causes of checksum failures. These checksum errors indicate corruption. If corruption occurs, only these checksum errors are observed. In case FCS errors are observed, we display a line chart showing FCS errors per second for a particular system interface combination.