Import and Export Services
Export and Import a Service from the Service Registry
The service registry, which holds the service schema
and the collector, allows you to export and import services. In our example, we're
exporting one collector, but a service can include multiple collectors.
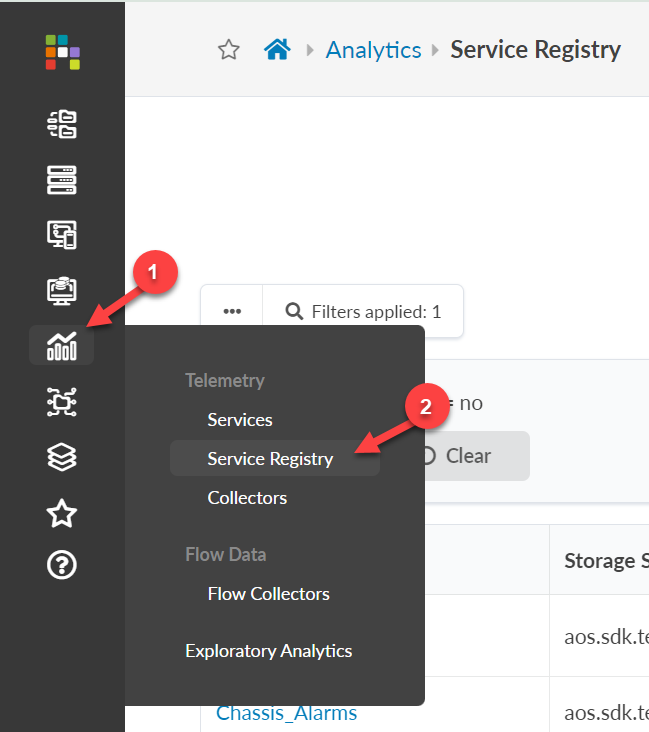
To export a service from the service registry:
-
From the left navigation pane in the Apstra GUI, navigate to
Analytics > Service Registry.
-
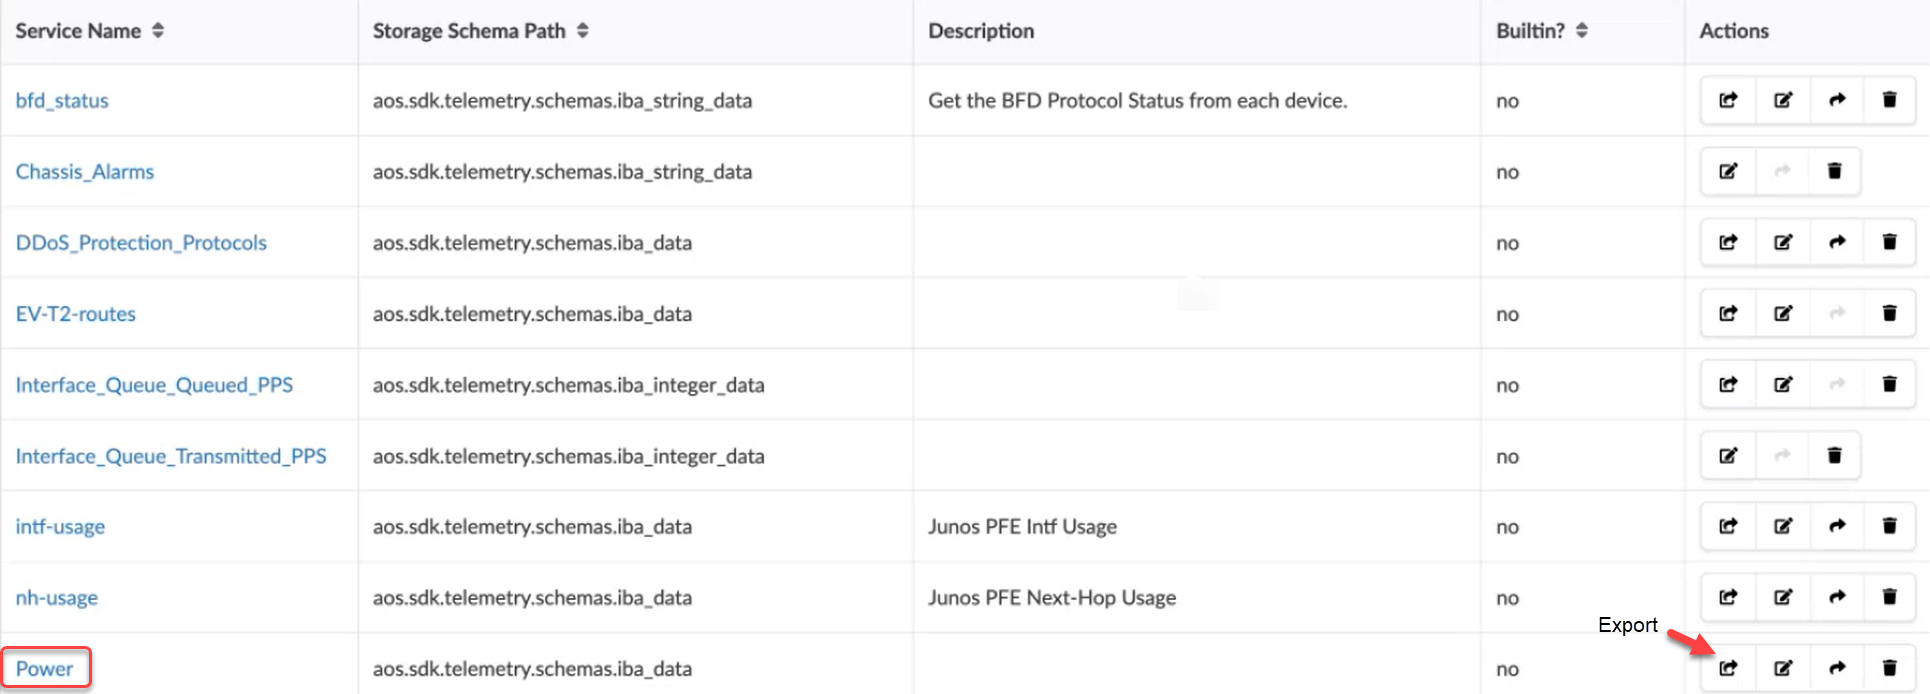
Select your service from the registry table (in this example, Power), then
click the Export button.
-
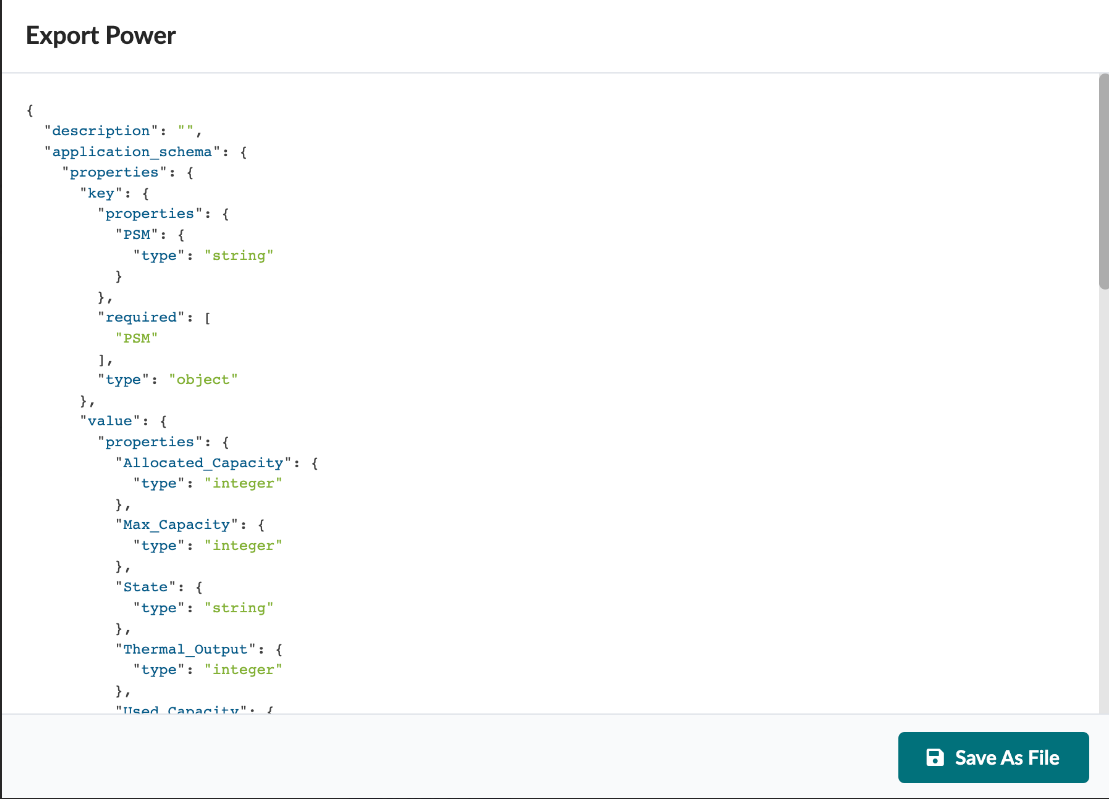
The schema that you export contains the service schema and collector info,
as you can see in the example below. You can then import this file into a
different instance.
Exporting and Importing a Service from the Apstra Flow Dashboard (Recommended)
You can export and import a service from the Apstra
Flow dashboard. The dashboard holds the probe definitions.
To export a service from the dashboard:
-
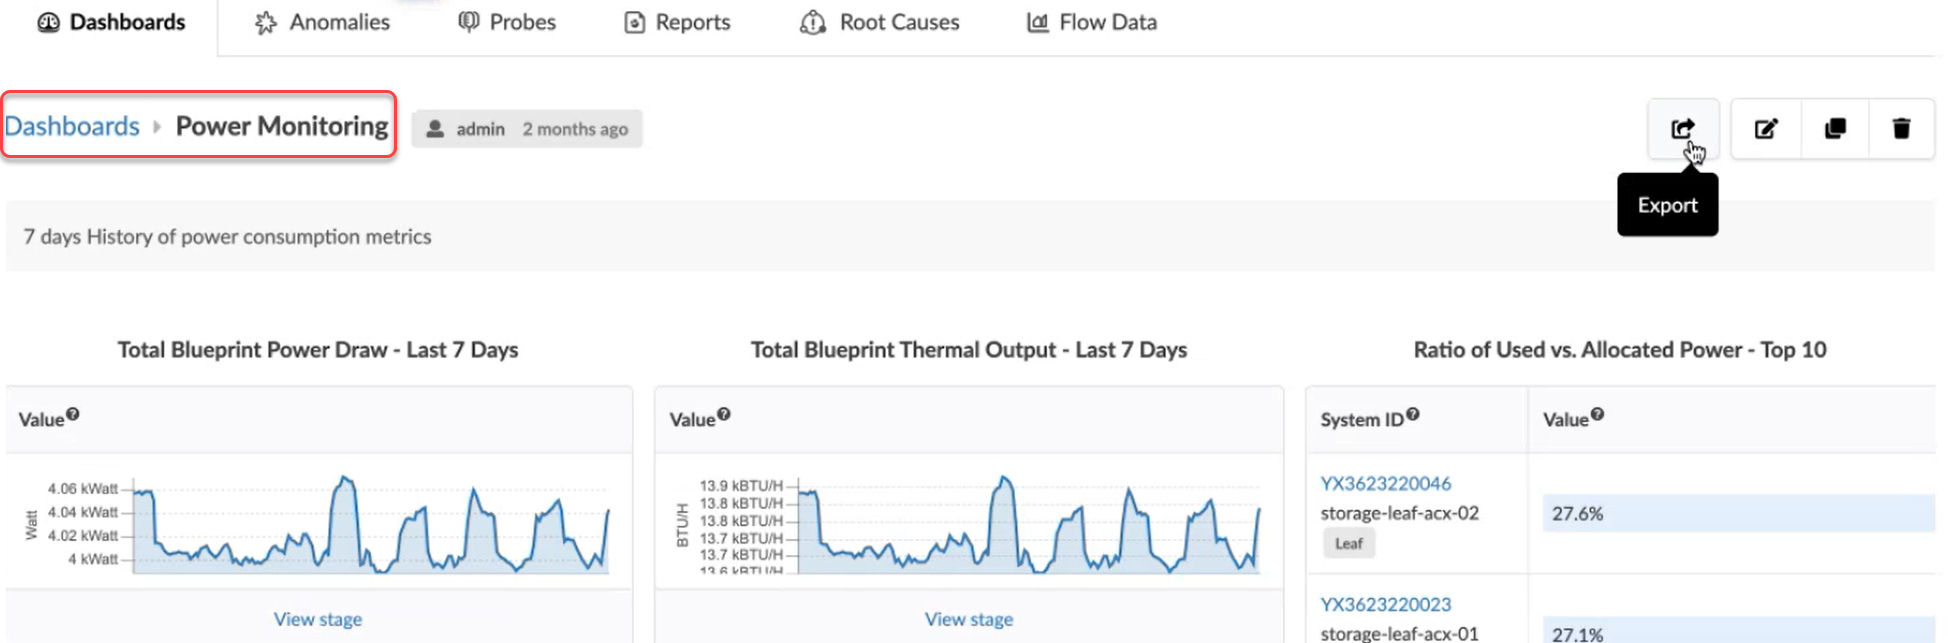
From the dashboard table, select your probe (Power monitoring, for
example). Then click the Export button to see the
power monitoring dashboard.
-
Exporting your dashboard generates a schema with the probe information as
shown in the following example. You can then import this file to a different
instance.