Help us improve your experience.

Let us know what you think.

Do you have time for a two-minute survey?


Create a Custom Telemetry Collector

This topic describes the steps required to create a custom telemetry collector.

In this topic, we'll walk you through creating your own custom telemetry service using power-related metrics as an example.

Step 1. Execute the CLI Command

Starting in Apstra version 4.2.0, you can run CLI show commands for Junos devices directly from the Apstra GUI. Although you can run show commands without opening a CLI session, its primary purpose is to help you create your own custom telemetry collectors.

You can execute CLI commands from within a staged or active blueprint (shown in our example), or from the Devices > Managed Devices page.

Note:

Before you get started, identify the CLI command that you want to use for the output values. In this procedure, we're using the show chassis power command as an example.

To execute the CLI command:

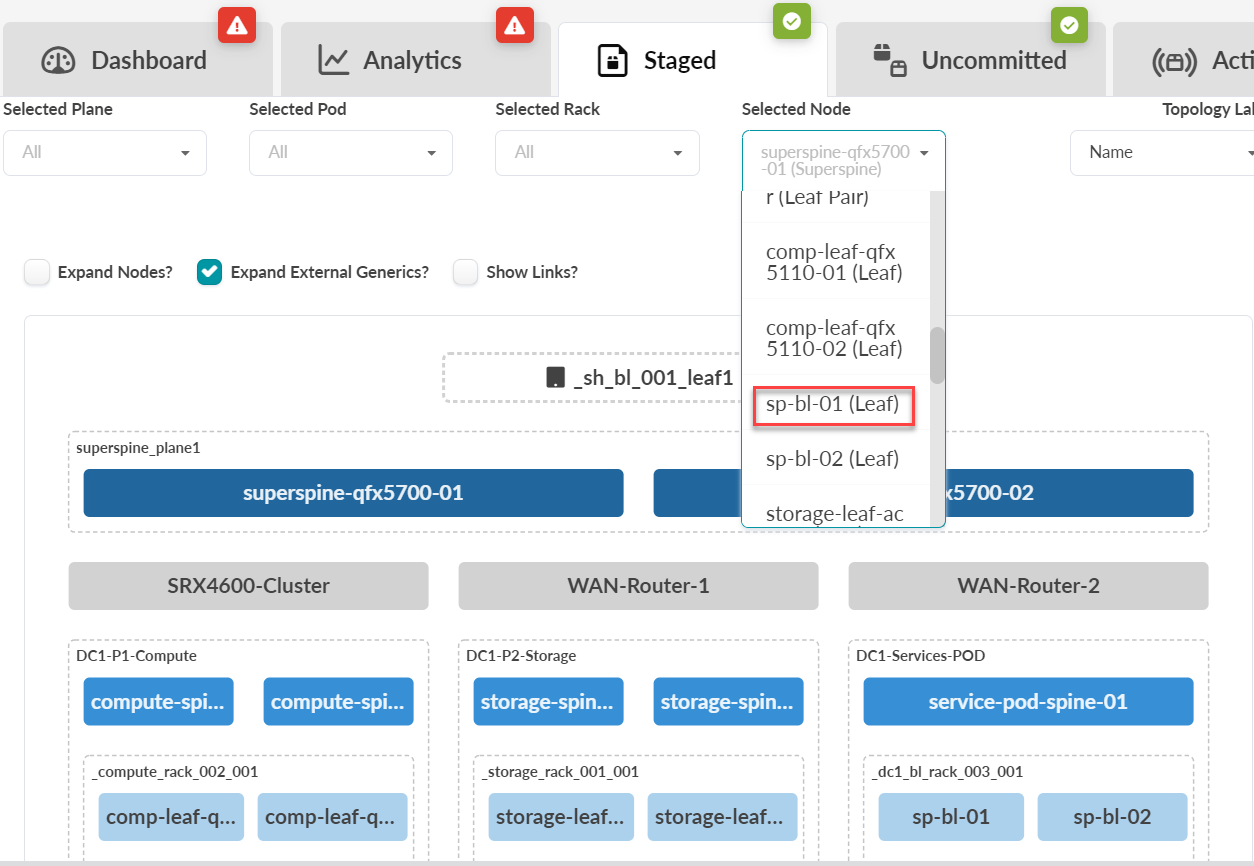
  1. From your deployed blueprint, select Staged > Physical > Topology, then select your Juniper device node. In this example, sp-bl-01 (Leaf).
    Network topology tool screenshot showing a hierarchical view with superspine, spine, and leaf nodes. Tabs include Dashboard and Analytics with warning icons. Dropdowns filter Plane, Pod, Rack, and Node. Highlighted node is sp-bl-01 Leaf.
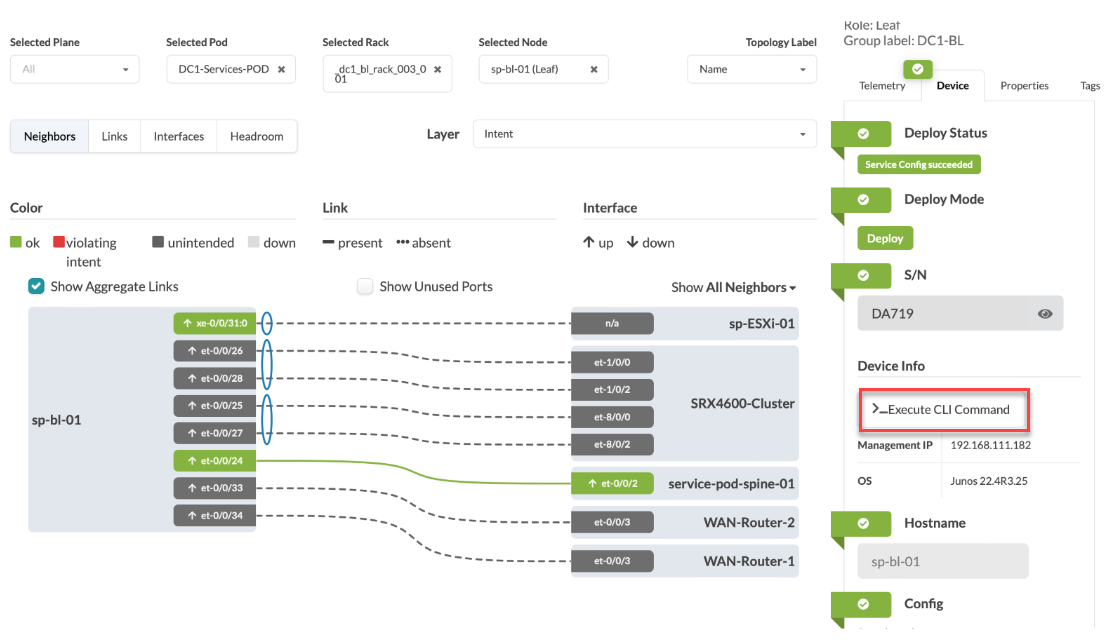
  2. In the Selection section that appears in the right panel, on the Device tab, select Execute CLI Command.
    Network management interface showing selected plane, pod, rack, and node filters, topology view with nodes like sp-bl-01, link statuses, device info, and CLI options.
    In the dialog box that opens, select how you want to view the results: Text Mode, XML Mode, or JSON mode.
    Execute CLI Command interface with fields for serial number DA719, IP 192.168.111.182, hostname sp-bl-01, command input, mode selection, and execute button. Only show commands supported.
    Note:

    The CLI supports only Junos show commands. You cannot run commands that affect the device state, such as request system reboot. For information about the various show commands, see the CLI User Guide for Junos OS.

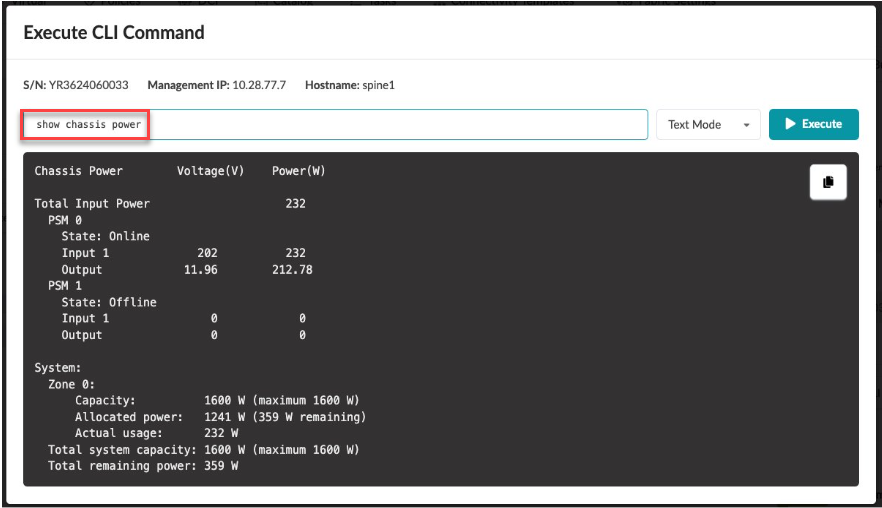
    Here is an example of the CLI output in Text Mode.
    CLI execution screen for spine switch spine1 with IP 10.28.77.7 showing `show chassis power`. PSM 0 online, 202V input, 232W power. PSM 1 offline. Zone 0: 1600W capacity, 1241W allocated, 232W used. 359W remaining.
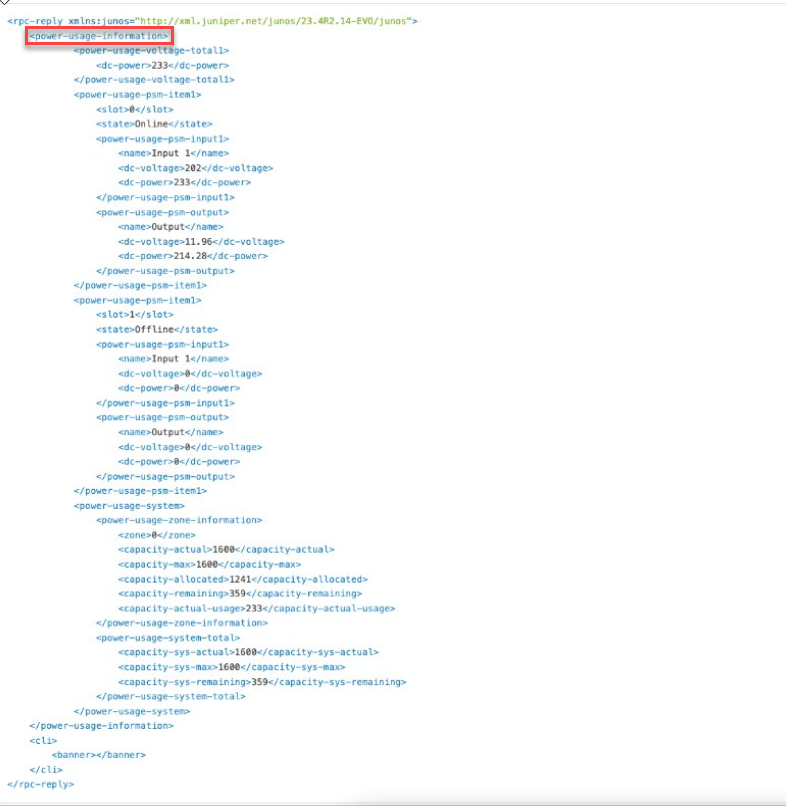
    Here is an example of the CLI output in XML Mode.
    XML response from Juniper Networks device showing power usage: total power, PSM states (Online/Offline), voltage and power values, actual and max capacities, and system-wide power usage insights.
    In this example, the output shows the power usage information for the device. This power information is what we'll use to create our telemetry collection service.

Step 2. Identify the Keys and Values of Interest from the CLI Output

The following steps show you how to use the CLI show command to view the power utilization for your devices.
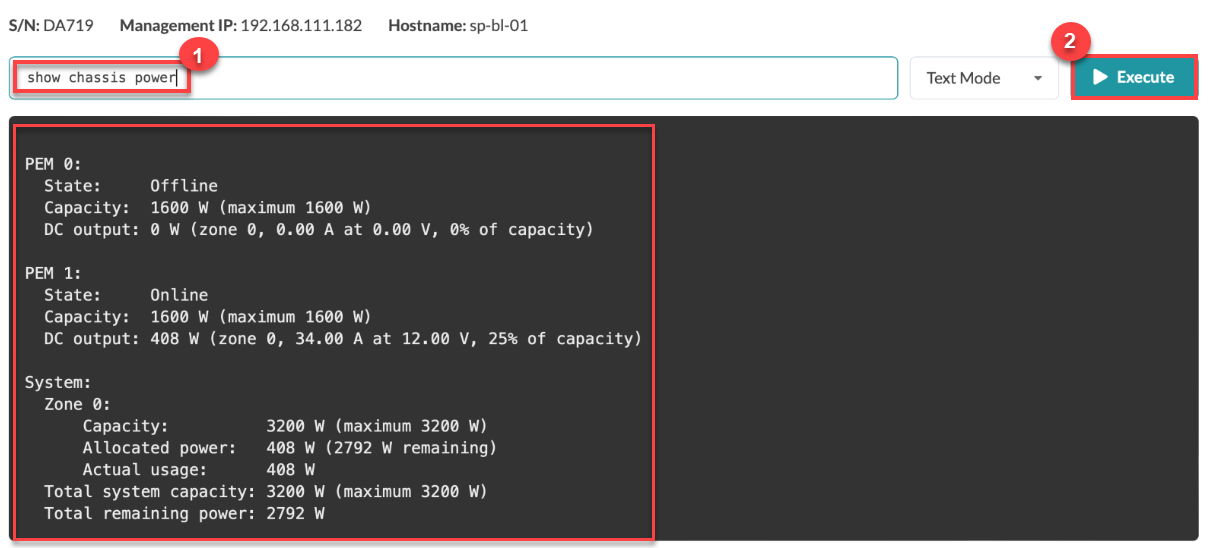
  1. Enter the CLI show command (in this example, show chassis power).
  2. Click Execute to view the power utilization information.
    Command output showing chassis power: PEM 0 offline, 1600W capacity; PEM 1 online, 1600W capacity, 408W output. Total capacity 3200W, 2792W remaining.
  3. Continue to Step 3. Create a Service Schema.

Step 3. Create a Service Schema

You must create a service schema to define how you want your data to be structured and stored.

A service defines your schema. You can create a service for a schema with a single output value or multiple output values. This procedure shows how to create a schema with multiple output values.

To create a service schema:

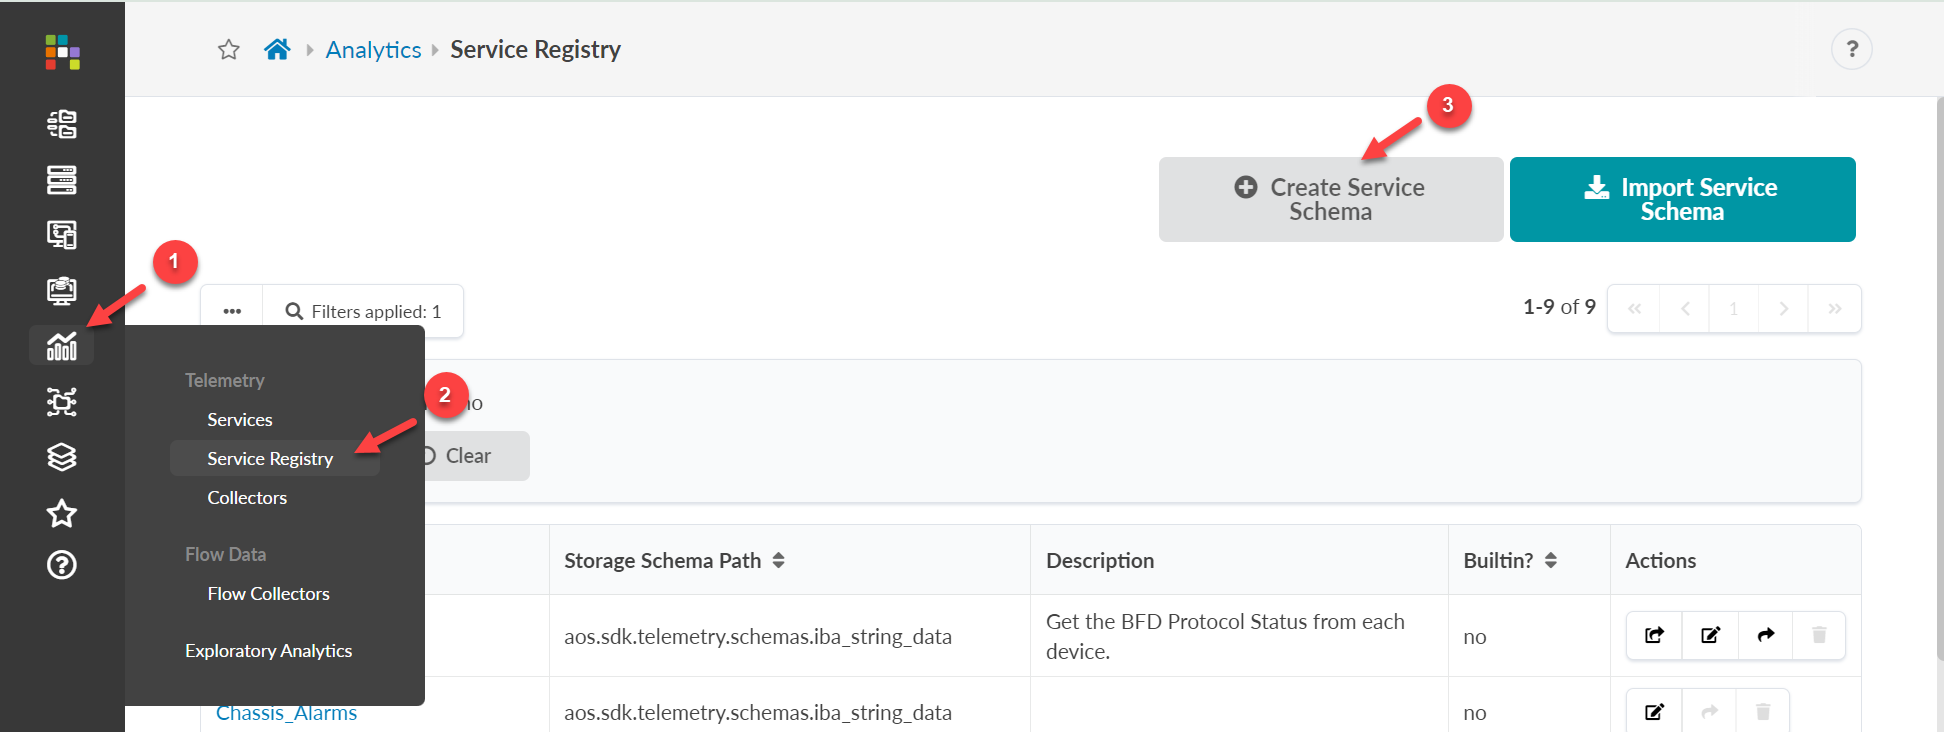
  1. From the left navigation menu in the Apstra GUI, navigate to Analytics > Service Registry, then click Create Service Schema.
    Software interface showing Service Registry in Analytics section with options to Create or Import Service Schema and a table of service details.
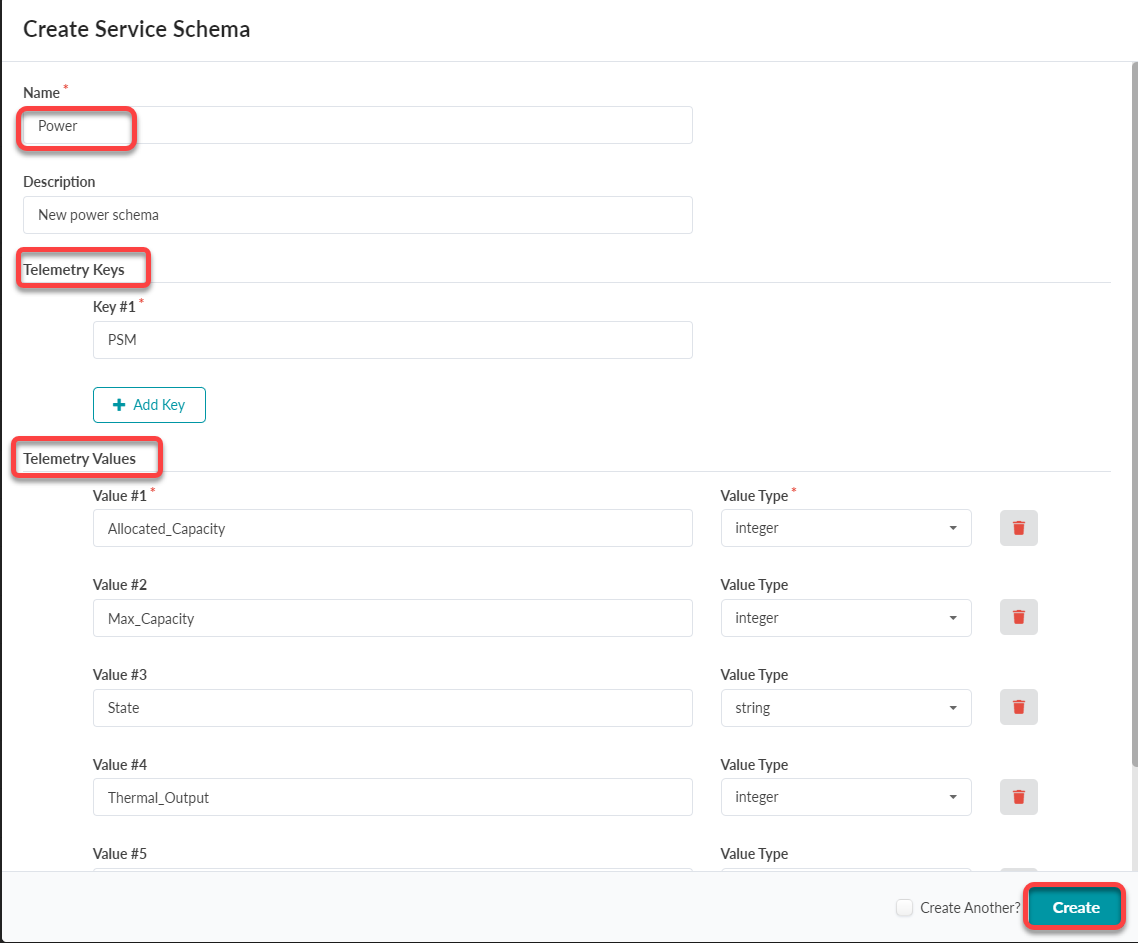
  2. Define your schema.
    Create Service Schema form interface with Name field Power, Description New power schema, Telemetry Keys PSM, Telemetry Values Allocated_Capacity integer, Max_Capacity integer, State string, Thermal_Output integer. Add Key and Create buttons available. Create Another checkbox present.
    Specify the Telemetry Keys and Telemetry Values.
    In Apstra, the telemetry keys and value type are a collection of key-value pairs.
    • The telemetry key represents the identity of your service, such as Interface_name or Power_Supply_Module . The Value name might be Tx_rate or, for power monitoring, Voltage or Power_Draw.

    • The value type is the data produced by the telemetry service, which can be a String (text) or a an Integer (whole number).

    In our example, we've created a service schema that has multiple output values. We specified the PSM (Power Supply Module) as the Service Key and added multiple Service Values for Allocated Capacity, Max_Capacity, State, Thermal_Output, and Used_Capacity.
    Note:

    For more information about PSM's (also referred to as PEMs), see Managing Power in the Juniper Chassis-Level User Guide.

  3. Click Create to finish creating your schema.
    The new service schema is added to the Service Registry table.
    Service Registry in Analytics shows a table with service details: Power service, schema path aos.sdk.telemetry.schemas.iba_data, description Power Consumption, not built-in, with edit and delete icons. Filters applied for non-built-in services. Create and import schema buttons present.

Step 4. Create a Telemetry Collector

So far, you've defined the data you want to collect and determined how the data will be organized and structured. Our final step is to create a telemetry collector for our service.

Note:

A service is composed of one or multiple collectors. In this example, the service has a single collector.

.
To create a telemetry collector:
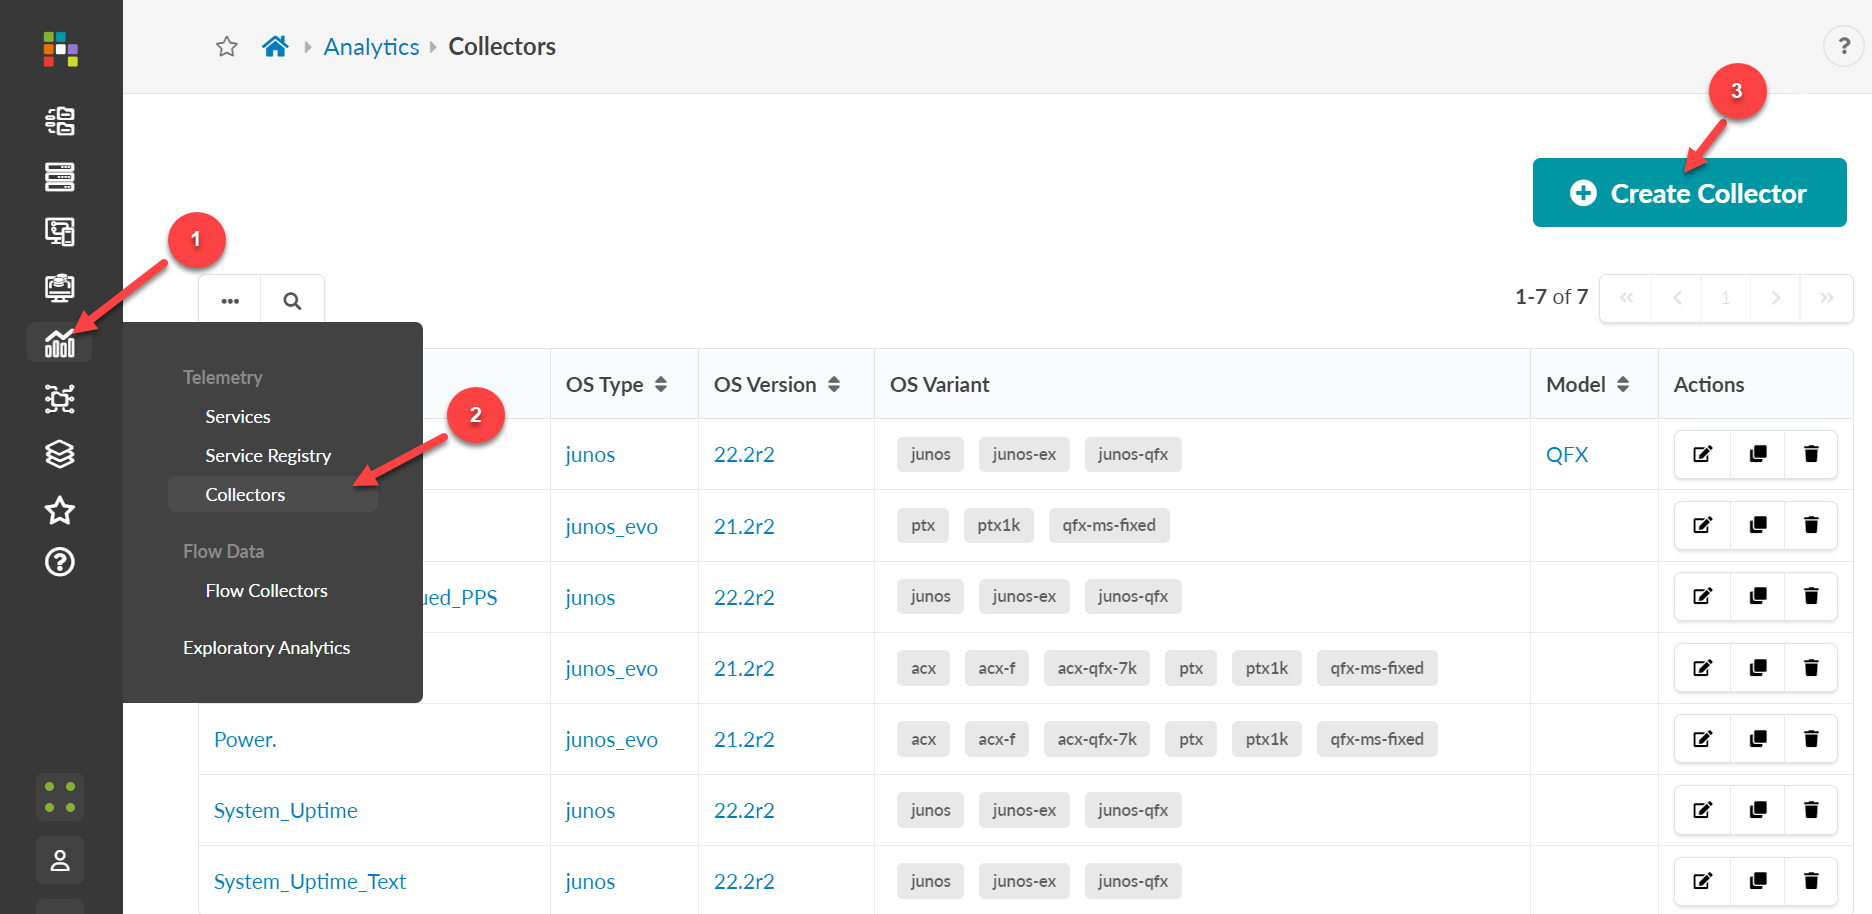
  1. From the left navigation pane, navigate to Analytics > Collectors, then click Create Collector.
    Screenshot of a web app showing a Collectors table with columns for OS Type, Version, Variant, and Model. A teal Create Collector button is in the top-right corner.
  2. Select the existing service schema you just created (in our example, Power), then click Next.
    Create Telemetry Collector interface showing step 1: Select Service with "Power" chosen. "Next" button at bottom right.
  3. Select the platform and devices for your telemetry collection. Defining a mix of these inputs enables you to be very broad or very granular. For example, you might want to collect telemetry just from a specific model or series.
    Configuration interface for editing telemetry collector with active Platform tab. Selected OS is junos_evo. Device types: acx, acx-f, ptx, qfx-ms-fixed. Device OS Version 21.2r2. Target devices table lists management IP, device key, hostname, vendor Juniper Networks, OS version, and hardware model. Navigation buttons Previous and highlighted red Next.
    1. Select the OS type , either junos or junos-evo.
      Note:

      If you do not specify the junos_evo collector for Junos OS Evolved devices, the collector uses the corresponding Junos definition. This means if you use the same command between the different devices, you only need to create a single Junos collector definition for that service. If the command resides only on junos_evo, you'll need to create a single collector definition specifically for junos-evo.

      For more information about junos-evo (also known as Junos OS Evolved), see the Junos OS Evolved documentation.
    2. Select the OS Variant the device belongs to and determine the CLI schema for a given device.
      This field accepts multiple entries. If you select multiple entries, the intersection of schemas is used.
    3. Select the minimum OS Version the device must run for the collector to execute. If you have multiple collector definitions with different OS versions for the same service, the collector automatically chooses the one closest to the version the device is running.
    4. (Optional) Specify a Model or a regular expression to filter based on a device model or series.
      The table shows a list of target devices currently managed in Apstra and matches the applied combination of filters.
    5. Click Next.
  4. Execute the CLI command.
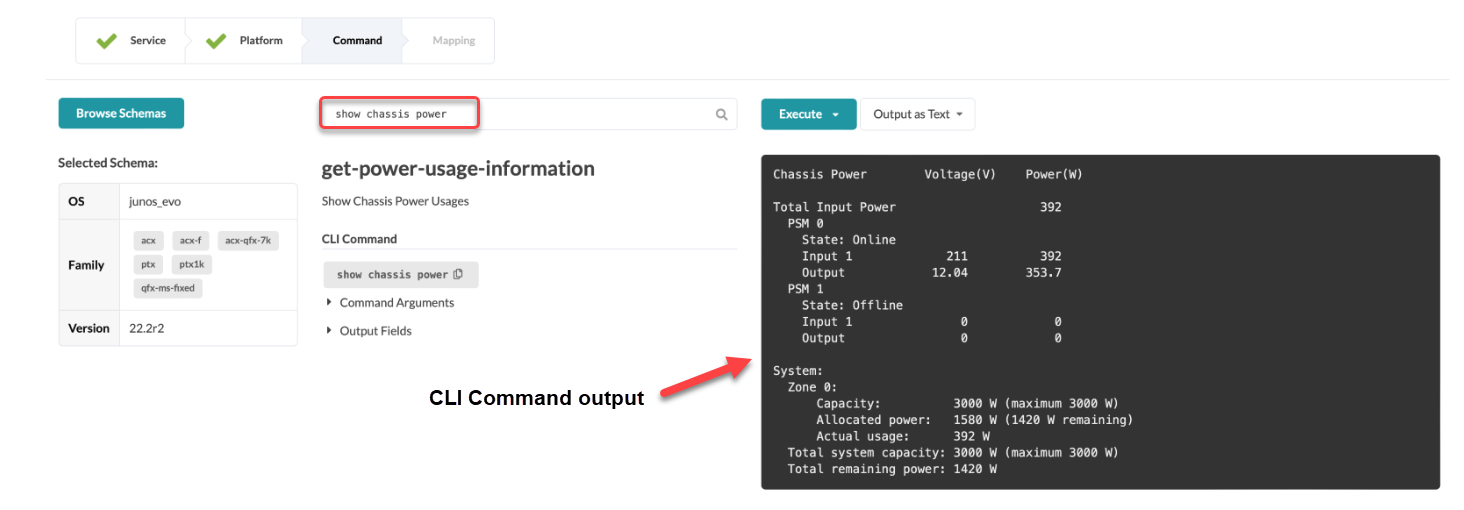
    Use the show command to collect data from the device (in our example, show chassis), then click Execute to load the CLI schema.
    Command-line interface showing chassis power usage with command 'show chassis power' entered; schema as junos_evo, device family as acx, version 22.2r2. Output includes total input power of 392W and PSM details.
    Click Next.
  5. Map the Keys and Value.
    So far, we've defined the service schema, the target platforms, and the CLI command the custom telemetry collector will execute. Next, we'll map the key(s) and value type we defined in Step 3. Create a Service Schema.
    1. To map the keys, click Expand All to search for the RPC value you want to map.
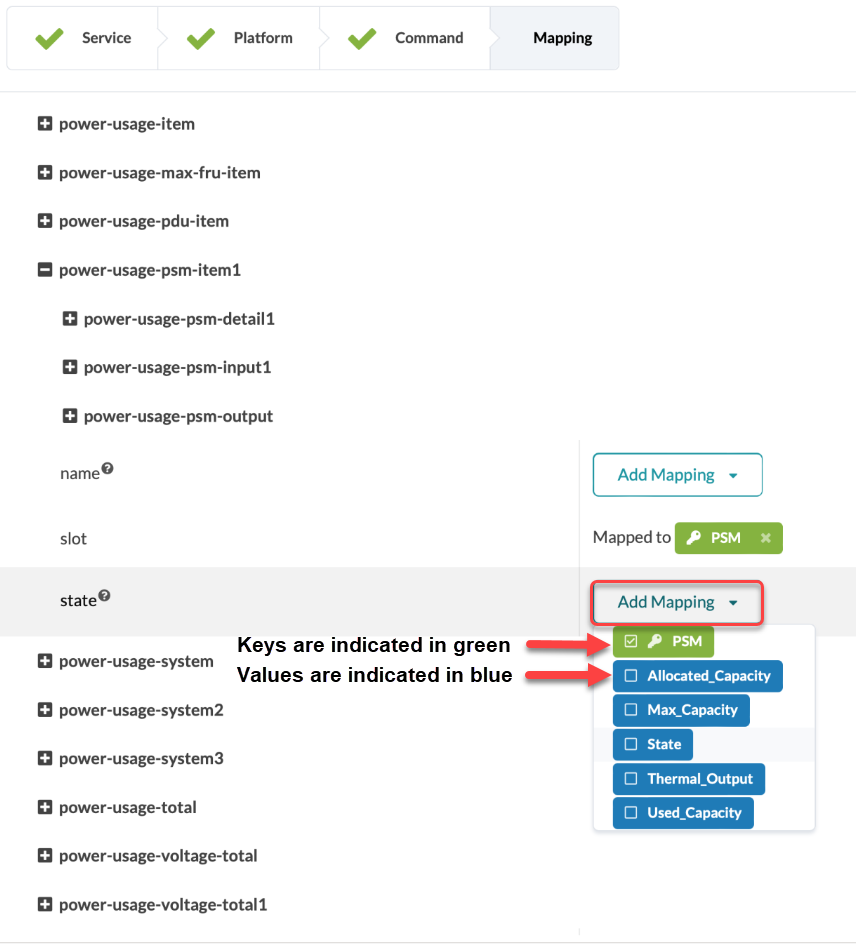
      Power usage mapping interface showing hierarchical list of items with expandable details. Add Mapping section with dropdown options Allocated_Capacity, Max_Capacity, State, Thermal_Output, and Used_Capacity. Mapping step in progress bar selected.
    2. Click Add Mapping to map each value to a key.
    3. Assign the value to the key.
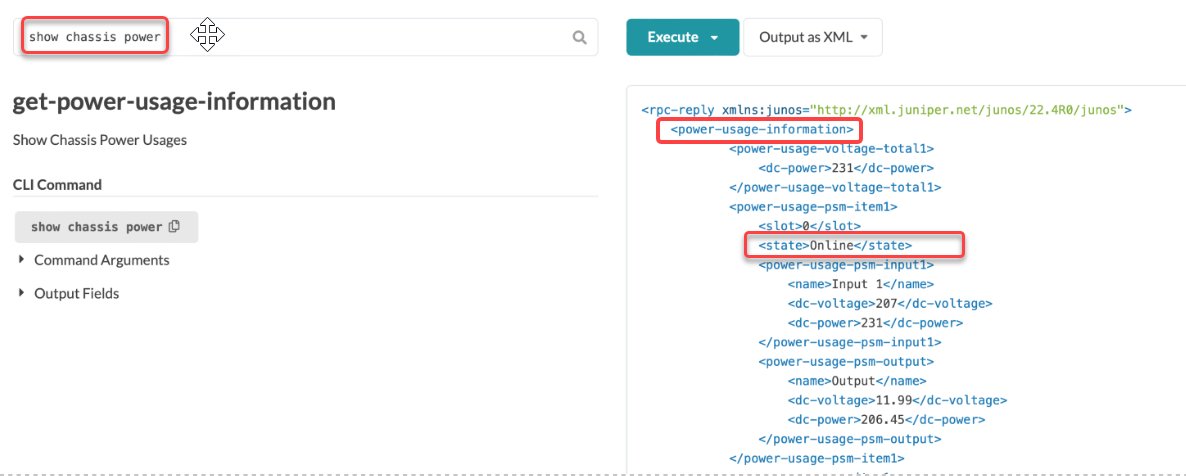
      In our example, PSM is the key and state is one of the values. This value is populated based on the dynamic state field returned by the CLI command as shown in XML output below.
      Juniper Networks interface showing `show chassis power` command output with power usage details in XML format, indicating PSM state is Online.
    4. In the Create Telemetry Collector window, search for the state field, then click Add Mapping.
      Create Telemetry Collector interface with Mapping tab selected; search field for state, command field with show chassis power, Add Mapping dropdown, and Check Schema button.
    5. Map the state field to each value, then click Submit.
  6. Validate that the collector is working.
    1. Click the Advanced option button on the Create Telemetry Collector page.
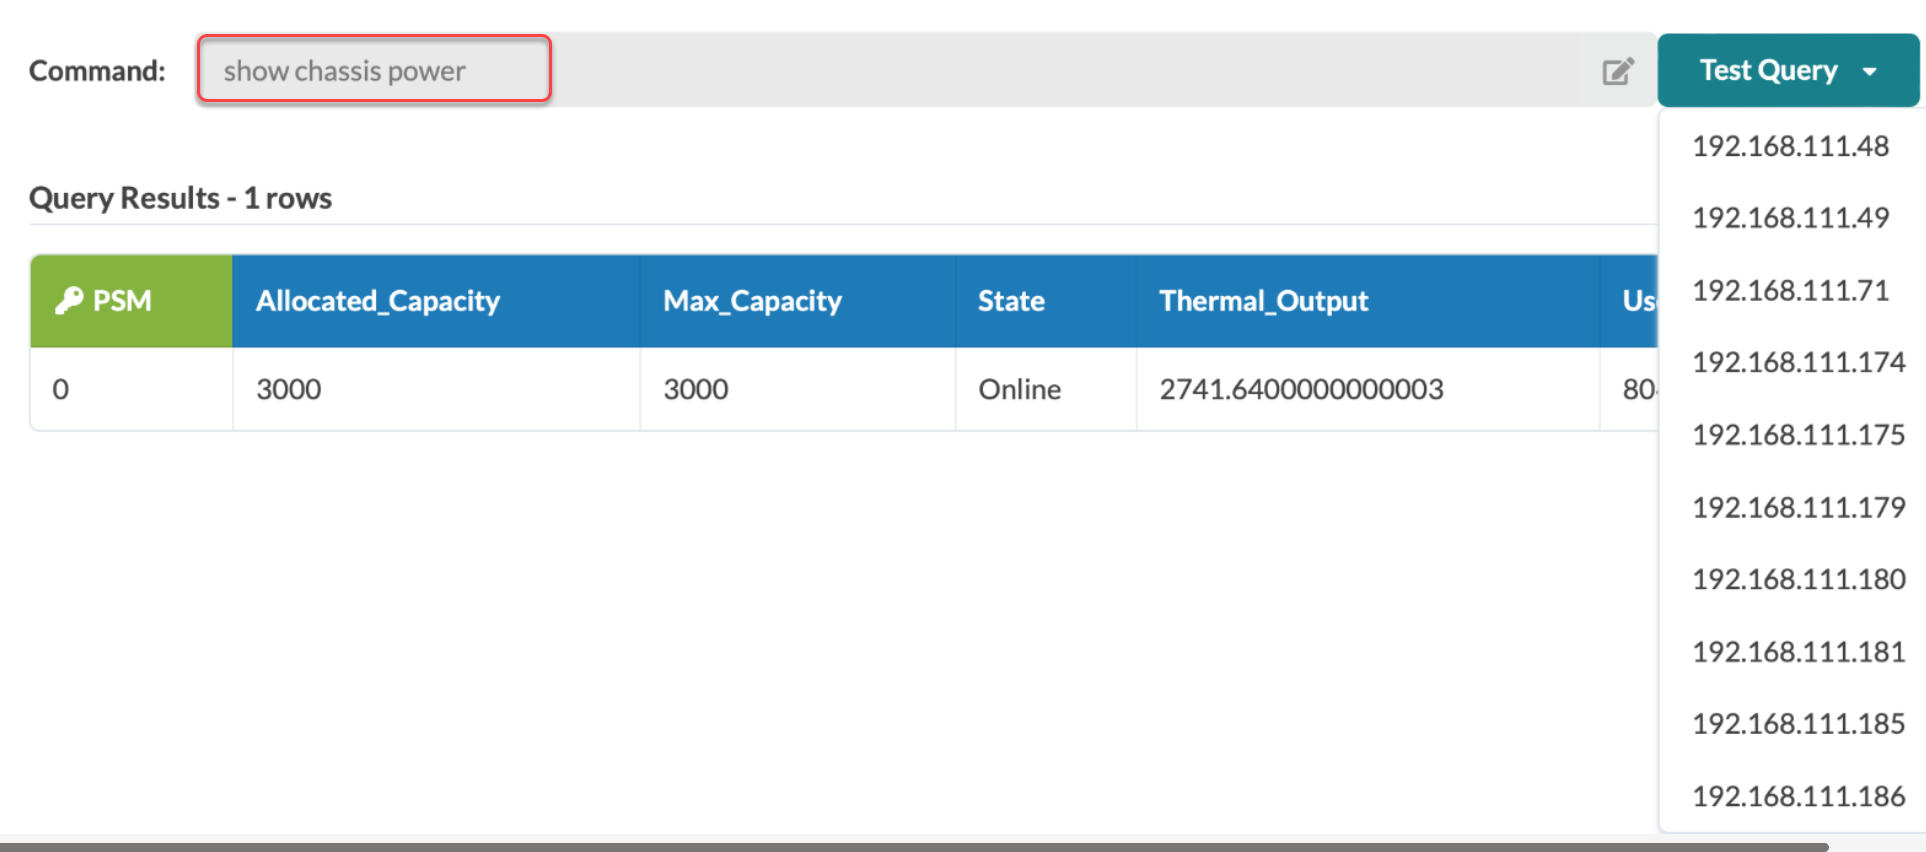
    2. Verify that the query and test results match your expected results.
      Network monitoring tool showing chassis power query results: PSM 0, Allocated Capacity 3000, Max Capacity 3000, State Online, Thermal Output 2741.64, Usage 80 percent. Dropdown menu with IP addresses on the right.
Congratulations! You successfully created a collector.
Note:

When you define the integer (number) values for a collector, you might need to enter a value expression for the collector to function. This is because Junos occasionally reports number data as a string. Before the collector can be processed, you must perform a conversion from string to integer on the Apstra side.

To define the integer (number) values for a collector, enter int(value) into the Value Expression field, then click Submit.

You can also use additional operators as shown in the figure below. Calculating the Thermal_Output, for example, multiplies the used capacity by 3.41. For more information, see Calculating System Thermal Output.
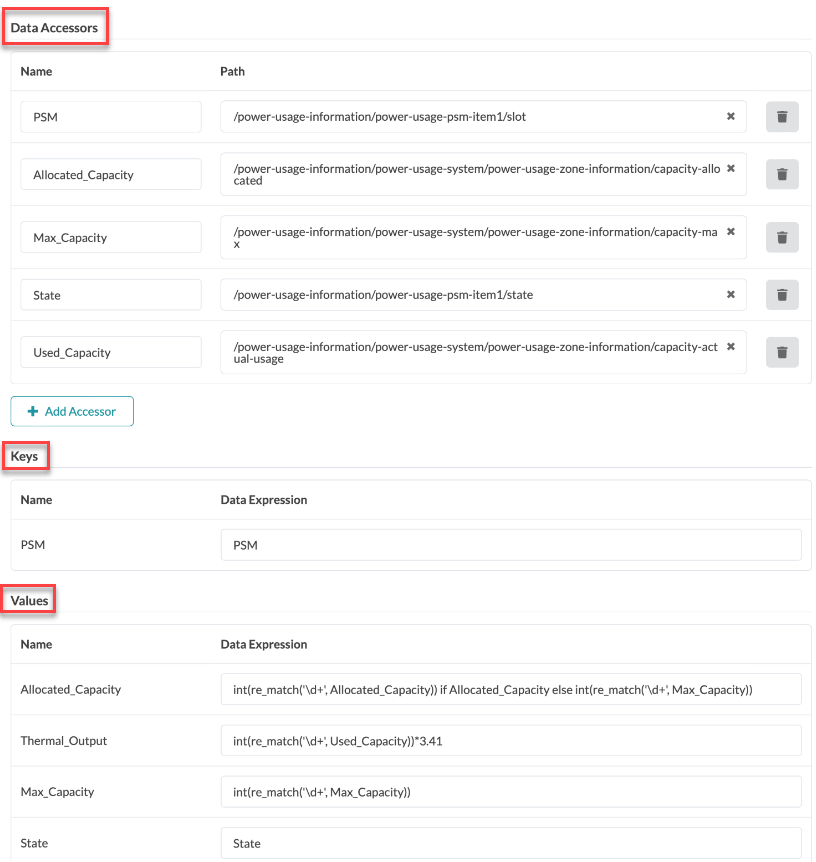
Configuration interface for defining data accessors, keys, and values in a software application. Data Accessors section maps names to data paths. Keys section defines keys with names and data expressions. Values section specifies logic for deriving values like Allocated_Capacity and Thermal_Output.