Apstra Telemetry and Intent-Based Analytics
What Is Intent-Based Analytics?
Intent-Based Analytics (IBA) helps you with any operational status changes in your infrastructure by extracting knowledge out of raw telemetry data.
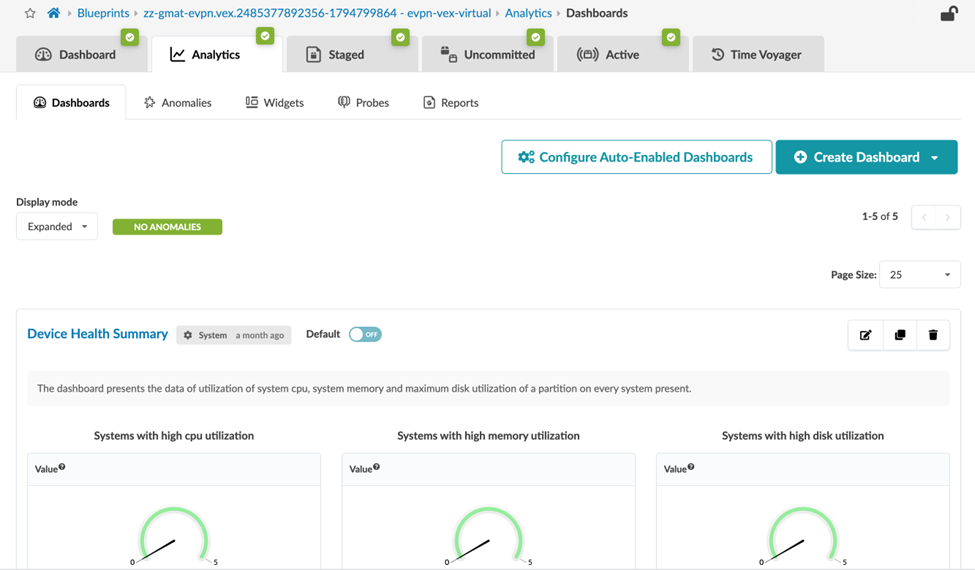
You configure IBA in the Apstra GUI. From the left navigation menu, click Blueprints. Select your blueprint and then navigate to the Analytics tab in the dashboard.
IBA Probes
In IBA, probes represent a single analytics pipeline. A probe is a configurable data-processing pipeline that enables you to set up conditions of interest (situations to watch). IBA probes fetch data, apply processing, and then compares the result against expectations.
IBA probes:
- Collect different types of telemetry data from managed devices.
- Enrich the data with contextual information from the blueprint.
- Aggregate and process the raw data into more meaningful data such as average over time, state in time, standard deviation, and so forth.
- Generate anomalies when the network deviates from an intended state and streams the anomalies as alerts to external systems, as necessary.
Probes are available as either predefined probes or user-defined (custom) probes. When you deploy a blueprint, some predefined probes are enabled automatically. You can enable other predefined probes on-demand from a catalog as described in the Predefined Probes Catalog.
Telemetry Services
You can view a list of telemetry services currently activated in your Apstra deployment. Each service represents a different type of data that Apstra collects from managed devices. For each telemetry service, Apstra issues different CLI show commands over the device API to ingest the data utilized in IBA. CLI show commands are also used to configure a gRPC sensor path. See the Junos Telemetry Interface User Guide.
From the left navigation menu, click Device > Telemetry > Services.
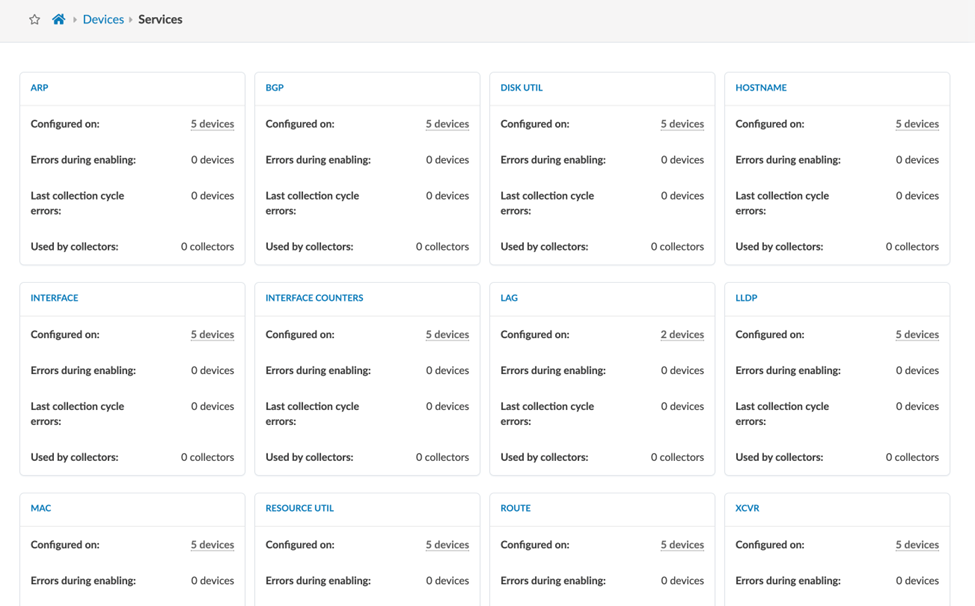
The raw data that Apstra collects does not appear in the Telemetry Services page. The raw data output is only shown and visualized in IBA probes.
Auto-Enabled Probes
When you deploy a blueprint, several IBA probes are automatically enabled. IBA probes are used to monitor essential information about the managed fabric and generates anomalies when it detects degradations in the device health or fabric performance.
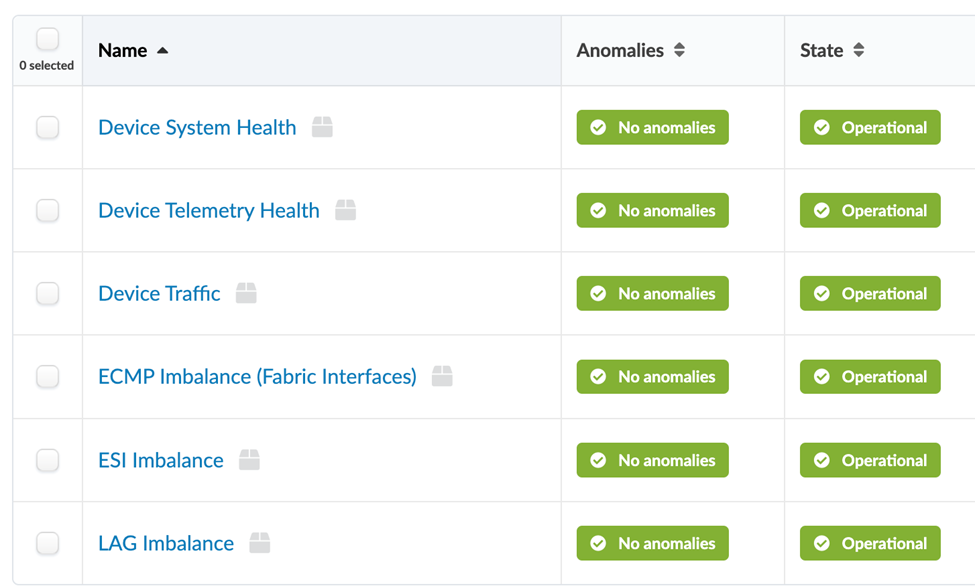
To view all existing probes for your blueprint, navigate to the Analytics dashboard and click the Probes tab.
The following probes are enabled by default:
Predefined Probes Catalog
In addition to auto-enabled probes, you can select predefined probes from a built-in catalog and enable these probes based on your monitoring requirements.
Some predefined probes (such as EVPN or Optical Transceivers probes) activate additional services that start collecting the necessary data from devices and add this data into the probe for analysis.
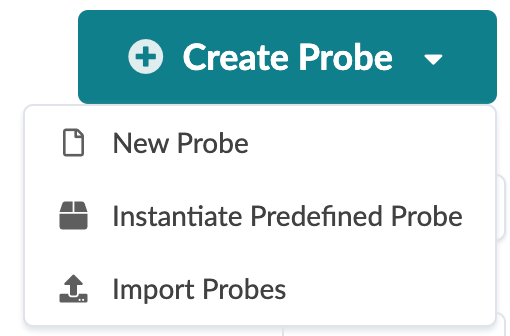
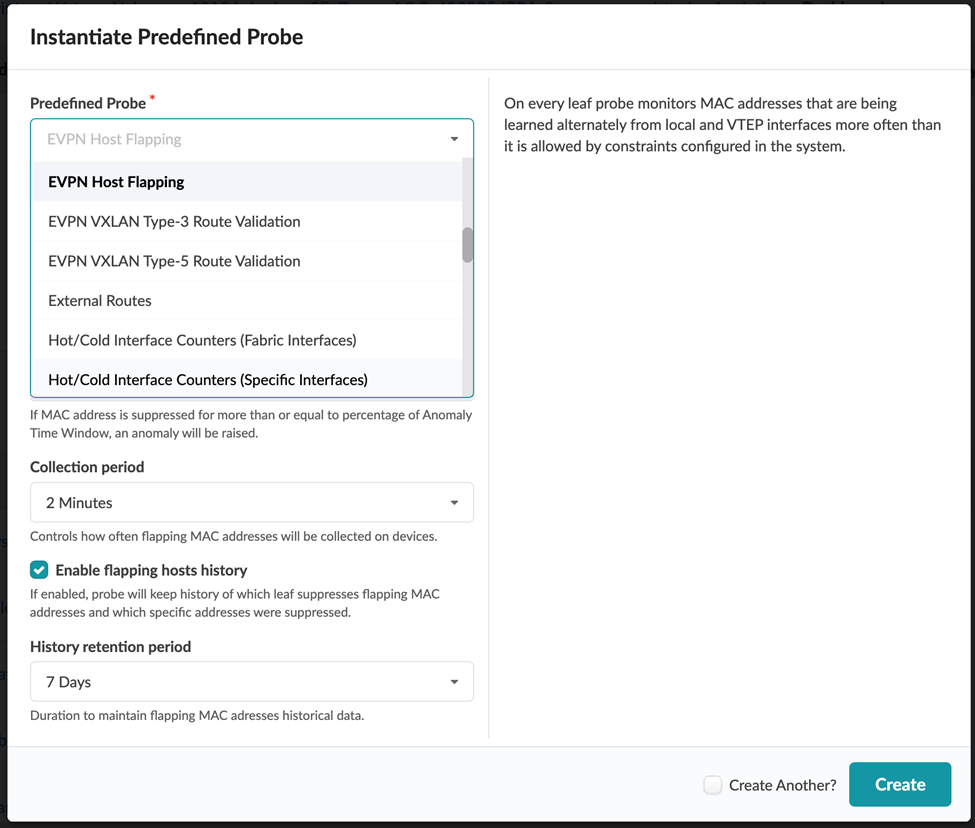
You can access the list of predefined probes from the Instantiate Predefined Probe dialog box.
For detailed information about probes, see Predefined Probes (Analytics) in the Juniper Apstra User Guide.
Custom Probes
If you have a monitoring use case not addressed by any of the default or predefined probes, you must create a new probe.
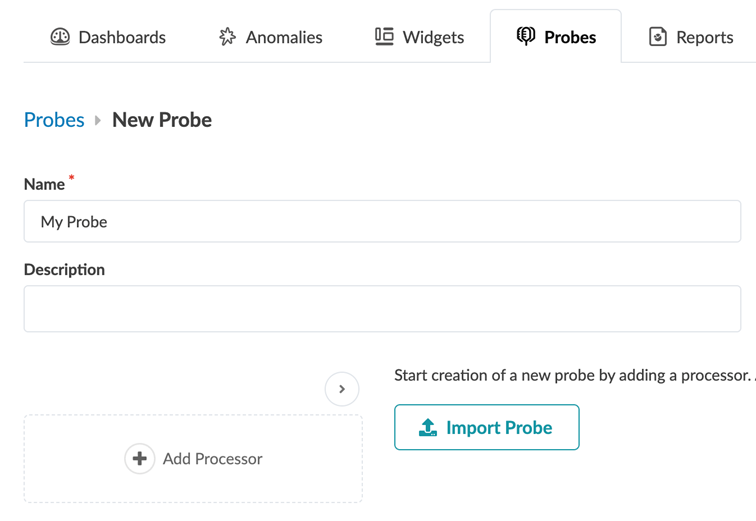
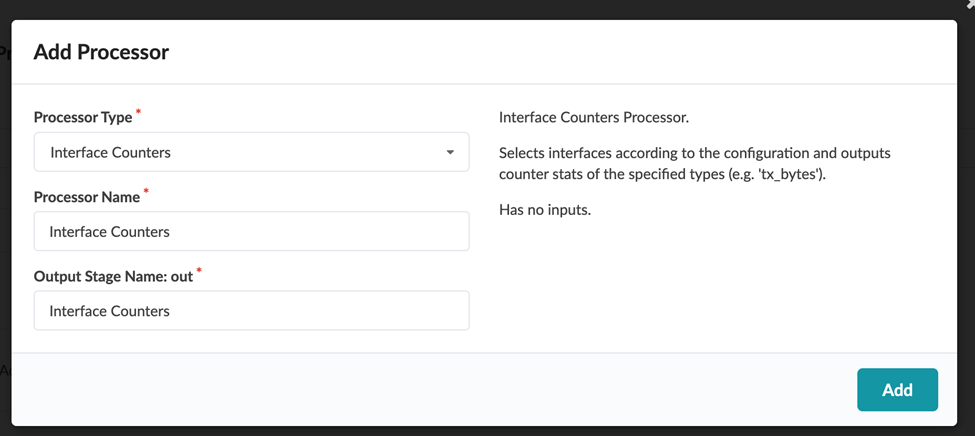
For a probe to be functional, you need to add at least one processor. A processor adds data to your probe from one of the existing telemetry services. A pipeline starts when the processor(s) injects the raw data into the pipeline and is sent to the analytics processor. Analytic processors are also referred to as source processors.
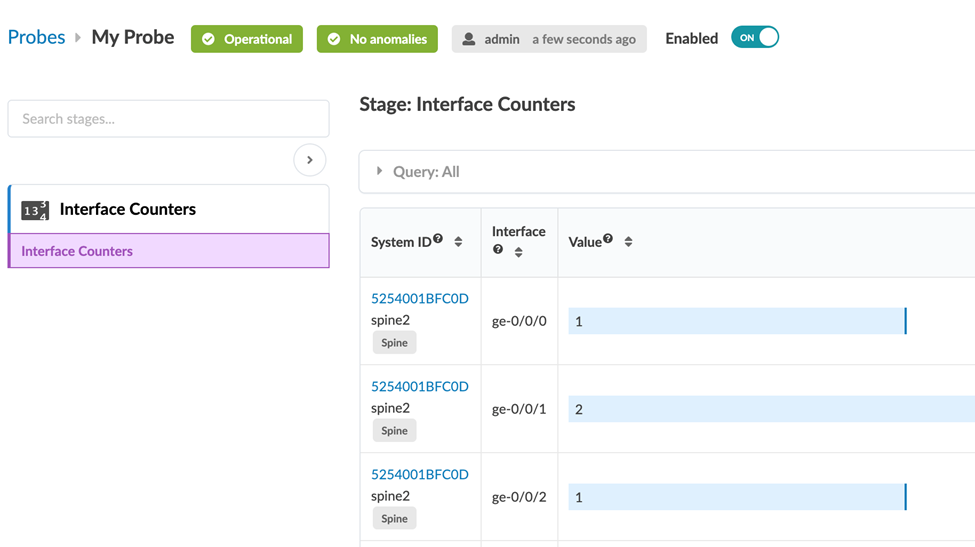
Here is an example of a source processor, whose processor type is Interface Counters.
What If Apstra Doesn’t Collect the Data You're Looking For?
If Apstra did not collect the data you want to monitor, we recommend that you use Apstra's custom telemetry collection feature. Proceed to the next section Custom Telemetry Collection Overview.