Help us improve your experience.

Let us know what you think.

Do you have time for a two-minute survey?


Probe: Device Traffic

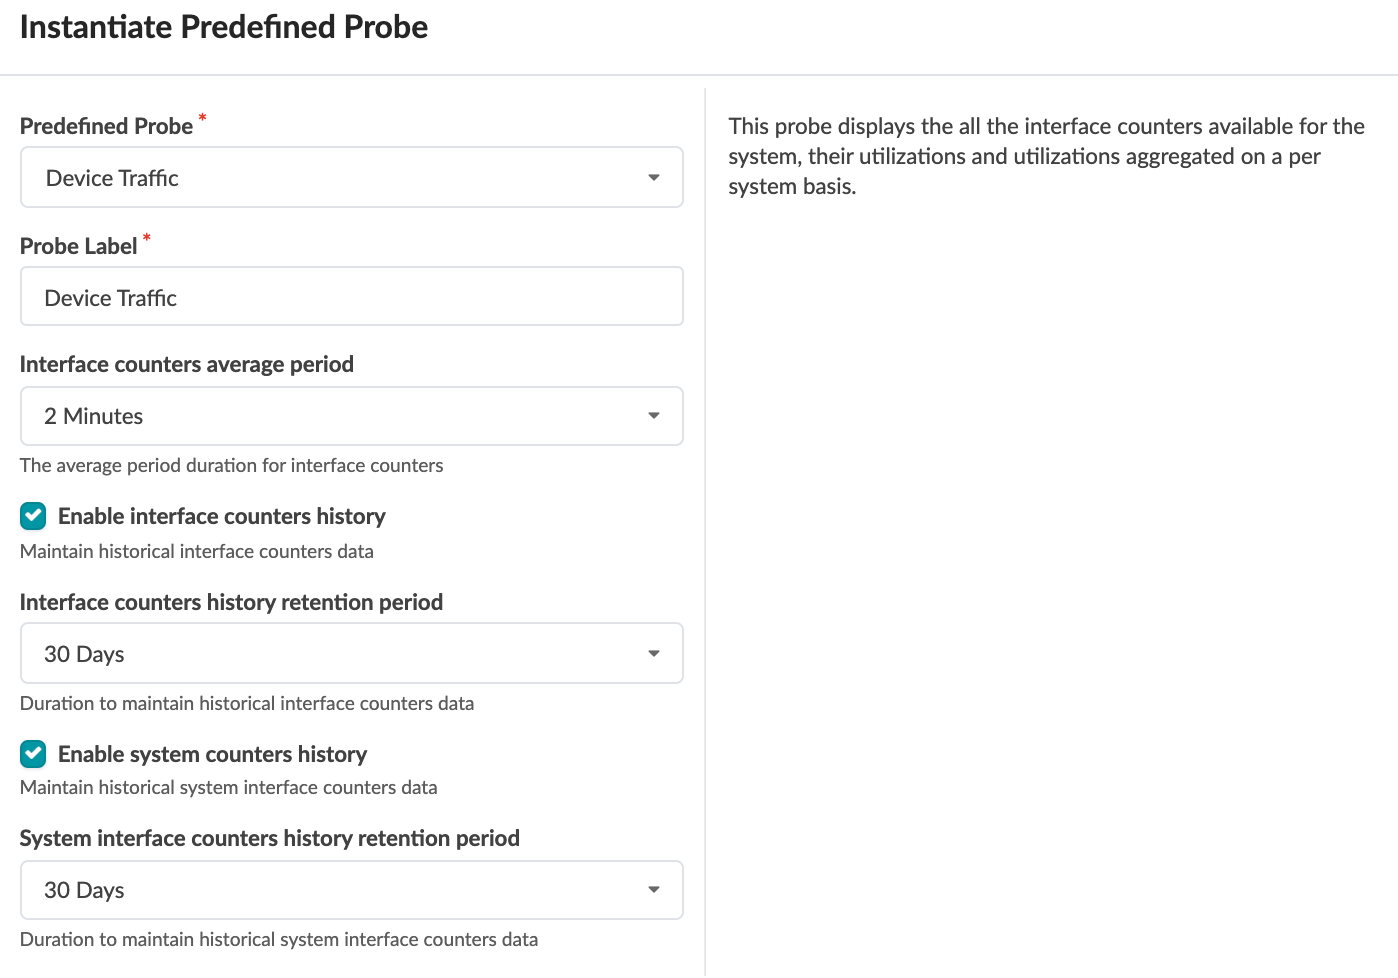
The device traffic probe (previously known as headroom probe) provides insights about link capacity between two points in the network. It provides multiple interface counters (rx, tx, discard, errors and so on) for all managed devices. It displays all interface counters available for the system, their utilization on a per-port and aggregated utilization per-system basis. If rules are violated, it raises anomalies.
Note:

You can change probe inputs, but if you change the probe processors then the probe is not a predefined probe anymore and the traffic layer view is not available in the active topology. For more information about the traffic layer view, see Physical Blueprint.

Source Processor
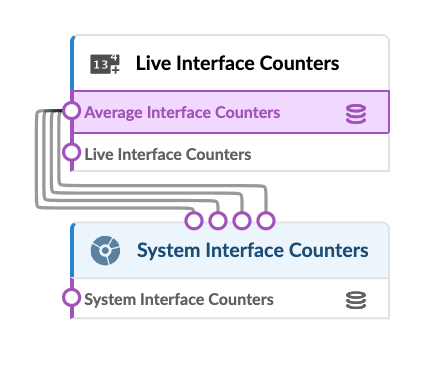
Live Interface Counters (Traffic Monitor)

Purpose: Wires in Interface traffic counters every 5 seconds (by default) for all managed devices and keeps historical data based on retention period specified during probe creation.

Output Stages
Average Interface Counters

Set of interface counters samples, for each port of each managed device, based on specified average time with historical data.

Live Interface Counters

Set of live interface counter samples for each port of each managed device

Additional Processor(s)
System interface counters (System Utilization)

Purpose: This processor consumes in 'Average Interface Counters' for calculating interface counters per system with historical data. It uses properties rx_bps_average, rx_utilization_average, tx_bps_average, and tx_utilization_average to compute the system TX and RX utilization and to compute headroom between the specified source and destination systems.

Input Stage: Average Interface counters

Output Stage: System Interface Counters

Set of system interface counters samples (for each device of managed devices) indicating Aggregated TX/RX, Aggregated TX/RX %, and Max interface TX/RX utilization %. The system level RX/TX calculation aggregates the Tx/RX of all the device interfaces that are "up". The max interface RX/TX calculation is the device interface with the highest Rx and the device interface with highest Tx.

To see traffic between a particular source and destination from the device traffic probe, click System Interface Counters, check the Show Context check box, then select a source and destination from the drop-down lists. Roll over different sections to display relevant information. Different colors represent link capacity, where green means plenty of capacity and red means that the link is running out of capacity.

For more information about this probe, from the blueprint, navigate to Analytics > Probes, click Create Probe, then select Instantiate Predefined Probe from the drop-down list. Select the probe from the Predefined Probe drop-down list to see details specific to the probe.