ON THIS PAGE
Blueprint Summaries and Dashboard
Blueprint Summaries
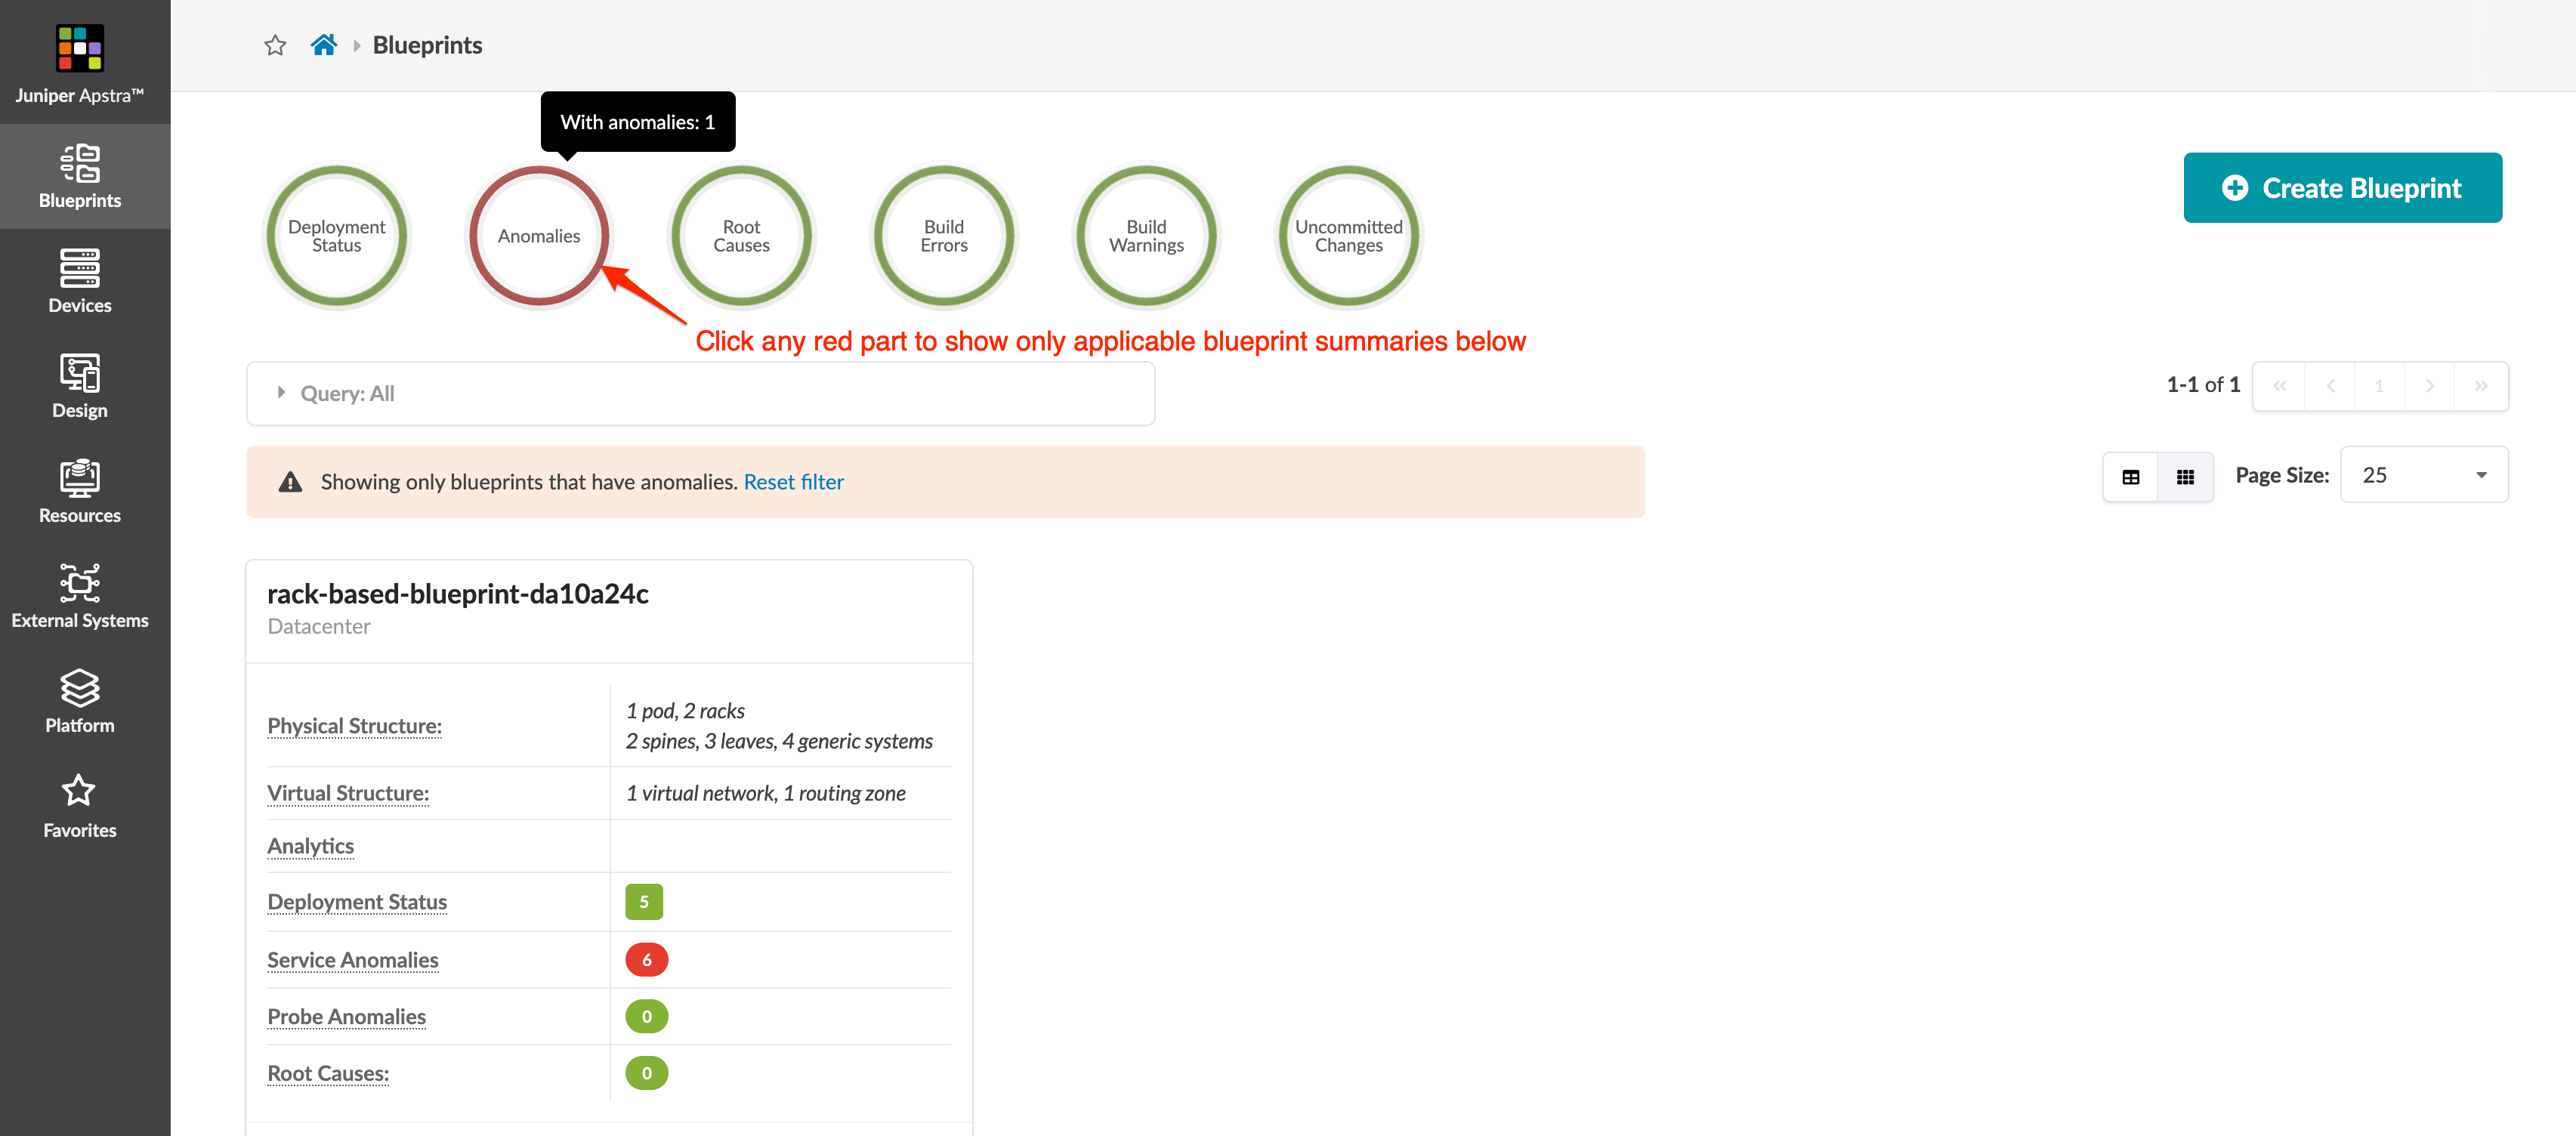
From the left navigation menu, click Blueprints to go to the blueprint summaries page. This page shows a summary of each individual blueprint. At the top of the page, indicators show various statuses across all blueprints (deployment status, anomalies, root causes, build errors and warnings, and uncommitted changes. This is useful when you have many blueprints in your Apstra instance. To quickly filter to show only blueprints that meet a certain criteria, click one of the indicators. If blueprints don't have any issues, the indicators are green. If there are any issues, the indicator is red. In the example below, clicking the red part in Anomalies results in displaying only the blueprints that include anomalies. (This Apstra instance has only one blueprint anyway, but you get the idea.)
Blueprint Dashboard
From the left navigation menu in the Apstra GUI, click Blueprints,
then click the name of a blueprint to go to its dashboard.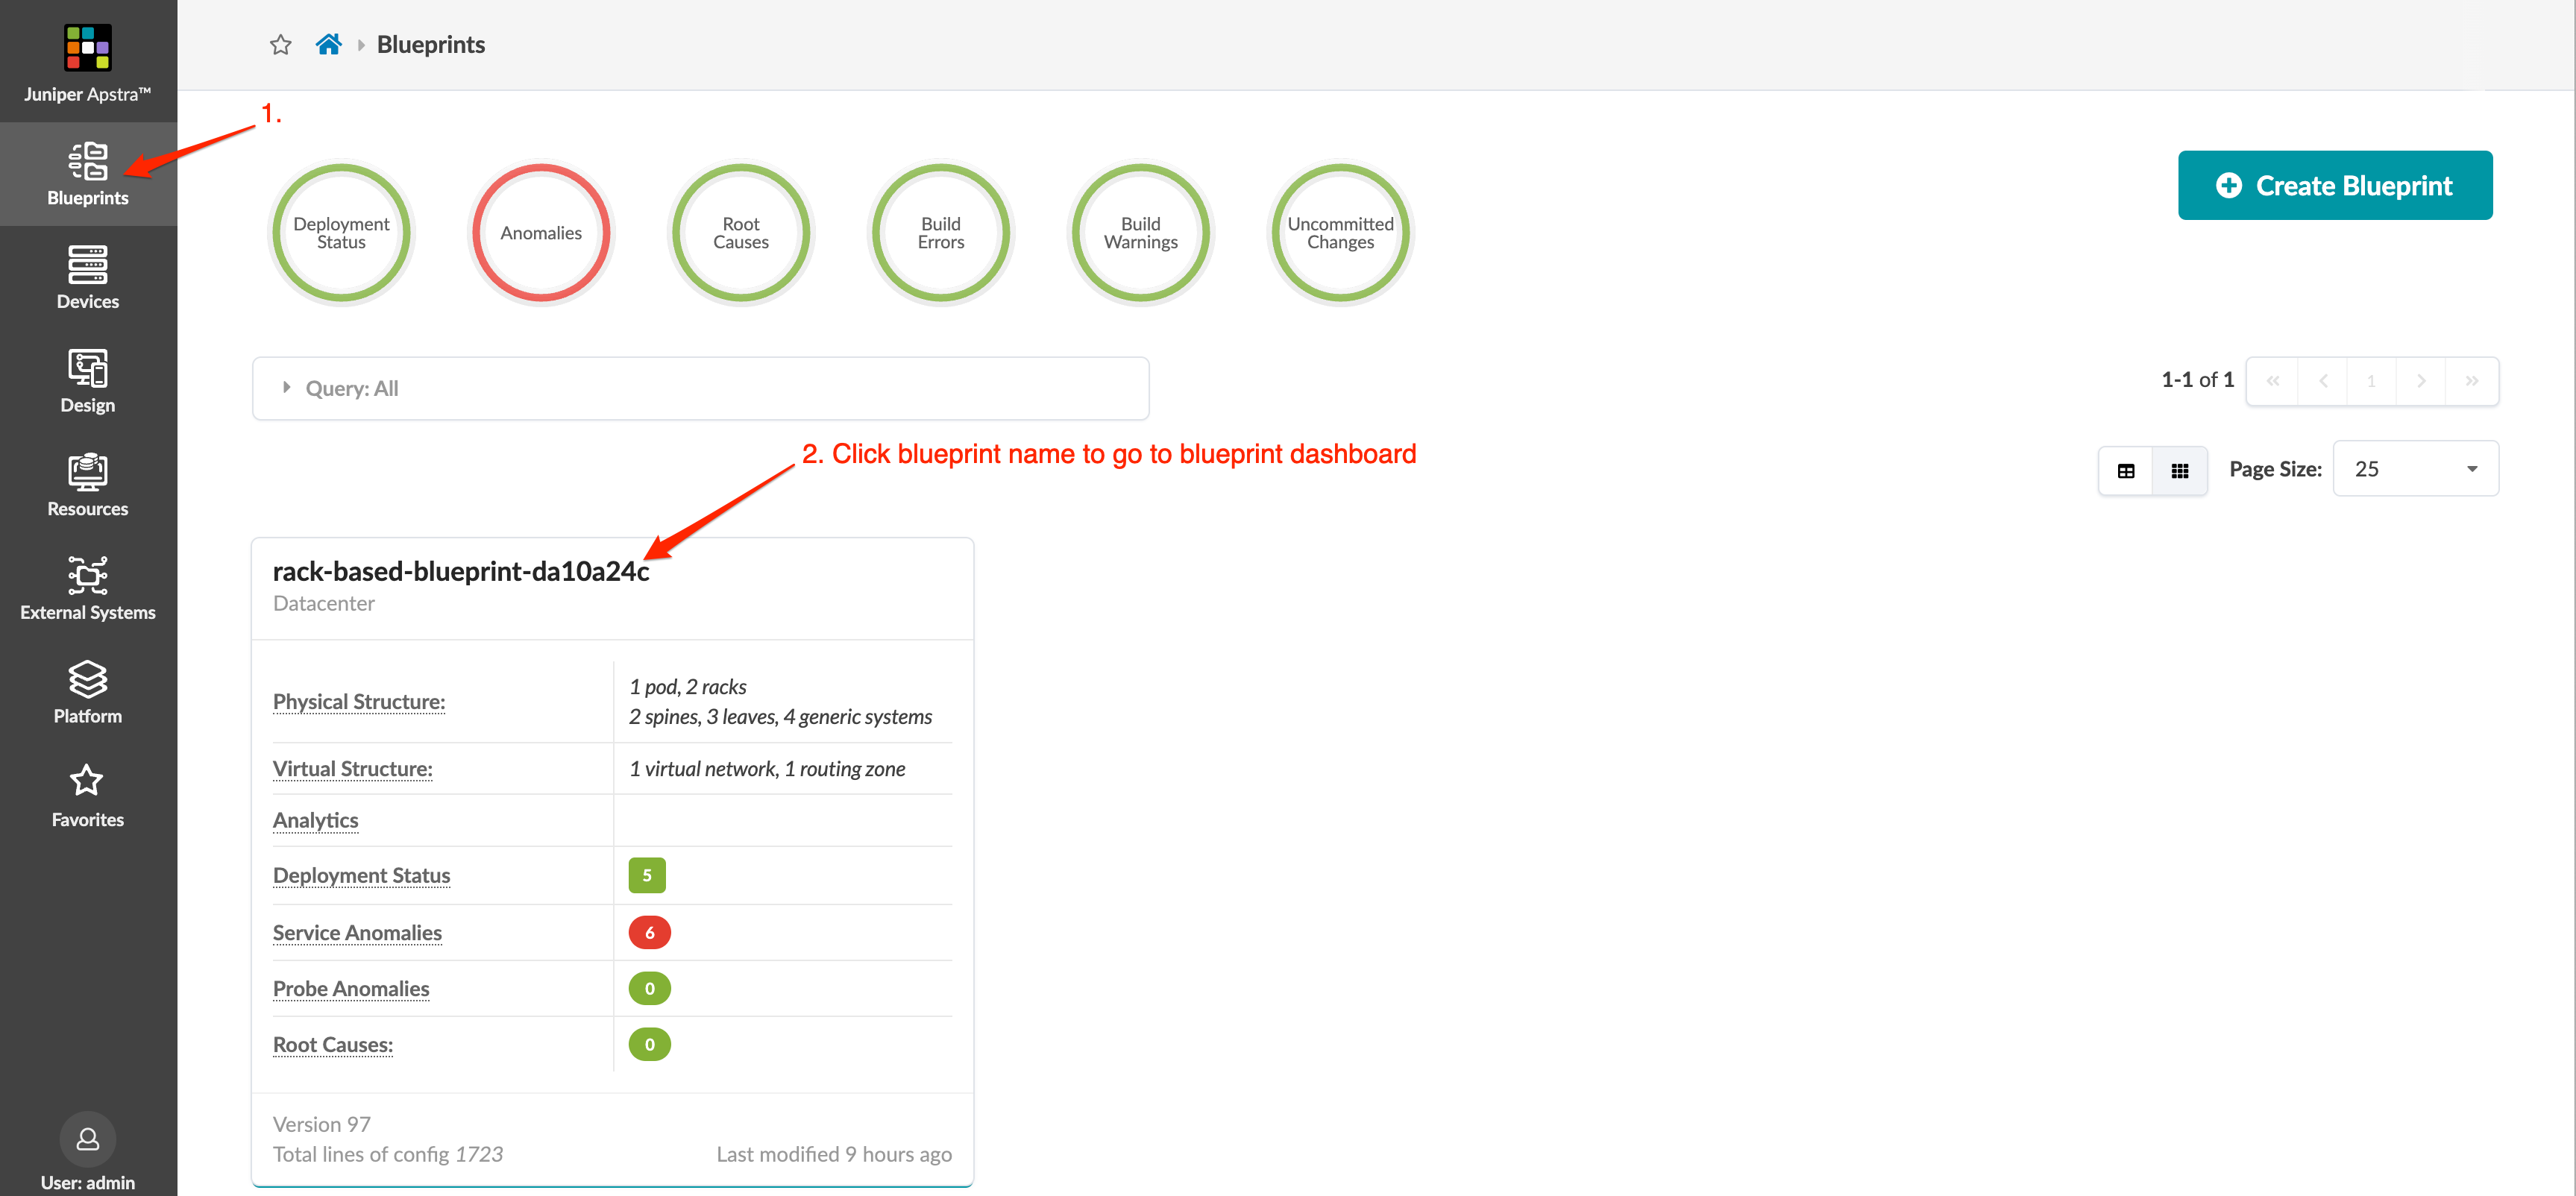
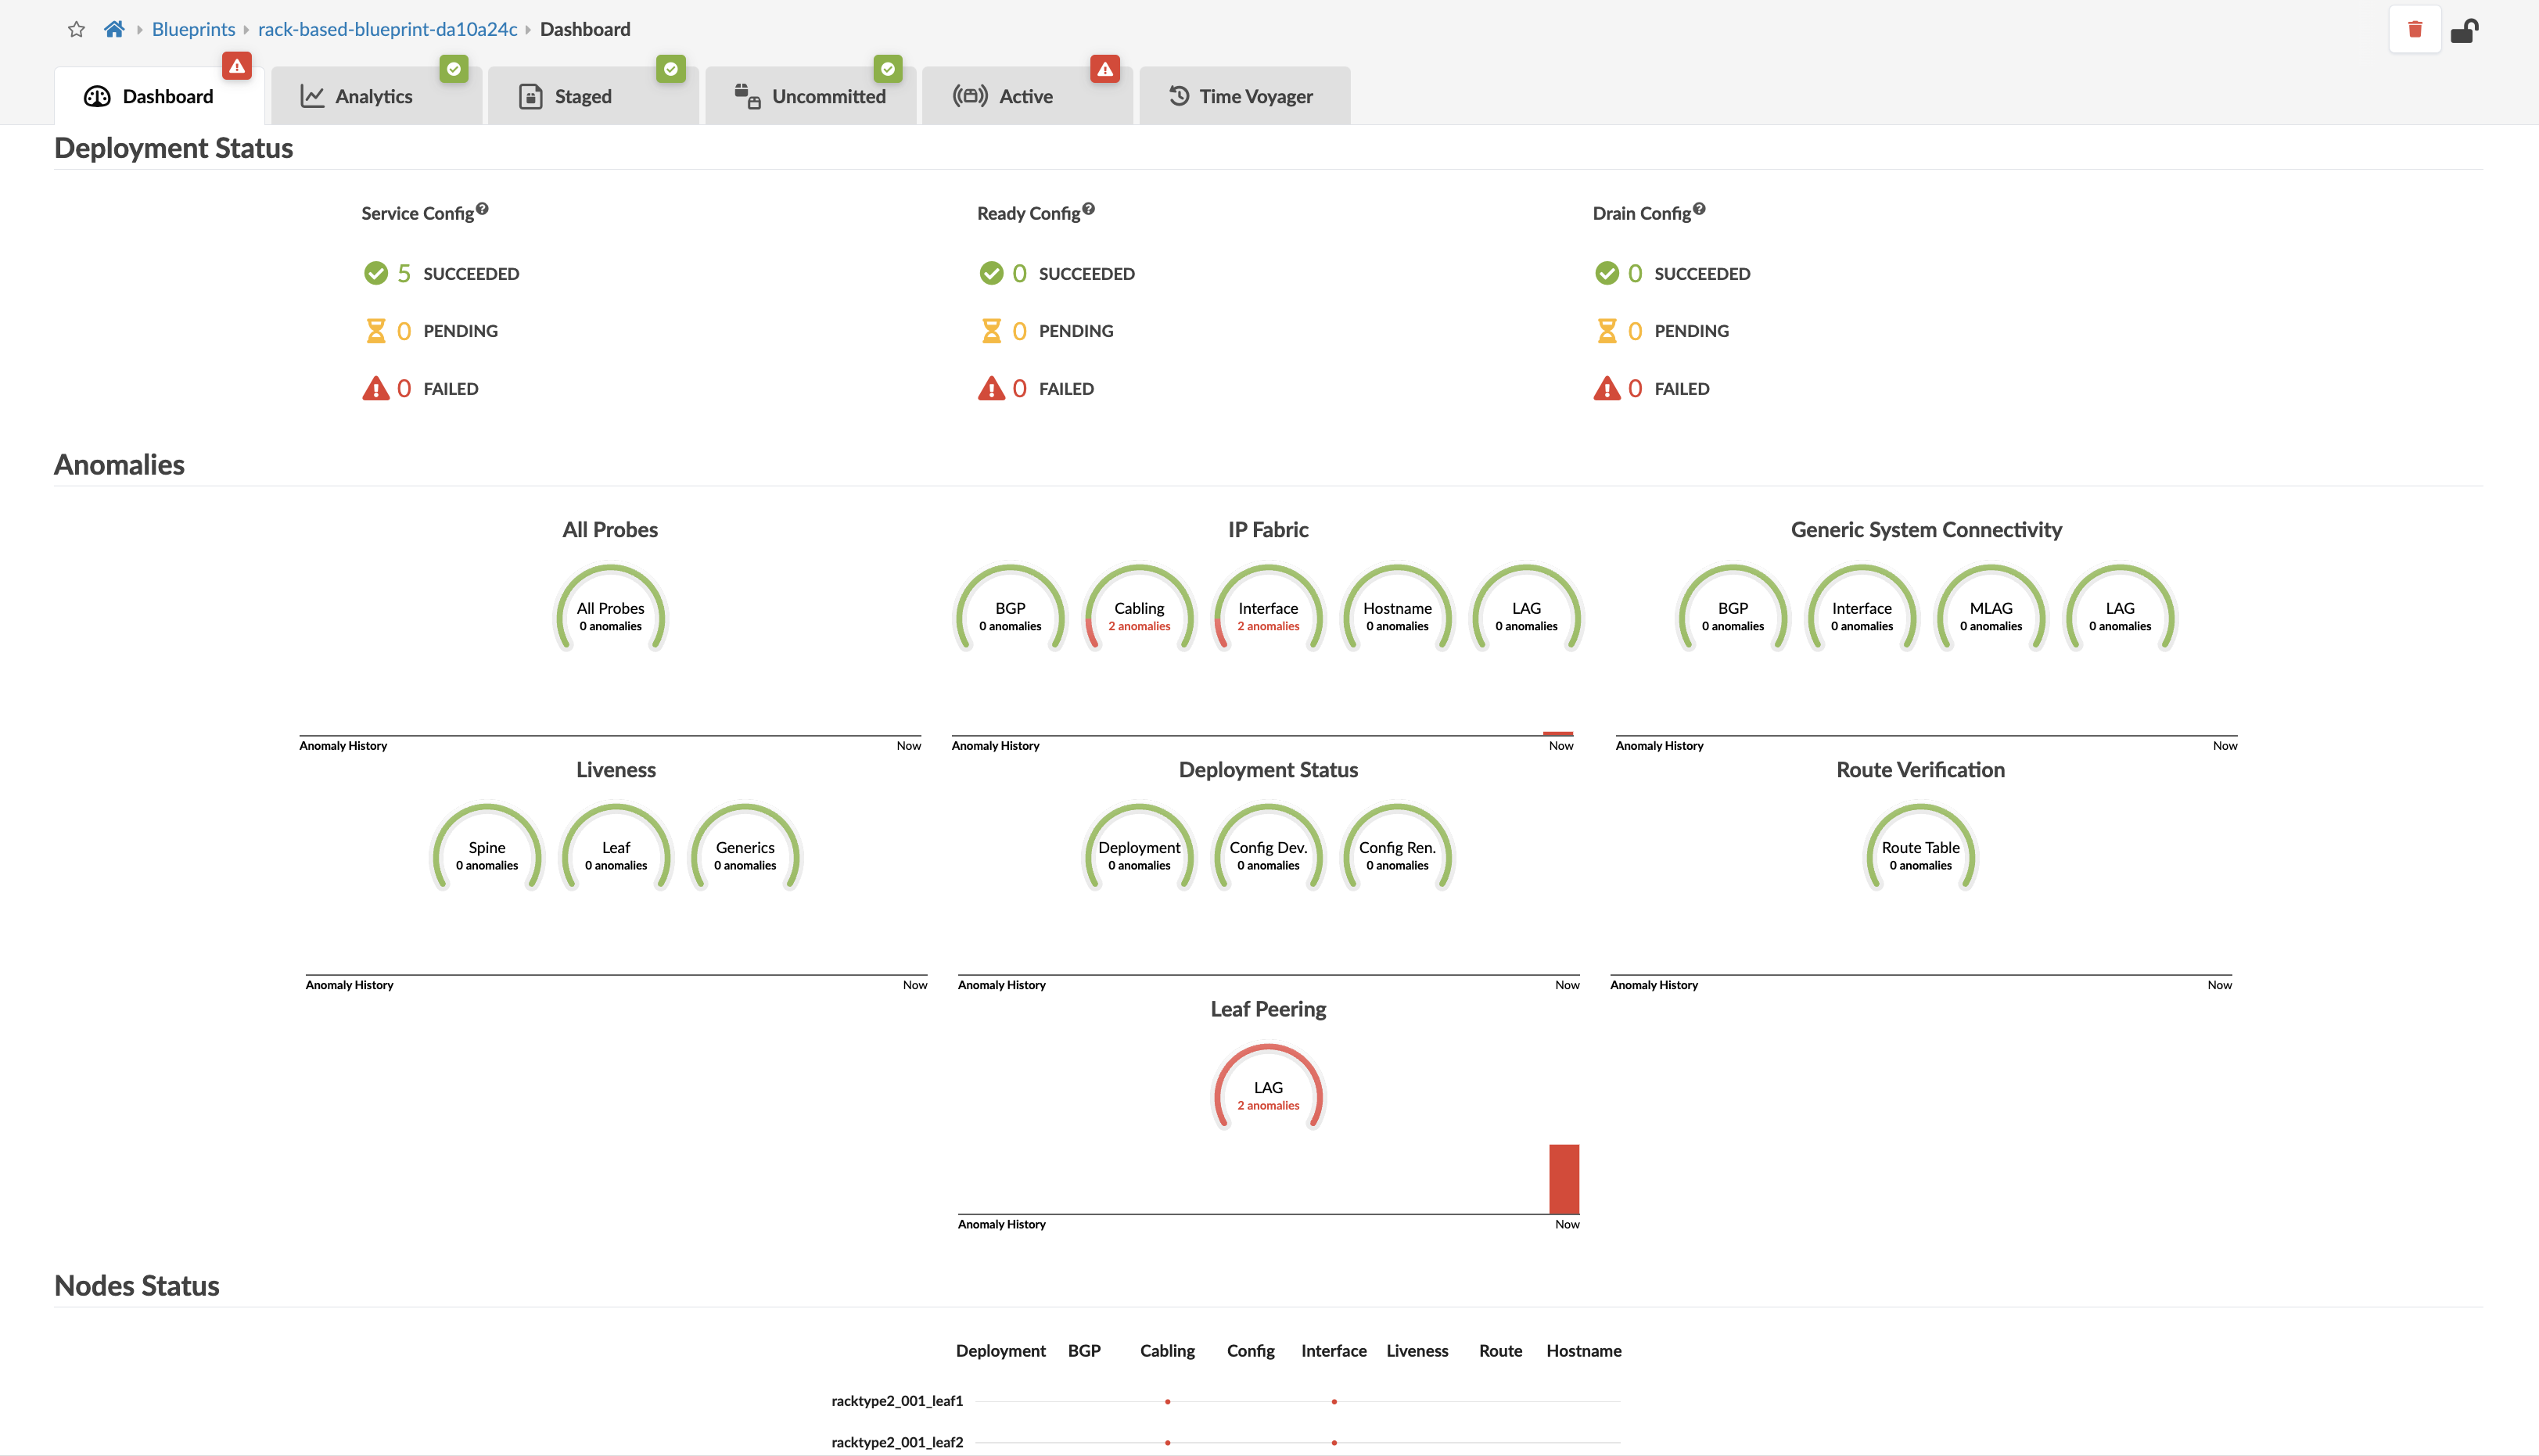
The dashboard shows the overall health and status of a blueprint. Statuses are indicated by color: green for changes that succeeded, yellow for changes that are in progess, and red for changes that failed. The deployment status section includes statuses for service configuration, ready configuration, and drain configuration. The anomalies section includes statuses for all probes, IP fabric, generic system connectivity, liveness, deployment status, route verification, leaf peering, and more. The nodes status section includes statuses for deployment, BGP, cabling, config, interface, liveness, route, and hostname. You can see in the example below, we have some issues with the IP fabric and leaf peering. You can click the red indicators for details.
You can display analytics dashboards on the blueprint dashboard to have additional network information on one screen. To add them, navigate to Analytics > Dashboards and turn ON the analytics dashboards' default toggle.