Help us improve your experience.

Let us know what you think.

Do you have time for a two-minute survey?


Launch the Apstra Flow Dashboard

Congratulations! You successfully installed and configured Apstra Flow on your network. Now you're ready to login to the Apstra Flow dashboard to begin analyzing and visualizing your data.
Note:

You can also access the Apstra Flow dashboard directly from your blueprint in the Apstra GUI. See Access the Apstra Flow Dashboard from the Apstra GUI for instructions.

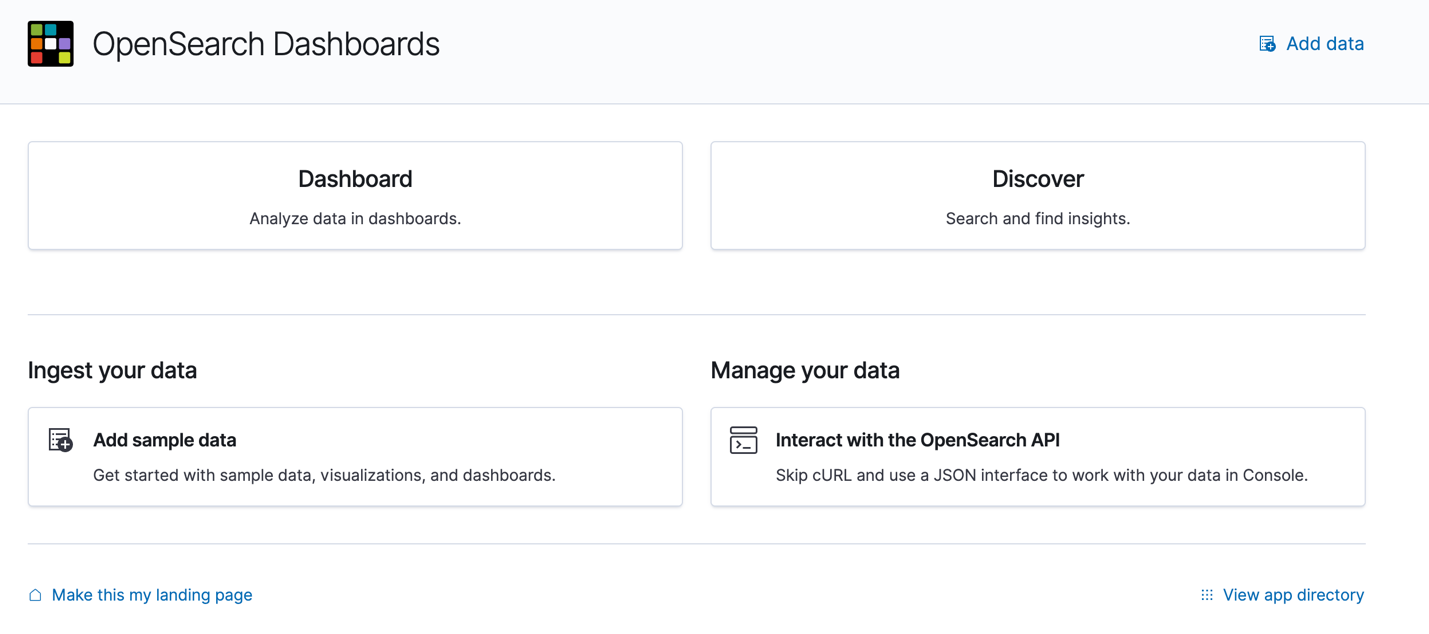
To launch the Apstra Flow dashboard:
  1. From your browser, enter the IP address or hostname of your Apstra Flow VM.
    https://<ip-or-hostname-of-flow-data-vm>:5601/
  2. Login to the Apstra Flow dashboard.
    The default credentials are:
    • Username: admin

    • Password: Apstra-Flow5

    Note:

    We recommend that you change your password after you log in.

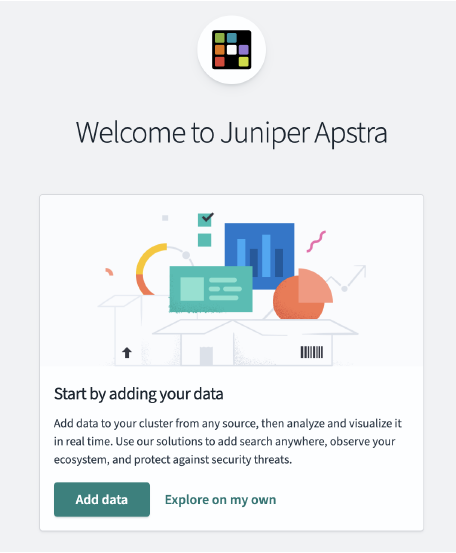
  3. From the Welcome page, select Explore on my own.
    Welcome screen for Juniper Apstra with options to add data or explore independently.
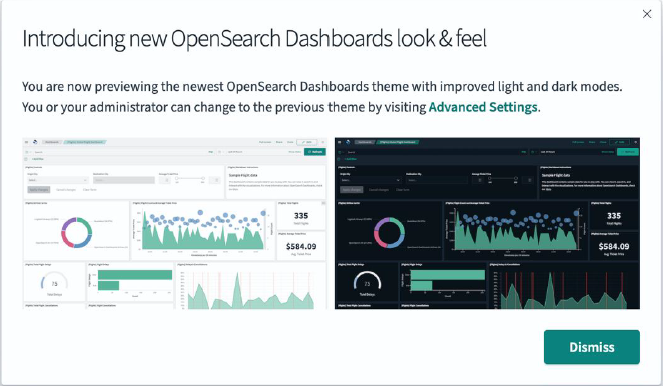
  4. From the OpenSearch Dashboards page, click Dismiss.
    OpenSearch Dashboards announcement showcasing new light and dark themes with option to revert in Advanced Settings.
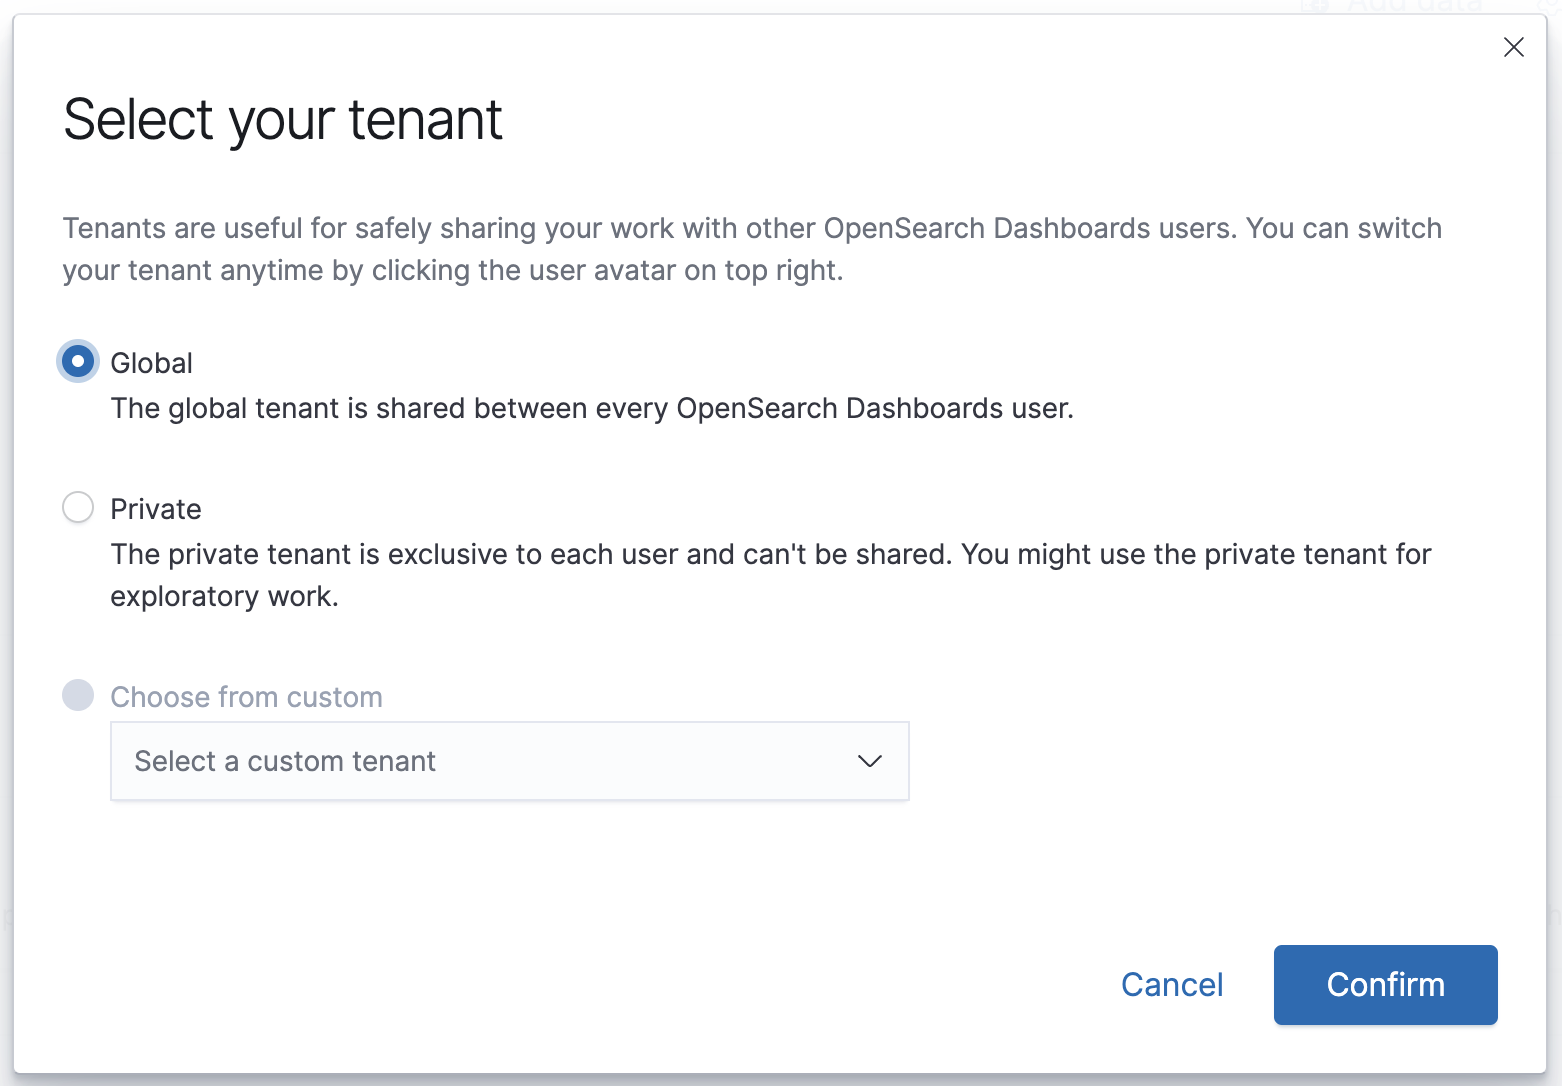
  5. Select Global as your tenant, then click Confirm.
    Dialog box prompting tenant selection in OpenSearch Dashboards with options Global, Private, and Custom. Confirm or Cancel.
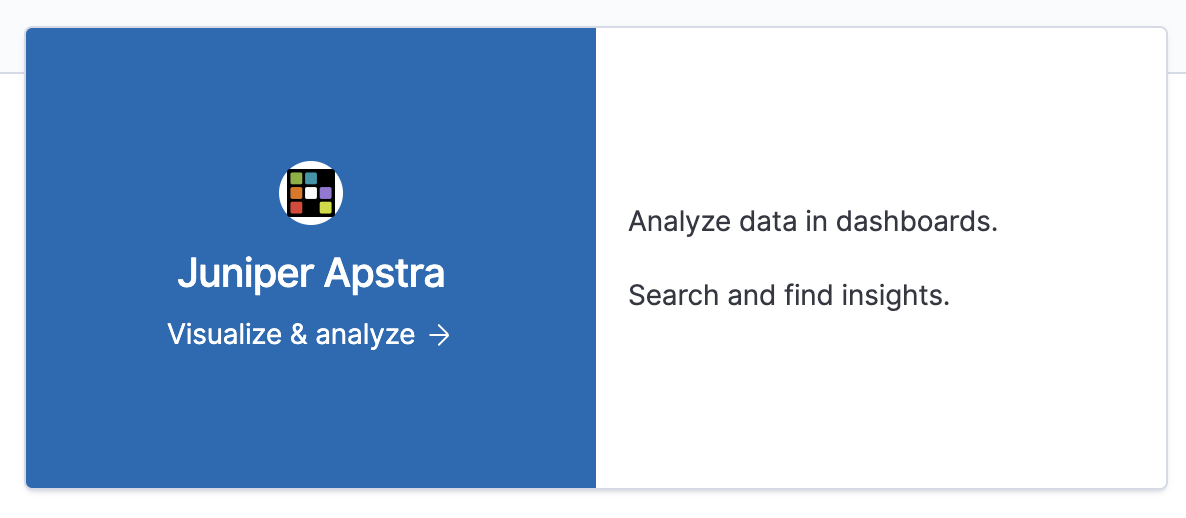
  6. Click Visualize and Analyze.
    Juniper Apstra logo with text: Visualize and analyze. Right side: Analyze data in dashboards, Search and find insights.
  7. Click Dashboard from the OpenSearch Dashboards page.
    OpenSearch Dashboards home page with options: Dashboard, Discover, Ingest your data, Manage your data, Add data link, Make this my landing page checkbox, View app directory link.
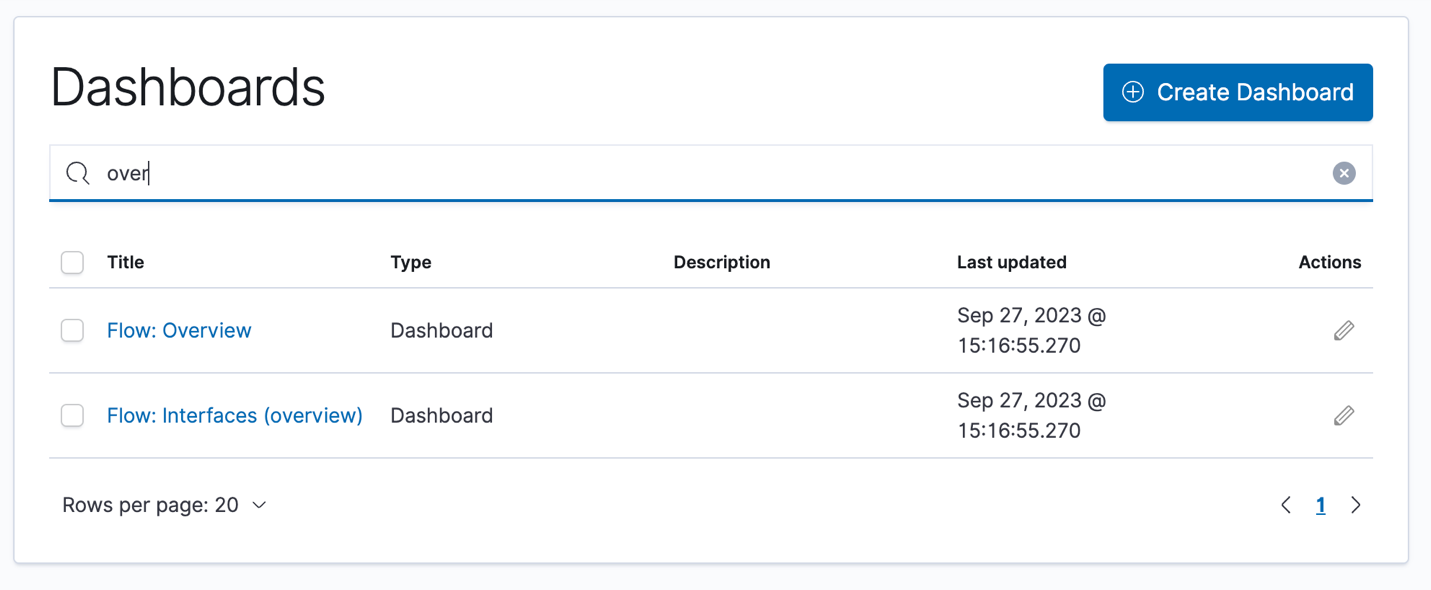
  8. Search for Overview in the Dashboards search bar.
    User interface for managing dashboards with search term over filtering results. Two dashboards listed: Flow: Overview and Flow: Interfaces overview. Both are Dashboard type, last updated September 27, 2023. Create Dashboard button is at top right, pagination controls at bottom.
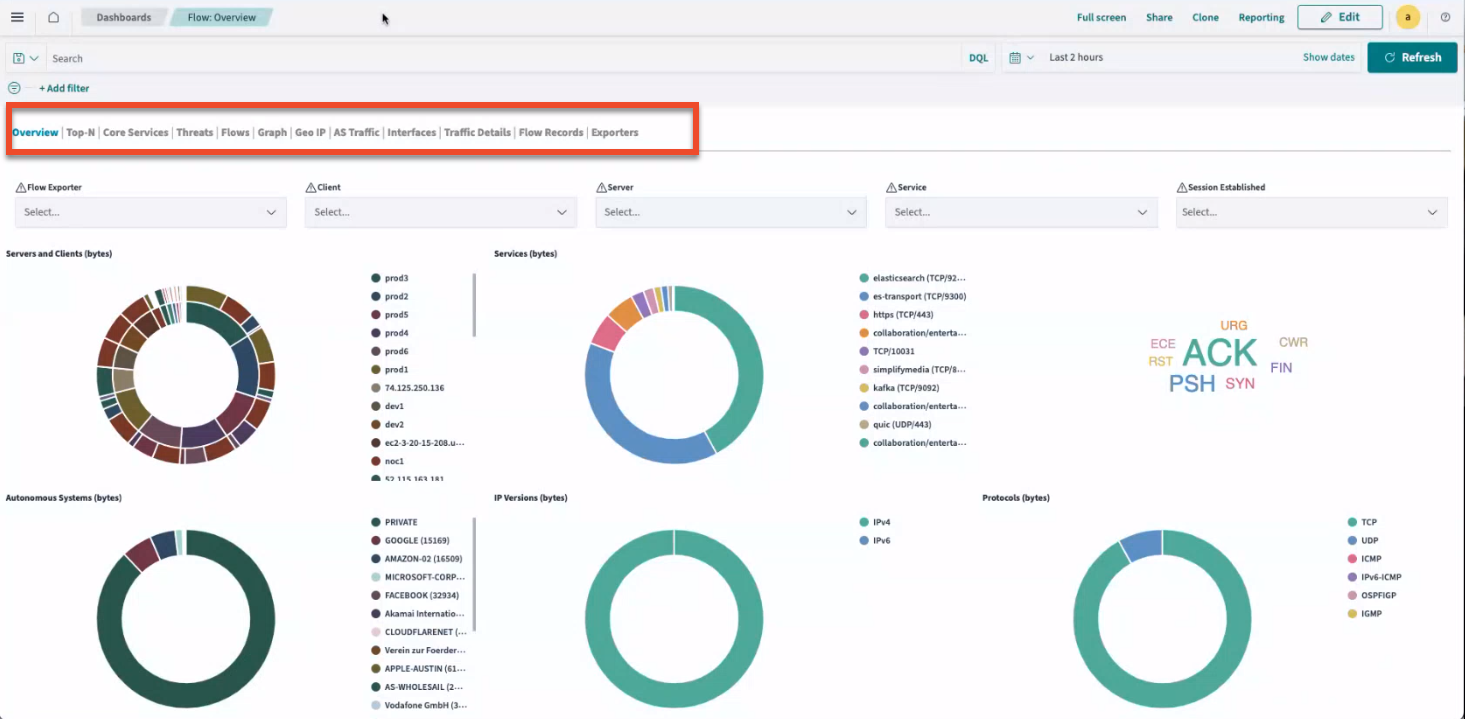
  9. Select Flow: Overview to see the main dashboard. From here, you can view the various dashboards to analyze and to visualize your data. Each dashboard shows a different perspective of your network traffic. For example:
    Network monitoring dashboard titled Flow: Overview with tabs for navigation, filters for data refinement, donut charts for traffic metrics, a word cloud for TCP flags, a time range selector, and action buttons for interaction.

Access the Apstra Flow Dashboard from the Apstra GUI

Although Apstra Flow has its own dashboard, you can also link directly to the dashboard from the Apstra GUI.
To access the Apstra Flow dashboard from the GUI:
  1. From the left navigation menu, select Analytics > Flow Data > Flow Collectors.
  2. From the Flow Collectors page, click Create Flow Collector.
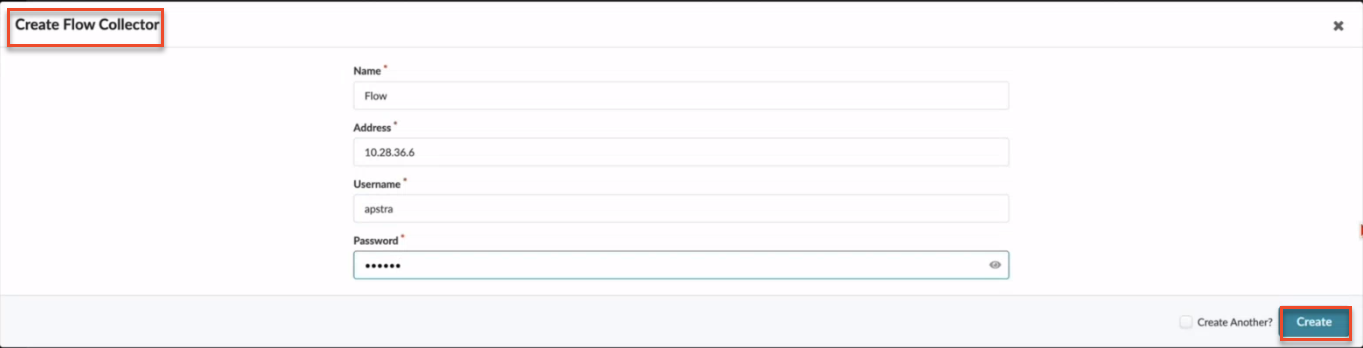
  3. Enter the flow collector name, address, username, and password, then click Create.
    This information tells Apstra where your VM is located so you can access the flow collector and visualization dashboards.
    User interface for creating a Flow Collector with fields for name, IP address, username, password, a Create button, and Create Another checkbox.
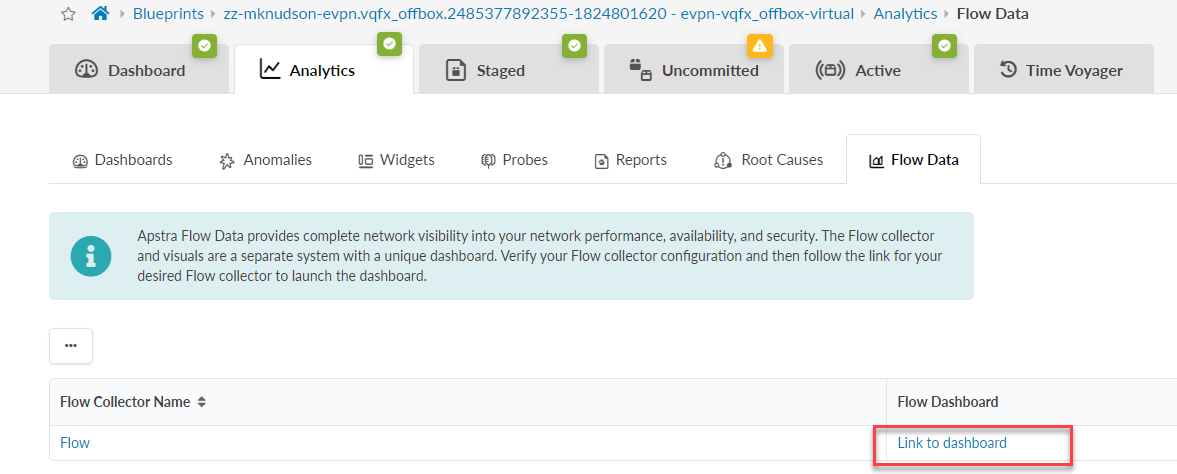
  4. Go back to your blueprint and click the Analytics link.
    Dashboard showing network configuration blueprint zz-mknudson-evpn.vqfx_offbox with green status indicators for anomalies and errors, orange for uncommitted changes. Datacenter details: 1 pod, 2 racks, 2 spines, 3 leaves, 5 systems, 3 routing zones, 17 virtual networks. Version 156, 8533 config lines, modified 21 days ago.
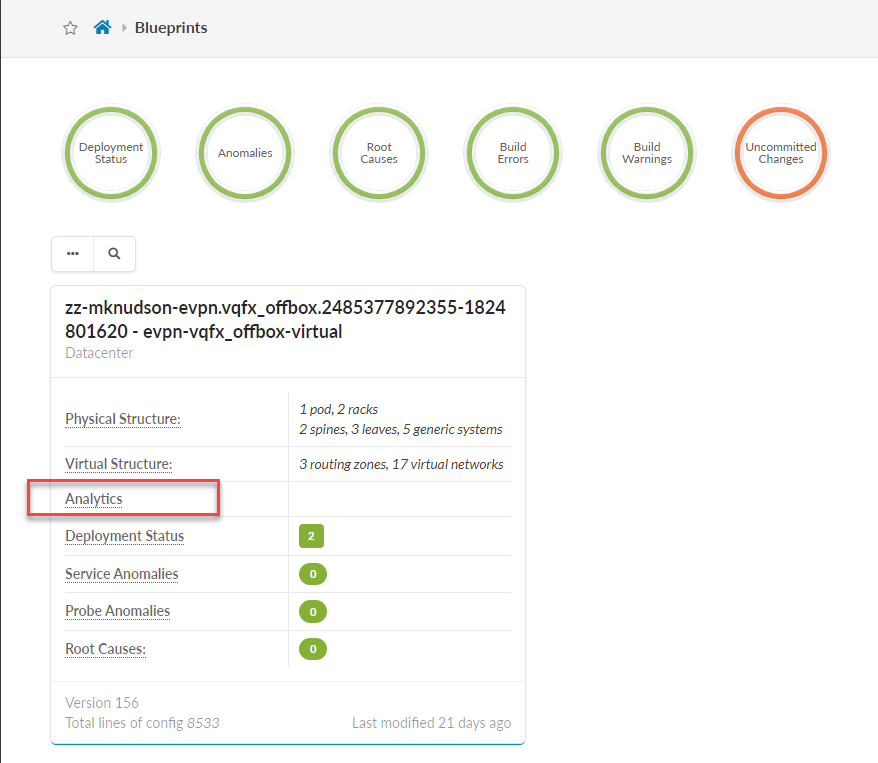
  5. Select Analytics > Flow Data.
    Apstra platform interface showing Analytics tab with Flow Data. Highlighted link to Flow Dashboard for detailed network analysis.
  6. Under the Flow Dashboard column, click Link to dashboard.
    This link takes you to the Apstra Flow dashboards that you can use to manage your network. For an overview of the dashboards, see the Flow Data Dashboards.
For more details about Apstra Apstra Flow, see the Analytics chapter in the Juniper Apstra User Guide.