Creating a Custom Telemetry Collector
SUMMARY This topic describes the steps that are required to create a custom telemetry collector.
In this topic, we'll walk you through creating your own custom telemetry service using BFD as an example. In our example, the telemetry service collects the state of the BFD sessions you just configured. Our goal is to alert operations that a BFD session is down.
Execute the CLI Command
You can execute CLI commands from within the staged or active blueprint (shown in our example), or from the Devices > Managed Devices page.
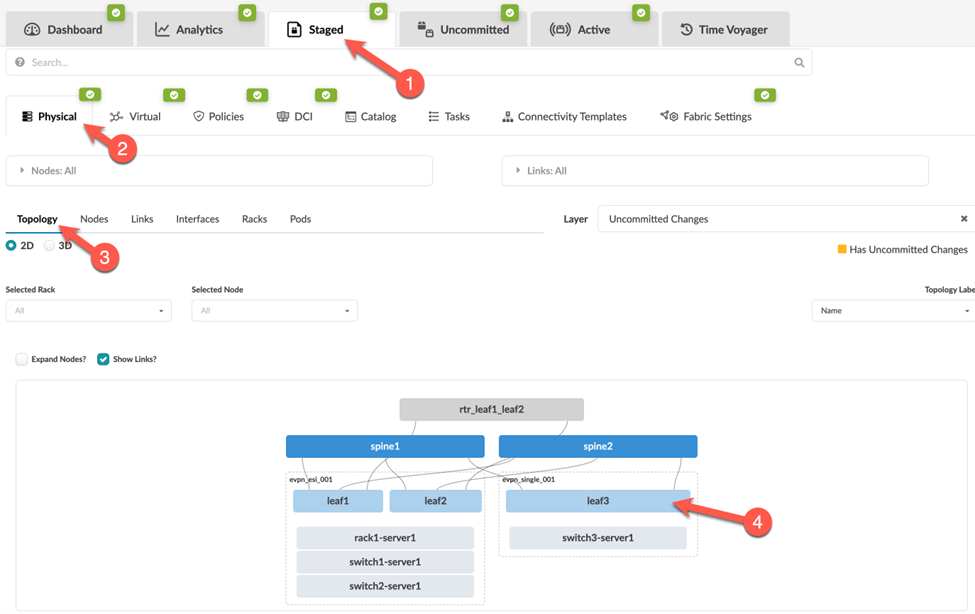
To use the CLI command feature, navigate to a deployed Junos device in your blueprint as follows:
-
From your blueprint, select Analytics > Staged Physical
Topology (or Staged > Physical >
Nodes) and then select your Juniper device node.
-
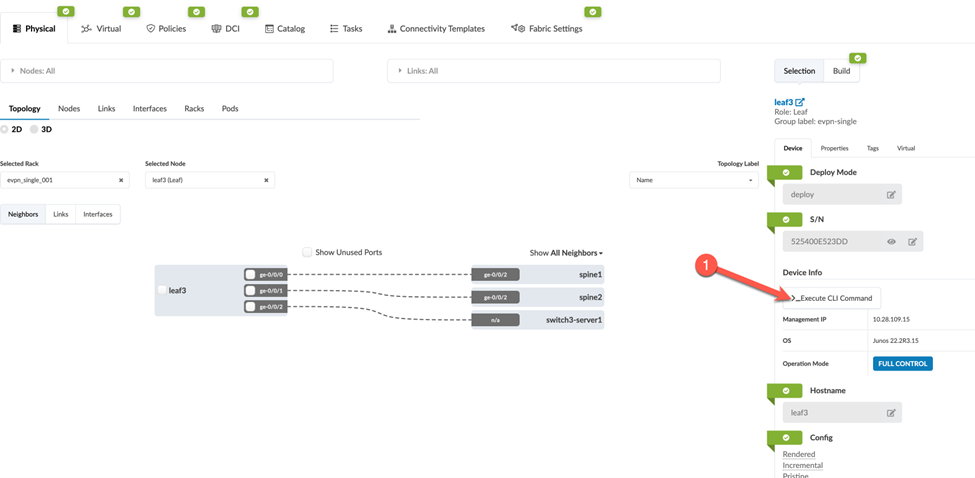
In the Selection section that appears in the right
panel, on the Device tab, click Execute
CLI Command.
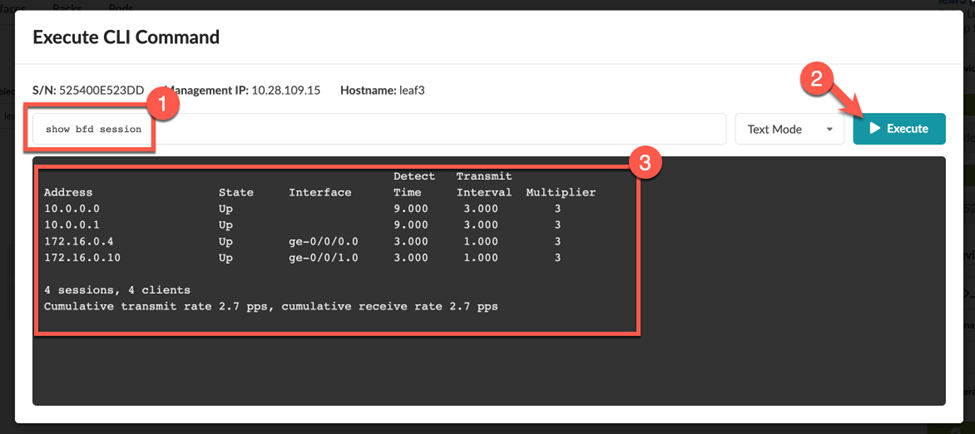
 In the dialog box that opens, select how you want to view the results: Text Mode, XML Mode, or JSON mode. Here we show examples of Text Mode and XML Mode.
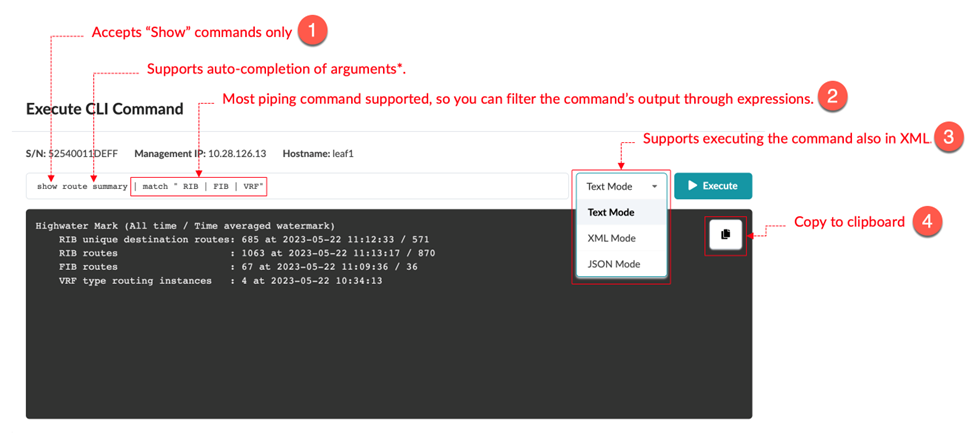 Note:
Note:The CLI supports only Junos show commands. You cannot run commands that affect the device state, such as
request system
                                    reboot
. For information about the various show commands, see the CLI User Guide for Junos OS.Now, run the same show command (
show route
                                summary
), but choose XML Mode.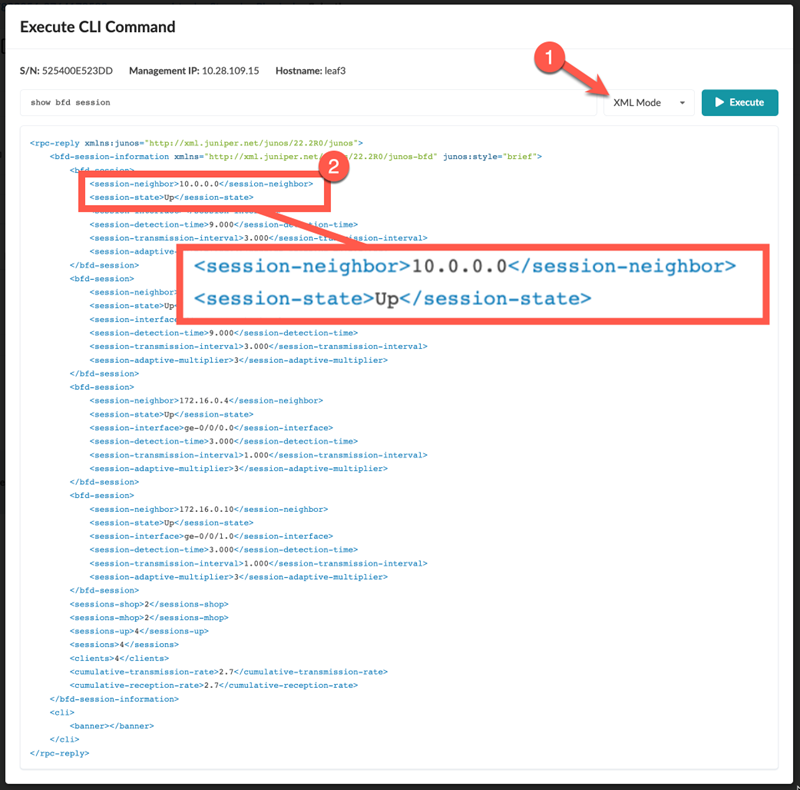 In the XML output, the XML path (BDF session) information is highlighted. This session information is what we'll use to create our telemetry collection service.
Identify the Key and Value of Interest from the CLI Output
-
Click Execute to view the CLI output.
Create a Service Schema
A single telemetry service schema can have multiple collectors associated with it.
-
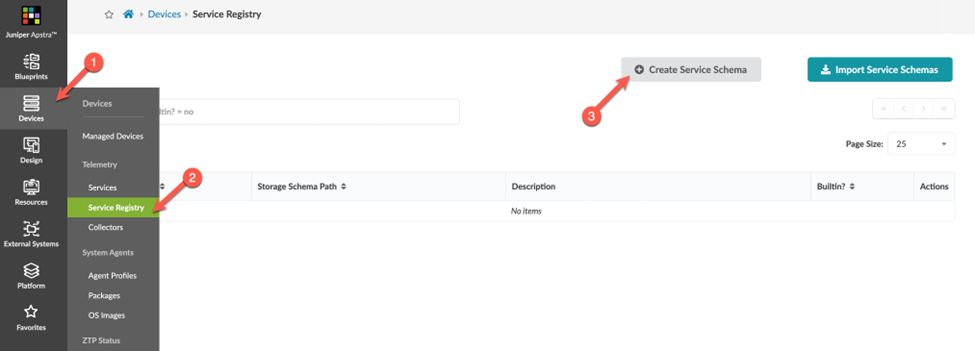
From the left navigation menu, navigate to Devices > Service
Registry and click the Create Service
Schema button.
-
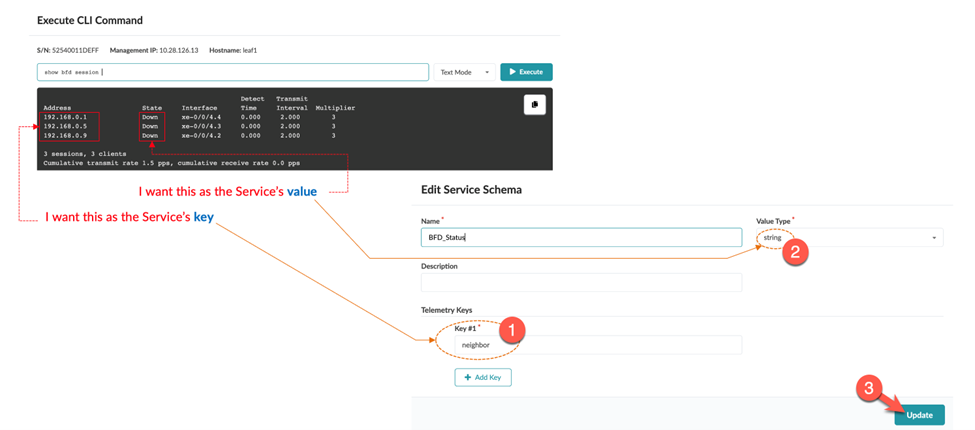
In the dialog box that opens, define your schema. This step identifies how
the collector output is to be structured.
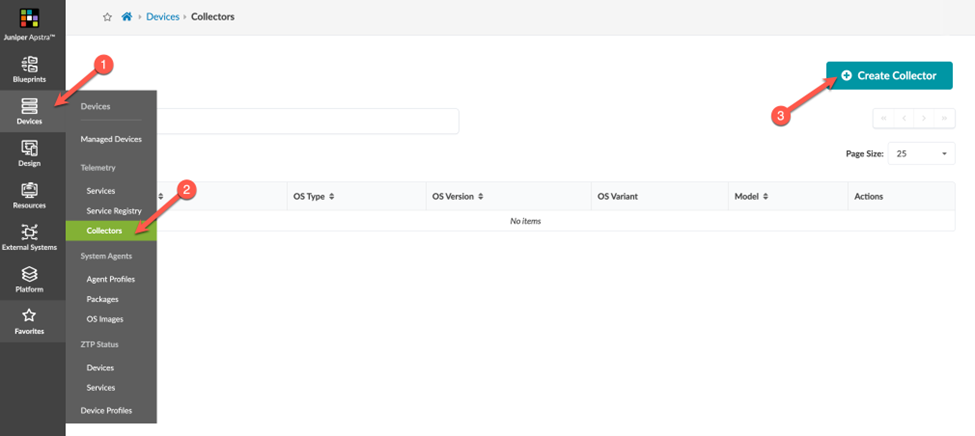
Create a Collector
A single telemetry service schema can have multiple collectors associated with it.
-
From the left navigation pane, navigate to Devices >
Collectors > Create Collector.
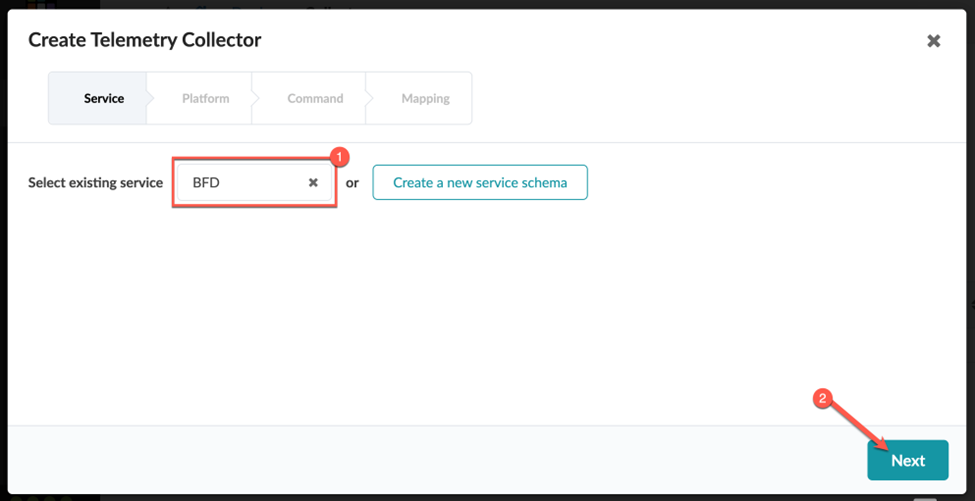
-
Select the existing service schema (BFD) you created in the previous step
and click Next.
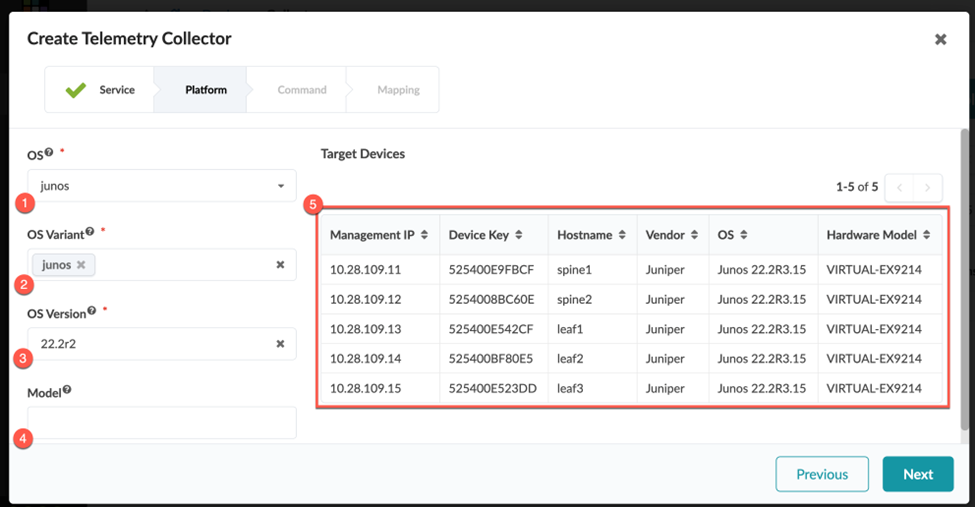
-
Select the platform (OS, OS Variant, OS version, and Model) and devices to
target for telemetry collection. Defining a mix of these inputs enables you
to be very broad or very granular. For example, you might have a use case
where you only want to apply telemetry on the border leaf devices.
-
Run the CLI command.
Use the show command to gather the date you want to collect from the device (in this example,
show bdf session).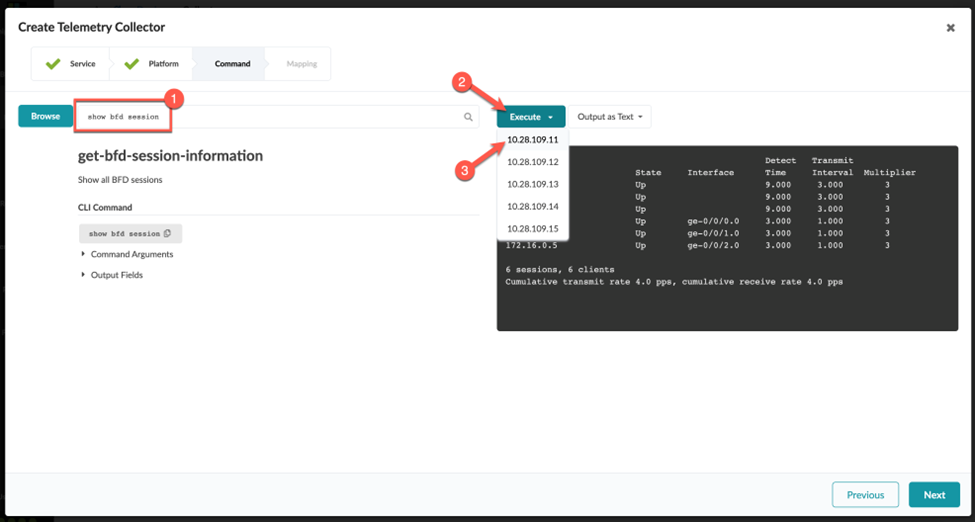
-
Map the Keys and Value.
So far, we've defined the service schema, the target platforms, and the command the custom telemetry collector will execute. Next, we'll map the key(s) you defined in your schema and the value you want to track.
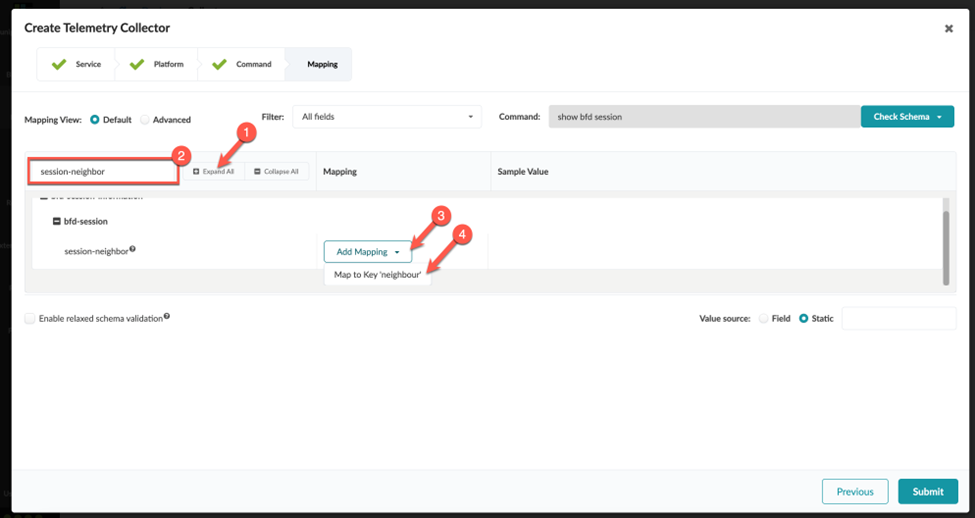
To map the keys:
-
Click Expand All to search for the RPC value
you want to map.
In the previous step, we established session-neighbor as the key value.
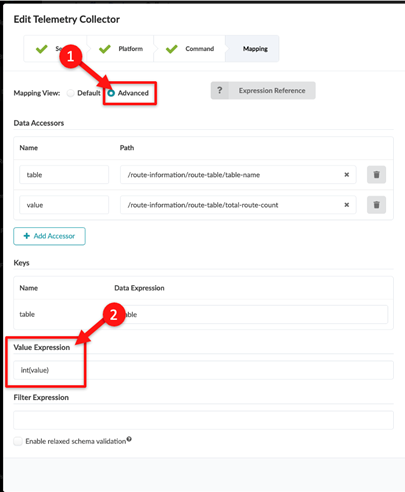
To map the value:-
Select the Value Source. In our example, we
want to populate the value based on the dynamic
session-statefield returned by this CLI command.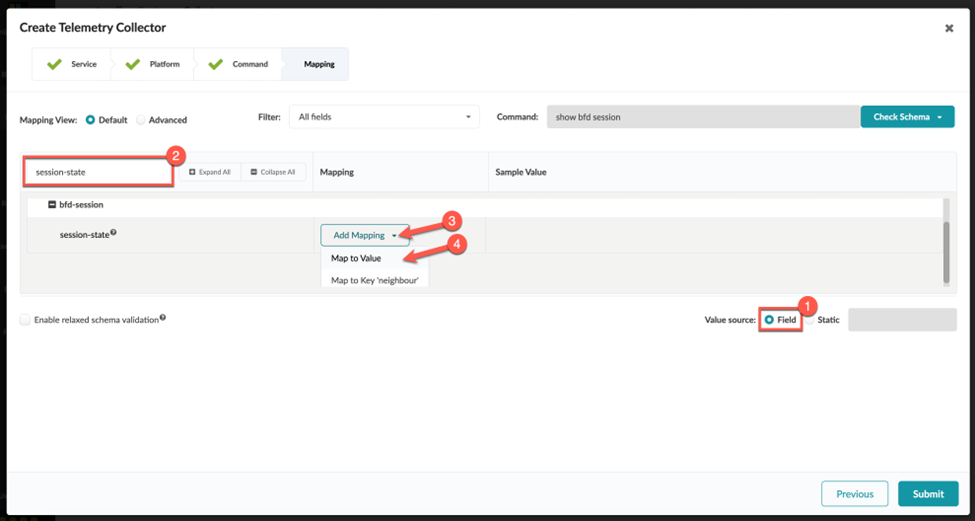
-
Click Expand All to search for the RPC value
you want to map.
Validate That the Collector Is Working
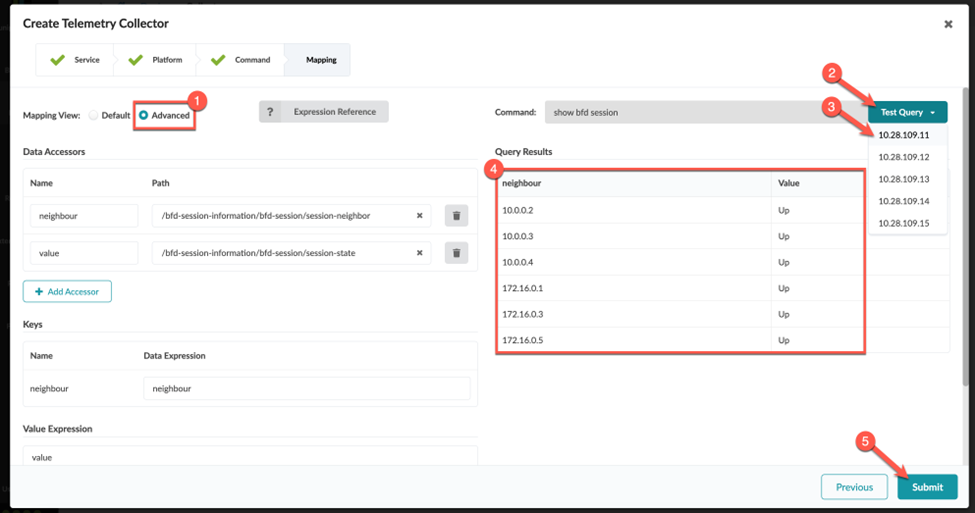
Congratulations! You successfully created a collector.
When you define the integer (number) values for a collector, you might need to enter a value expression for the collector to function. This is because Junos occasionally reports number data as a string. Before the collector can be processed, you must perform a conversion from string to integer on the Apstra side.